Lupine Publishers Group
Lupine Publishers
Menu
ISSN: 2638-6070
Research Article(ISSN: 2638-6070) 
Chemical, Spectrocopical and Chemiometric Analyses of Vegetable Oils Submitted to Thermal Stress
Volume 4 - Issue 1Yao Tsung Lee1, Donyau Chiang2, Mao Kuo Wei3 and Sanboh Lee1*
- 1Department of Materials Science and Engineering, National Tsing Hua University, Taiwan
- 2Taiwan Instrument Research Institute, National Applied Research Laboratories, Taiwan
- 3Department of Materials Science and Engineering, National Dong Hwa University, Taiwan
Received:June 10, 2021; Published:June 22, 2021
*Corresponding author:Sanboh Lee, Department of Materials Science and Engineering, National Tsing Hua University, Hsinchu 30013, Taiwan
DOI: 10.32474/SJFN.2021.04.000179
Abstract
In this work, chemical transformations and kinetic behavior of raw soybean oil and olive oil samples were evaluated by traditional and spectroscopic methods after continuous thermal stress. Initially, a multivariate classificatory study (PLS-DA) was carried out, using data from mid-infrared spectroscopy to differentiate 44 commercial oils samples (olive, canola, sunflower, corn and soybean). In this step, 19 important spectral regions were selected for sample’s classification. Two figures of merit were calculated (sensitivity and specificity) with this model presenting values above 83.3% of sensitivity for all classes and above 71.4% for 4 classes in specificity. In the next stage, soybean oil and olive oil samples were subjected to thermal stress for 15 h (5 h / day) at 200 °C. The results obtained by tradition methods as total acidity index demonstrated that soybean oil has a greater variation when compared to olive oil, and that after 4 and 11 hours of heating, soybean oil and olive oil, respectively, were outside the Brazilian Health Surveillance Agency standards. For the peroxide index, it was possible to determine that both oils suffered oxidation and the results demonstrated also that soybean oil suffered a greater degradation in relation to olive oil. Finally, a PCA, using mid-infrared data from the kinetic studies of soybean and olive oils thermal degradation, were carried out and proved that molecular changes occurred basically in 8 spectral regions, resulting from the formation of sub products resulting from the thermal oxidation of the fatty acids presented in the samples.
Keywords:Vegetable oils; mid infrared; thermal stress; PLS-DA; PCA
Introduction
Vegetable oils represent one of the main products extracted from plants, and a large part of this production is destined for food products. These oils could also be used as raw materials for paints, varnishes, lubricants and cosmetics [1-3]. However, when used as food, they are important sources of lipids [1-6]. However, it is known that foods containing oils and fats oxidize during storage at atmosphere containing oxygen, due to self-oxidation. In addition, when these foods are exposed to high temperatures (fried foods), this oxidation process becomes more accelerated, occurring oxipolimerization reactions and thermoxidative decomposition [7,8]. A series of complex reactions occurs during the frying process, causing irreversible changes in the structure of oils and fats. These changes are mainly due to: (i) the moisture, which causes hydrolytic reactions of the triacylglycerol molecules (TG); (ii) oxygen from the air, which comes into contact with the food through the surface of the container, leading to oxidation reactions and, (iii) temperature, approximately 200 ºC, which causes thermal changes [9-11]. It is common to consume foods after frying processes with vegetable oils [12-15]. At the end of the process, certain foods submitted to this process have about 50% of total polar compounds formed, resulting from the oxidation of oil and fats (Brazilian Health Surveillance Agency - Anvisa, regulates that this value does not exceed 25%) [16]. These polar compounds can cause reactions in the human body, such as: irritations in the intestinal tract, diarrhea and reduced growth [17,14]. One of the greatest difficulties encountered in determining the maximum frying time that a vegetable oil can be subjected to, and remains within the parameters described by ANVISA, occurs because they are generally used in different foods and under different conditions, which may or not influence the oxidation speed [16]. Due to the high consumption of these oils, new studies are always interesting to evaluate the maintenance of physical-chemical, sensory and organoleptic properties after frying [18]. In this case, the present work proposes, first, (i) a spectroscopic and chemometric study for evaluate the differences between five vegetable oils, followed by a (ii) second study of the chemical changes in the process of frying olive and soybean oils discussing the main spectral regions affected by that. Finally, the work presents results (iii) of iodine and peroxide index obtained by classical methods of analysis.
Material and Methods
Reagents
The reagents used in this work presented analytical grade and belonged to the Chemistry Laboratory from Ifes - campus Vila Velha.
Samples
Forty-four refined soybean oils (Glycine max), corn (Zea mays), sunflower (Hellianthus annuus), canola (Brassica campestris), and olive oil (Olea europea) were purchased from local markets in Vitória City, ES, Brazil.
Mid-Infrared spectroscopy (MIRS) analysis of the vegetable oils
The Forty-four samples of five vegetable oil types were analyzed (olive oil, canola, sunflower, corn and soybean) by midinfrared spectroscopy. Aliquots of 5 μl of each vegetable oil sample were added to commercial KBr tablets and analyzed. The IR spectra were collected on a Spectrum BX 79589 Perkin Elmer spectrometer, using 20 scans between 4000 - 400 cm-1 with 2 cm-1 resolution. All samples were collected in triplicate.
Vegetable Oils Thermal Stress
Approximately 1000 mL of two samples of soybean oil and olive oil were heated on a heating plate with controlled temperature at 200 ºC, for 3 days, 5 hours a day, in a refractory glass bottle (PIREX®). The aliquots of the analyzed oils were removed every hour and at the end of each heating day.
Free Fatty Acids Quantitative Determination (% of oleic acid)
To determine the amount of free fatty acids (FFA), 2 g of each oil sample were dissolved in 25 mL of isopropanol and 1 mL of phenolphthalein (0.1%). The solutions were titrated with standard solution of potassium hydroxide 0.1 mol.L-1, until the appearance of free pink color (% of oleic acid) [19, 20].
Peroxide index determination (PI)
For the determination of the peroxide index, 5 g of each aliquot of vegetable oil were dissolved in 30 mL of acetic acid/chloroform solution (3: 2 v/v) and 0.5 mL of saturated potassium iodide solution (60 %). The mixtures were remained for one minute and then 30 mL of distilled water and 0.5 mL of starch solution [1%] were added. The mixtures were titrated with a standard solution of sodium thiosulfate 0.1 mol.L-1, until the bluish color disappeared. A blank test was performed under the same conditions described, without the presence of the sample [19,20].
Iodine Index Determination (mEq.kg-1)
For the iodine index determinations, aliquots of 0.25 g of each vegetable oil sample and 10 mL of cyclohexane were mixed in a 500 mL Erlenmeyer flask with a lid. Then, 25 mL of Wijs’ solution was added to the mixture, under mechanical stirring. After the addition, the solution was left to stand in the dark and at room temperature for 30 minutes and then 10 mL of potassium iodide solution 15% and 100 mL of cold distilled water were added. Finally, the solution was titrated with a standard solution of 0.1 mol.L-1 sodium thiosulfate until a faint yellow color appeared. At that moment, 1 to 2 mL of 1% starch indicator solution was added and the titration was continued until the blue color completely disappeared. A blank determination was performed using the same method [21].
Chemometric Treatments
The original spectroscopic profiles were organized into a matrix format X (IxJ), where each replicate was considered one sample. Data analysis was carried out using Matlab v.2017 software (The MathWorks, Co., Natick, MA, USA) with the PLS_Toolbox computational package (Eigenvector Research, Inc. – PLS_Toolbox version 8.61.) [22]. Four pre-treatments were applied to the original data matrix to minimize signal/noisy ratio, baseline problems and different days of analysis: Savitzky- Golay smoothing with a window size of 11 points [23], first derivative, normalization and the data was mean centered. The Discriminant Analysis by Partial Least Squares (PLS-DA) was used for vegetable oils samples classification, while the Principal Component Analysis (PCA) was used in the kinetic degradation studies with soybean and olive oils sampes [24]. Variable selection was carried out by the ordered predictors selection method (OPS) [25] and visual inspection.
Results and Discussion
Vegetable Oils Classificatory Analysis by PLS-DA
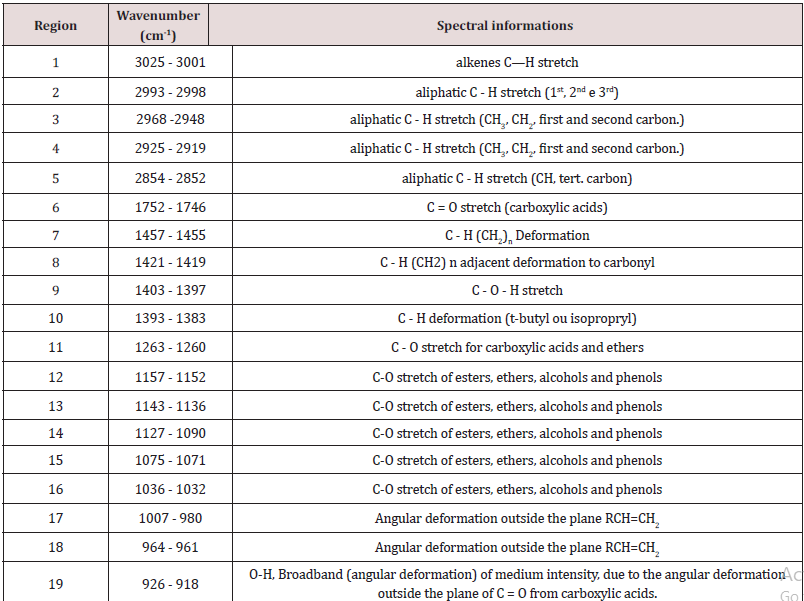
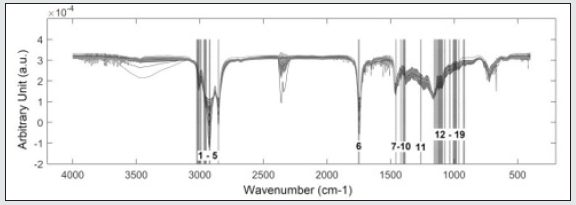
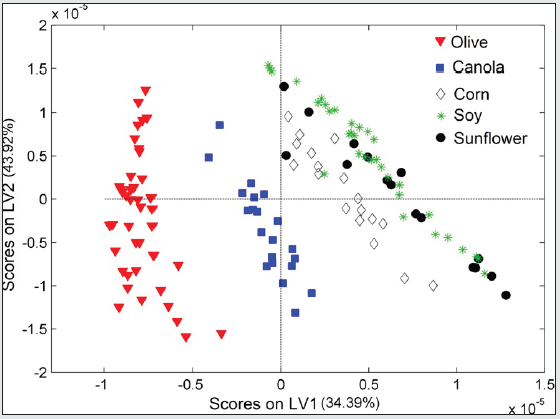
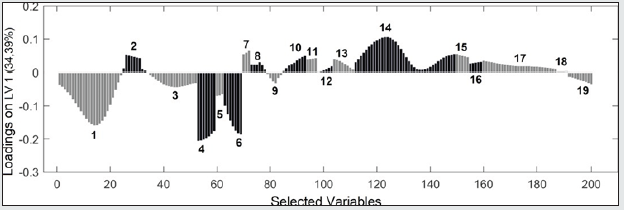
From the medium infrared spectra obtained by the five types of vegetable oils studied, it was possible to build a multivariate classification model known as PLS-DA. For this, the original data, X, was pre-treated and the important variables for discrimination of the oil classes were determined using the OPS algorithm [25] and visual inspection. Figure 1 shows the 200 selected variables (19 spectral regions) for the construction of the PLS-DA model, while Table 1 describes each spectral region in more detail. The PLS-DA model was built with 5 latent variables responsible for describing 98.17% of the data in block X, presenting a calibration error near 0% and an error between classes in the amount of 0.176%. According to the first latent variable (LV1) indicated in Figure 2, it is possible to observe the discrimination of 3 classes of vegetable oils (olive, canola and corn oils), in addition to the overlap of two other classes (soybean and sunflower oils). This overlapping of the soybean and sunflower classes occurs, once these oils have very close mono and polyunsaturated fatty acid compositions, causing the proposed model to present small flaws when classifying them The loading analysis in LV1 (Figure 3) demonstrated that the spectral regions 1 (3025 - 3001 cm-1 - CH stretch in sp2 carbons), 4 (2925-2919 cm-1 - CH stretch in sp3 carbons) and 6 (1752 - 1746 cm-1 - stretches C = O) are the main responsible for the separation of olive oil and canola samples (negative loadings). The disposition of the classes in LV1 (Figure 2) has a good association with the composition of mono and polyunsaturated fatty acids shown in the literature, with even overlapping in samples that have similar fatty acid profiles [16]. The olive oil samples were arranged on the negative side of LV1, as it is the vegetable oils (VO) that present the highest percentage of monounsaturated fatty acids, followed by canola, corn, sunflower and soy oil. Other spectral regions that present an interesting variability between the analyzed VOs are the regions from 10 to 17 (positive loadings in Figure 3). In oils with a higher degree of establishment these regions become more intense than in oils with a lower degree, such as olive oil and canola [26]. From the construction of the PLS-DA model, it was possible to calculate two important figures of merit to demonstrate the validity of the data obtained. Therefore, the results for sensitivity and specificity are shown in Table 2.
Vegetable Oils Thermical Stress
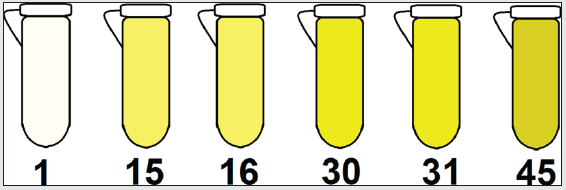
In the study on thermal stress, 2 types of vegetable oil (VO) were used (soybean and olive oils). These oils were chosen because they have different levels of mono and polyunsaturated fatty acids (FA) (results above - Figure 2). Thus, the samples were subjected to prolonged heating for 5h / day for 3 consecutive days at an average temperature of 200 ºC. The choice of this temperature was due to a study found in the literature, where it is explained that commercial oils have antioxidants in their composition, and these decrease their efficiency at temperatures above 180 ºC [1]. The thermal stress of VO can lead to the formation of polymeric compounds when in an advanced oxidized state, causing changes in the viscosity and color of vegetable oils [26]. These changes were more evident in samples containing soybean oil, because in samples with a higher percentage of polyunsaturated FA, there is a greater propensity to polymerization reactions (Diels-Alder reaction) as shown in Figure 4.
Figure 4: Schematic representation of color change in soybean oil samples at different heating times (1 to 45 h).
Exploratory Analysis of Soybean and Olive Oils Degradation by Thermal stress
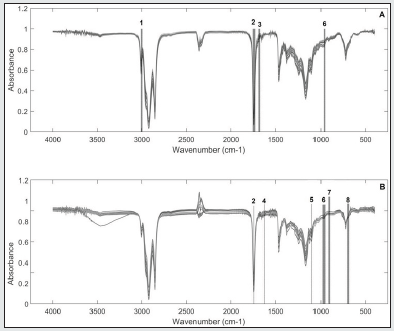
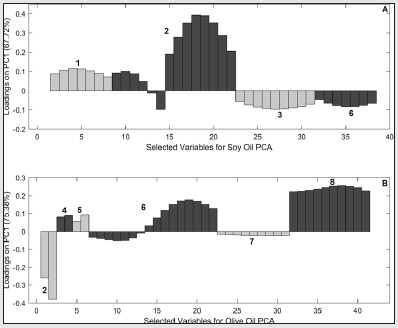
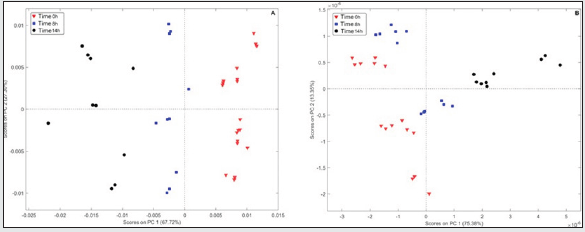
Initially, the original spectra of the two oil samples were overlaid and pre-treated (mean centered, smoothed by Savitzky-Golay with 11-points window, derived and normalized). Subsequently, a visual selection of the variables was performed in order to determine spectral regions that showed systematic differences between the samples in 3 frying times (0h, 8h and 14h), as can be seen in Figure 5 (Soybean - A and Olive B) and Table 3. Two Principal component analyses were performed with the spectral regions selected for the oils. In the case of soybean oil sample, according to the PC1 (67.72% of variance) shown in Figure 6A, it is possible to observe 3 different groups of samples. These groups, from right to left, represent samples subjected to thermal stress for different times: with 0h (▼), 8h (■) e 14h of frying (●). On the other hands, in the PCA for olive oil (Figure 6B) the samples were almost completely displaced in PC1, but a small variation in PC2 can also be noticed (Accumulated variance in PC1 and PC2 - 88.73%). The loadings analysis in PC1 (Figure 7A) indicates a decrease in the band intensity between 3008-2994 cm-1 related to the oxidation of double bonds and, consequently, formation of peroxides in the degraded soybean oils. The variables selected in the overlapping spectra (4 regions) for soybean oil samples with long frying time indicate that there was a variation in the existing FAs in the samples. When analyzing region n° 1, it can be noted that there was a decrease in the intensities of the bands in that region, indicating that there was probably a replacement of hydrogens in the α carbon of a double bond with a free radical, probably due to the autoxidation of FA. In region n° 2 (also selected for olive oil), it can be seen that there were changes in the intensities and forms of the carbonyl group (C = O), thus suggesting the formation of new compounds such as: aldehydes, ketones or carboxylic acids, probably originated from the oxidation of hydroperoxides. Analyzing region n° 3, it is possible to note the decrease in the bands in that region, probably indicating the degradation of trans-double bonds, which is a sign of the occurrence of oxidative processes [26]. It can also be noted that in region n° 6 (also selected for olive oil) there was an increase in the bands, indicating the probable replacement of hydrogens by free radicals formed due to thermal degradation.
Figure 6: Graphical Scores of soybean oils samples between first and second PCs (A) and olive oils (B).
Classical Methods
Fatty acids, peroxide and iodine contents
The amount of free fatty acids (FFA) reveals the oxidation state of the oils and is defined by the amount (mg) of potassium hydroxide necessary to neutralize the free fatty acids present in 1g of oil or fat [27]. This measure is important, since the production of FFA is almost always associated with partial hydrolysis of glycerides, which occurs at a higher speed due to exposure to light or heating [28, 29]. According to Table 4, it can be seen the values found for the olive oil (OO) and soybean oil (SO) samples The results obtained indicate that after 11 and 4 hours of heating, OO and SO, respectively, are outside the standards regulated by resolution N°. 482 of Anvisa (2005), which for the extra virgin OO is at most 1% and for the SO it is at most 0.3%. The consumption of these oils with a high total acidity index (free fatty acids) can lead to mild or even severe gastrointestinal problems depending on the amount consumed [17]. Thermal degradation causes changes in viscosity, odor and color and these changes are due to oxidative processes and at that point, it is important to analyze the peroxide index [29]. This parameter is one of the most used tests to assess the degree of oxidation of oils. According to ANVISA, the maximum permitted value of peroxides for olive oil and soybean oil is 20 mEq / kg and 10 mEq / kg, respectively [16]. Samples with a high peroxide content indicate a high degree of deterioration [29]. According to Table 4, it can be found the peroxide index values for the samples of OO and SO. It can be noted that the soy oil becomes unfit for consumption after 3 hours of frying while the olive oil does not exceed the limit until 3 pm when the experiment was carried out. these data demonstrate that monounsaturated oils (OO) are more suitable for consumption than polyunsaturated oils (SO). It is worth mentioning that the peroxide index indicates the formation of intermediate compounds such as peroxides and hydroperoxides (initial stage). Over time, these hydroperoxides break down into other, more stable compounds such as aldehydes, ketones and carboxylic acids [26]. In the two oils studied, the variation in its chemical and physical properties was noticeable, and from the analysis of the peroxide index, it was evident that there was an effective oxidation of the oils. It was also possible to notice, that over time, the concentration of peroxides begins to decline. a sign that oxidation is already in a new stage, it can be the stages of propagation or termination. Lastly, the iodine index is a qualitative parameter that can be used to predict the presence of insaturation in samples of vegetable oils. This index is very useful for determining the degree of installation of the samples and for being able to serve as a comparison with the peroxide index, once, they are tests that must present opposite results [28,29].
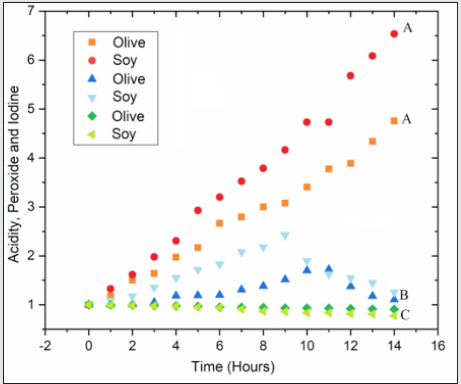
In that parameter, the higher the value found, the greater the degree of insaturation of the sample in question [30]. The results for the iodine index are also shown in Table 4. Through the results it is evident the occurrence of the break of insaturation present in samples of SO as well as in samples of OO. So that a deeper comparison between the results obtained with the oils studied was possible, the data in Table 4 were normalized and transformed into a graph (Figure 8). According to Figure 8, it can be seen that the relative acidity present in soybean oil. at the end of the process. it is greater than the acidity found in olive oil. This result may appear due to the secondary products of thermal degradation (aldehydes, ketones and carboxylic acids). since the OS for having a greater degree of establishment than the Az. will present a greater formation of these compounds. Another fact to highlight is the relationship between the iodine (II) and peroxide (IP) indices, as both are classic tests for assessing the oxidation status of oils, however, samples with high levels of iodine content should have low levels of peroxides and so on, successively. Fact confirmed by Figure 8. This opposite relationship occurs, because the PI indicates the degree of oxidation of the VO, since reactions occur in the insaturation of the FA molecules and the PI is a test that qualitatively predicts the presence of the insaturation [31].
Table 4: Free fatty acid, peroxide and iodine contents for olive oil and soy oil, subjected to heating for different periods.
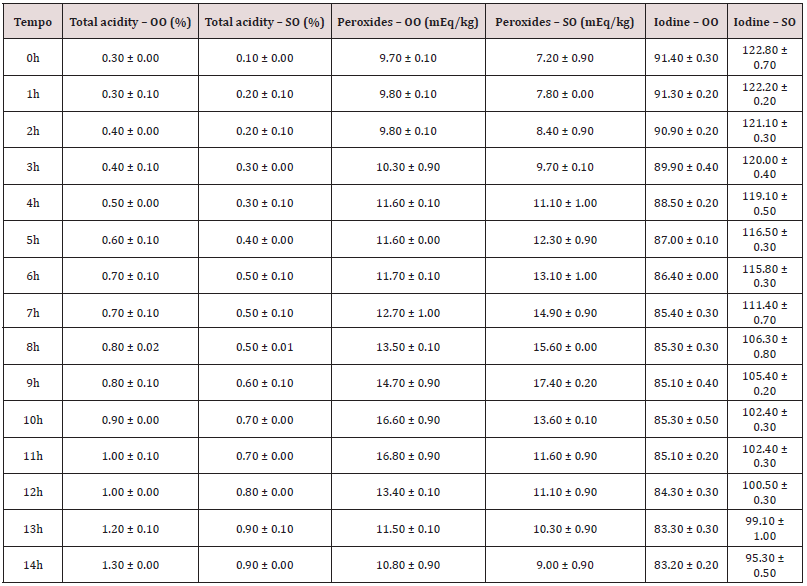
Figure 8: Table 4 data normalized and shown graphically. Total acidity (A). Peroxides (B) and iodine (C).
Conclusion
In this present work, it was possible to investigate the changes in vegetable oils, when these are subjected to thermal stress. This investigation took place through analytical quality verification tests regulated by ANVISA and also by spectroscopy in the infrared region and chemometrics. Thus, ehen performing the classificatory analysis of the vegetable oils most used commercially (olive oil, Canola, Sunflower, Corn and soybean oli), it was possible to find the main bands that can be used to separate these oils (19 spectral regions). By obtaining the main regions that differentiated commercial oils, it was possible to build a satisfactory classification model for forecastin new samples, since 3 types of oils (olive oil, canola and corn) are easily separated while the other 2 types are overlapping (soy and sunflower) due to the similarity in the mono and polyunsaturated fatty acid compositions. When subjected the samples of soybean and olive oils to thermal stress for 45 h at 200 ºC (on average), it was possible to detect the acidity index and iodine and peroxides values. In both cases, the samples had levels above those tolerated by the Brazilian legislation at the end of the process, making its consumption inappropriate after 4 hours of heating for soybean oil and 11 hours for olive oil. With the same samples subjected to thermal stress it was possible to make an exploratory kinetic study of the degradation through the spectra obtained in the mid-infrared confirming the results of the classic tests obtained and proving that during prolonged heating and at high temperatures, vegetable oils become more susceptible to thermal oxidation.
Acknowledgments
We thank the Research Support Foundation of Espírito Santo (FAPES) for the financial support.
References
- Faria AA, Leles MIG, Ionashiro M, Zuppa TO, Antoniosi Filho NR (2002) Study of the thermal stability of vegetable oils and fats by TG/DTG e DTA. Eclética Química 27: 111-119.
- Guidoni M, de Christo Scherer MM, Figueira MM, Schmitt EFP, de Almeida LC, et al. (2019) Fatty acid composition of vegetable oil blend and in vitro effects of pharmacotherapeutical skin care applications. Brazilian Journal of Medical and Biological Research 52(2): e8209.
- Kumara A, Sharmaa A, Upadhyaya K C (2016) Vegetable Oil: Nutritional and Industrial Perspective, Current Genomics 17(3): 230-240.
- Lehninger A, Nielson DL, COX MM (2002) Bioquímica 3.ed. Worth Publisher, New York, USA.
- Santos RD, Gagliardi ACM, Xavier HT, Magnoni CD, Cassani R, et al. (2013) I Diretriz sobre o consumo de gorduras e saúde cardiovascular. Arquivos Brasileiros de Cardiologia 100(1): 3.
- Ogori AF (2020) Source, Extraction and Constituents of Fats and Oils, Journal of Food Science & Nutrition.
- Dobarganes MC, Pérez Camino MC, Márquez Riz G (1989) Determinación de compuestos polares en aceites y grasas de fritura. Grasas y Aceites 1: 35-38.
- Ma R, Gao T, Song L, Zhang L, Jiang Y, et al. (2016) Effects of oil-water mixed frying and pure-oil frying on the quality characteristics of soybean oil and chicken chop, Food Science and Technology 6(2): 329-336.
- Choe E, Min DB (2006) Mechanisms and factors for edible oxidation. Comprehensive Reviews in Food Science and Food Safety 5(4): 169-186.
- Choe E, Min DB (2007) Chemistry of deep-fat frying oils. J food Sci 72(5): 77-86.
- Omer NMA, Al EMA, Mokhtar M (2014) Chemical Reactions Taken Place During deep-fat Frying and Their Products: A review. Journal of Natural and Medical Sciences (JNMS).
- Amaral DA, Ferreira VF, Salvador LIS., Ferreira CC (2013) Degradation of frying oils and fats from pastries in the south-central region of Belo Horizonte, MG, HU Revista v39.
- Machado T L S, Prieto T A, Luzia D M M, Costa Singh T, Jorge N (2014) Evaluation of the quality of frying oils used in a university restaurant, Revista Ciência em Extensão 10(3): 163-172.
- Freire PCM, Mancini Filho J, Ferreira TAPC (2013) Major physical and chemical changes in oils and fats used for deep frying: Regulation and effects on health, Revista de Nutrição 26(3): 353-368.
- Bordin K, Kunitake MT, Aracava KK, Trindade CSF (2013) Changes in food caused by deep fat frying – A review. Arch Latinoam Nutr 63(1): 5-13.
- ANVISA National Health Surveillance Agency (2005) pproves the technical regulation for vegetable oils, vegetable fats and vegetable cream (Resolution RDC No. 270, of September 22, 2005).
- Billek G (1985) Heated fats in the diet, in the role of fat. Padley FB, Podmore J (Eds). Chichester: Ellis Horwood pp. 163-172.
- Goswami G, Bora R, Rathore MS (2015) Oxidation of cooking oils due to repeated frying and human, International Journal of Science Technology and Management 4 (1).
- Oliveira TT, Nagem TJ, Silva MC, Miranda LCG, Teixeira MA (1999) Antioxidant action of modified flavonoids. Pesquisa Agropecuária Brasileira 34: 879-883.
- Moretto E, Fett R, Gonzaga LV (2002) Introdução à ciência de alimentos. Florianópolis: UFSC.
- AOCS (2004) Official methods and recommended practices of the American Oil Chemists’ Society. Champaign: American Oil Society.
- Wise BM, Gallagher NB, Bro R, Shaver JM, Windig W, Koch RS (2004) PLS_Toolbox for Use with MatlabTM, Versão 3,5. Software, Eigenvector Research, Inc.
- Savitzky A Golay MJE (1967) Smoothing and differentiation of data by simplified least squares procedures. Analytical Chemistry, 36: 1627-1639.
- Ferreira MMC (2015) Chemometrics, Concepts, Methods and Applications, Editora Unicamp, ISBN: 978-85-268-1063-1, 1Ed.
- Roque JV, Cardoso W, Peternelli LA, Teófilo RF (2019) Comprehensive new approaches for variable selection using ordered predictor selection. Analytica Chimica Acta 1075: 57-70.
- Silva FAM, Borges MFM, Ferreira MA (1999) Methods for the evaluation of the degree of lipid oxidation and the antioxidant activity. Química Nova 22: 94-103.
- IAL Adolfo Lutz Institute (São Paulo) (2008) Physicochemical methods for food analysis / coordinators: Odair Zenebon, Neus Sadocco Pascuet e Paulo Tiglea - São Paulo: Instituto Adolfo Lutz pp. 1020.
- Moretto E, Fett R (1998) Tecnologia de óleos e gorduras vegetais. São Paulo: Varela.
- Reda SY (2004) Estudo comparativo de óleos vegetais submetidos an estresse térmico (Dissertação de mestrado) Universidade Estadual de Ponta Grossa, Ponta Grossa.
- Maia EL (2006) Theoretical teaching material of fish I. Fedral University if Ceara. Fortaleza.
- Silverstein RM, Bassler GC, Morrill TC (1996) Spectrometric identification of organic compounds, John Wiley e Sons, Tabela Brasileira de Composição de Alimentos, New York, USA. (2011). 4ª ed.

Top Editors
-

Mark E Smith
Bio chemistry
University of Texas Medical Branch, USA -

Lawrence A Presley
Department of Criminal Justice
Liberty University, USA -

Thomas W Miller
Department of Psychiatry
University of Kentucky, USA -

Gjumrakch Aliev
Department of Medicine
Gally International Biomedical Research & Consulting LLC, USA -

Christopher Bryant
Department of Urbanisation and Agricultural
Montreal university, USA -

Robert William Frare
Oral & Maxillofacial Pathology
New York University, USA -

Rudolph Modesto Navari
Gastroenterology and Hepatology
University of Alabama, UK -

Andrew Hague
Department of Medicine
Universities of Bradford, UK -

George Gregory Buttigieg
Maltese College of Obstetrics and Gynaecology, Europe -

Chen-Hsiung Yeh
Oncology
Circulogene Theranostics, England -
.png)
Emilio Bucio-Carrillo
Radiation Chemistry
National University of Mexico, USA -
.jpg)
Casey J Grenier
Analytical Chemistry
Wentworth Institute of Technology, USA -
Hany Atalah
Minimally Invasive Surgery
Mercer University school of Medicine, USA -

Abu-Hussein Muhamad
Pediatric Dentistry
University of Athens , Greece

The annual scholar awards from Lupine Publishers honor a selected number Read More...


