Lupine Publishers Group
Lupine Publishers
Menu
ISSN: 2637-6652
Short Communication (ISSN: 2637-6652) 
Unusual Weather & Climatic System In Indonesia Maritime Continent Area In the Beginning 2018 Volume 2 - Issue 2
Paulus Agus Winarso* and Jusa Sujana
- Indonesia State College Meteorology Climatology and Geophysic, Indonesia
Received: August 31, 2018; Published: September 07, 2018
Corresponding author: Paulus Agus Winarso, Indonesia State College Meteorology Climatology and Geophysic, Indonesia
DOI: 10.32474/MAOPS.2018.02.000131
Short Communication
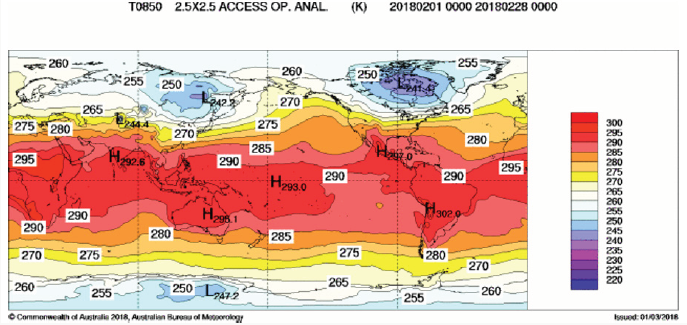
The winter season 2017/2018 could be one of the unusual conditions with increasing the winter storm activities over Northern Hemisphere to affect aerodrome closed for certain airports in big cities of the United States of America and Canada in Northern America Continent, it could be over European Countries and North Asian Continent. The freezing water Niagara for the first time during last 50 years could be the additional condition from coolest than normal and it might longer than usual based upon public information and collecting the global climatic chart from National Climate Centers under coordination from the World Meteorological Organization. If the condition winter season 2017/2018 compared with the previous condition especially in the 17 years or it could be longest than usual period, the winter season 2017/2018 could be worst condition and situation especially with winter storm occurrences over most northern hemisphere middle of March. Reversal condition over the southern hemisphere with summer season with few day occurrences of the heat wave over Australia continent last January 2018. In the next Figure 1, it would describe the global air temperature (in Kelvin or in Centigrade it should be subtracted 273) at the low level (about 1500 meters from Mean Sea Level) as follows [1].
Figure 1: Global air temperature at March 2018 showed below 0 degrees Centigrade over the wider area of Northern Hemisphere (white – blue color) than Southern Hemisphere (Source: website Australian Burea of Meteorology [1].

Until the end of March 2018 from Figure 1 would present below 273 degrees Kelvin or 0 degrees Centigrade, otherwise until March 2018 most of middle latitude up to the Arctic areas over Northern Hemisphere has wider than over middle latitude - Antartic areas of Southern Hemisphere. Based on the operational experience as the meteorologist, the winter season over this area takes place between December - February yearly.
To assess the weather and climatic over the earth’s surface that weather and climate development came from uneven solar radiation (solar activities) received by the earth’s surface, it meant that solar radiation could consider as the main subject to asses/ study the global circulation over the lower atmosphere of the earth. Where we could consider solar radiation to have closed relation with solar activities in term of the sunspot and solar flare to investigate how much solar radiation/energy emits from the center of the solar system. In this case, the sunspot number counted every month could be used as the quantity and quality sun radiation/ energy with the high number of sunspot to represented large the solar radiation received by the earth surface to the universe of the earth-sun system. It could also be with the small number of the sunspot with respect with the time especially daily, weekly, monthly, seasonally up to yearly basis to represent less of the sun radiation received by the earth surface. From further assessment and study of the sunspot number has a relation with the weather and climate condition over the earth surface especially the formation of the global air circulation both north-south between equator - north and south poles and east-west direction over the equator [2].
High or maximum number of the sunspot on the monthly basis for 6-12 months duration could encourage global phenomena of the El Nino (warming sea surface temperature over equator east Pacific Ocean) and small or minimum number of the sunspot could encourage reversal El Nino in term of the La Nina. Both of the global phenomena would affect certain weather and climatic condition globally arising unusual weather and climatic pattern over the earth’s surface. Based on the sunspot number on the monthly basis could be arranged in term of the sunspot cycle to represent from minimum number toward the maximum as the peak sunspot number then to be going down toward minimum number [3]. Now, there 24 sunspot cycles with one cycle having the duration of about 11 years. It means every sunspot cycle has the period between 10-12 years. At this period 2017/2018, sunspot cycle number 24 would be toward the small number of the minimum of the sunspot or minimum sun’s radiation received by the earth surface. Such that La Nina episode would active starting middle of the year 2016 up to beginning 2018.
Where La Nina episode has the large contribution in the developing equatorial wave of the so-called Madden Julian Oscillation (MJO) which create intraseasonal weather and climatic condition over the tropical area especially over Indian Ocean Indonesia Maritime Continent and West Pacific Ocean. During MJO passing over the consecutive areas the Indian Ocean - West Pacific Ocean, the array of the large tower of cumulonimbus cloud would be active to support the tropical cyclone formation and another local storm. Beside the global perspective, there would be regional perspective phenomena coincide with Asian winter monsoon activities in terms of the cold surge to form the Borneo Vortex mostly over west Indonesia Maritime Continent. With having the long period and cooler condition during winter season 2017/2018, the Borneo Vortex frequently forms during lack MJO activities or when MJO move eastward toward East Pacific and the Atlantic Ocean.
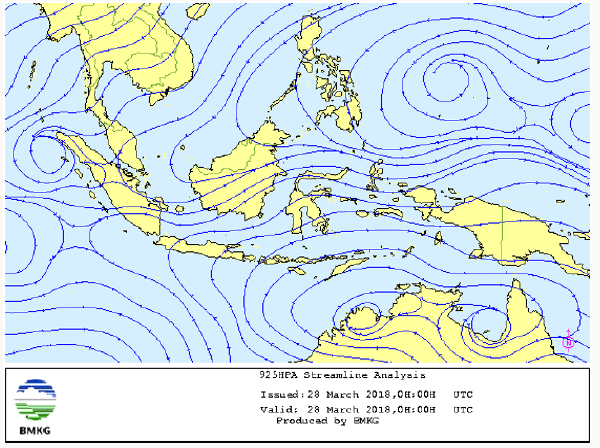
Figure 2: Wind flow (streamline)at the low level at 925 millibars, it would describe the westerly wind to prevail over most Indonesia area with the arrow indicates direction wind flow.(Source website Indonesian Meteorology Climatology and Geophysics Agency [2].

By the frequent MJO episode of occurrence over Indonesia Maritime Continent as part the global perspective from the dynamical meteorology and oceanography, there were two tropical cyclones formation closer with the Java island namely tropical cyclones “Cempaka” and “Dahlia” during the period November 27th, 2017 - December 2nd, 2017. From the operational point of view, the formation tropical cyclone Cempaka on November 2017 was closer to the coastline of southern Java island causing the flash flood, no storm surge over the coastline, land slide, flooding over some areas in central and eastern Java island. Then tropical cyclon Dahlia might cause low storm surge over Sunda Strait and some coastal area over southern west Java island and strong wind along the northern coast of the west and central Java island. The formation of the unusual Tropical cyclone would be in advance and be generating over low latitudes approaching equator line. The end of the year 2017 up to end January 2018, Indonesia Maritime Continent would suppress the cloud cover and rainfall due to the cooler than normal of the sea surface temperature Indian ocean west of Indonesia Maritime Continent. Unfortunately, during February, activities of the cloud cover and rainfall would be increasing even MJO over Pacific-Atlantic Oceans. The Cold surge would not encourage the formation the Borneo Vortex, but the convergence zone of northerly and southerly would be part of the Inter-Tropical Convergence frequently occurs with more active cloud cover and rainfall. The flooding areas and landside arose including Jakarta and adjoining area frequently occurs with additional condition coolest of the environment most over Java up to lesser of Sunda island until the end of March 2018. From the regional surface wind over lower level would describe in the next Figure 2 as follows.
References

Top Editors
-

Mark E Smith
Bio chemistry
University of Texas Medical Branch, USA -

Lawrence A Presley
Department of Criminal Justice
Liberty University, USA -

Thomas W Miller
Department of Psychiatry
University of Kentucky, USA -

Gjumrakch Aliev
Department of Medicine
Gally International Biomedical Research & Consulting LLC, USA -

Christopher Bryant
Department of Urbanisation and Agricultural
Montreal university, USA -

Robert William Frare
Oral & Maxillofacial Pathology
New York University, USA -

Rudolph Modesto Navari
Gastroenterology and Hepatology
University of Alabama, UK -

Andrew Hague
Department of Medicine
Universities of Bradford, UK -

George Gregory Buttigieg
Maltese College of Obstetrics and Gynaecology, Europe -

Chen-Hsiung Yeh
Oncology
Circulogene Theranostics, England -
.png)
Emilio Bucio-Carrillo
Radiation Chemistry
National University of Mexico, USA -
.jpg)
Casey J Grenier
Analytical Chemistry
Wentworth Institute of Technology, USA -
Hany Atalah
Minimally Invasive Surgery
Mercer University school of Medicine, USA -

Abu-Hussein Muhamad
Pediatric Dentistry
University of Athens , Greece

The annual scholar awards from Lupine Publishers honor a selected number Read More...


