Lupine Publishers Group
Lupine Publishers
Menu
ISSN: 2637-6652
Research Article (ISSN: 2637-6652) 
Simulation of Tsunami Impact on Water Mass Variations Based on Pareto Optimization Volume 2 - Issue 2
Maged Marghany1,2*
- 1 School of Humanities, Geography Section, University Sains Malaysia, Malaysia
- 2 Faculty Geospatial and Real Estate, Geomatica University College, Malaysia
Received: September 07, 2018; Published: September 19, 2018
Corresponding author: Maged Marghany, Faculty Geospatial and Real Estate, Geomatica University College, Kuala Lumpur, Malaysia
DOI: 10.32474/MAOPS.2018.02.000133
Abstract
There is no query that the tsunami performs remarkable roles to alternate the physical properties of the ocean through mixing turbulent approaches. This study has proposed and demonstrated a new approach to retrieve the water mass pattern from remote sensing data. This examination has proposed and shown another way to deal with recovering water mass example from remote detecting information. The MODIS satellite information is procured pre, during and boxing day 2004. In this way, GA delivered another equation to recover the water mass by upgrading mistakes because of overcast spreads, and SST and SSS straight calculation executions. The investigation demonstrates that GA can diminish the blunder of recovering ocean surface thickness with ±2.87kg/ m3. Further, during and post-tsunami 2004, the coastal waters are commanded by most extreme density estimation of 25.8kg/m3 which initially organized along Aceh coastal waters. It can be alleged that GA can be utilized to recover water mass qualities utilizing MODIS satellite information.
Introduction
a) There is no query that the tsunami performs remarkable roles to alternate the physical properties of the ocean through mixing turbulent approaches. In retaining with [1], the tsunami accelerated the water salinity in Aceh coastal waters to approach the maximum value of 38 ppt. Ocean salinity is the keystone of measuring water mass physical properties by compiling the temperature of the water body. Water masses are the cornerstone to comprehend the elements of the seawater [2-4]. Fundamentally, profound sea dissemination is fiery by minor adjustments in seawater thickness which is activated by contrasts in temperature and saltiness, indicated as thermohaline flow. Thermohaline envelops the arrangement and dynamic exchange of particular water masses [5]. These are the enormous homogeneous volume of water which thoroughfares a particular assortment of temperature and saltiness. Most extreme profound waters masses create at high scopes at the sea surface wherever they achieve their particular drained temperature and saltiness [6]. In any case, the temperature is not customarily used to track, a water mass since temperature steadily tumbles to the base and therefore uncovers no extrema (greatest or least) rates like oxygen or even saltiness. Actually, thickness contrasts between water masses is an emerging power that actuates, water developments, generally vertical developments [3,5]. The stream of the significant profound water gravity caused flow pulling the denser water masses downwards, dislodging lighter masses upward. When all is said in done, an oceanographic water mass is an identifiable waterway with a typical development history, which has unmistakable physical properties of encompassing waters. These incorporate temperatures, saltiness, compound - isotopic proportions, and other physical amounts [6]. More than a decade, both of Terra and Aqua satellites of the MODIS (Moderate Resolution Imaging is part of NASA’s Earth Watching Framework. They have ever been giving gorgeous worldwide ocean surface temperatures (SST) for over 10 years.
c) The importance of satellite SST estimations which it seems that exhibited by using the progression of IR radiometers that have been working considering the dispatch of the fundamental Progressed High Determination Radiometer (AVHRR) in 1978. The AVHRR was trailed via a rocket radiometer especially intended for specific SST estimation, the Along-Track Checking Radiometer, ATSR. Techniques used to infer SST in the infrared (IR). Indeed, Infrared (IR) satellite SST recuperation relies upon on estimations taken where the surroundings are reasonably straightforward, in supposing “air windows” in the mid-wave infrared (MWIR, λ = 3.5-4.1μm) and long-wave, thermal infrared (LWIR, λ = 10-12μm) unearthly interims [7]. Ocean surface saltiness (SSS) recovery from satellite information is a noteworthy test. To be sure, damaged down salts, suspended resources have noteworthy consequences of the electromagnetic radiation weakening outdoor the unmistakable spectra run [8]. In this specific situation, the electromagnetic wavelength better than 700 nm is regularly consumed even though the wavelength beneath 300 nm is scattered through nonengrossing particles, for example, zooplankton, suspended residue and broke up salts [9]. Along these lines, [10] have decided SSS utilising shaded broke down the natural issue, (aCDOM) from optical satellite information [10,11] have created robust and appropriate territorial calculations from the big in-situ estimations of clear and natural optical data (i.e. remote detecting reflectance, Rrs, and retention coefficient of shaded broke down the natural issue, aCDOM) to decide saltiness using Sea WiFS data. Currently, there is three obstacles to optical remote sensing technique:
a. Strength constraints of the spacecraft permit exceptional approximately two hours of scanning steady with the day
b. Cloud covers prevent precise observations, and
c. Moderate from near the sea surface is sensed through the scanner. In this context, retrieving water thousands, mainly primarily based on SST and SSS is not continual, nevertheless, possible, while is SST and SSS are appropriate for direct remark with optical gadgets. This work hypothesizes that water mass can also be retrieved by the use of the optimization, genetic algorithm from MODIS satellite for digital information. In this regard, the Genetic algorithm [12] is taken into consideration to optimize the water mass which is notably based on SST and SSS for efficaciously synoptic measurements of water mass spatial version in Aceh coastal waters during the 2004 tsunami using MODIS satellite data.
Study Area
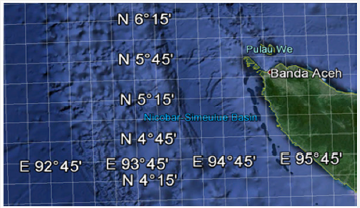
The study vicinity is located alongside the western coastal region of Aceh with boundaries of latitudes two 3° 30´ N to 6° 30´ N two and longitudes of 93° 30´ E to 99° 30´E (Figure 1). The Sunda trench is strolling north-south alongside the coastal waters of Aceh closer to the Andaman Sea. Running in a difficult north-south line on the seabed of the Andaman Sea is the boundary between two tectonic plates, the Burma plate and the Sunda Plate. These plates (or microplates) are believed to have formerly been a phase of the larger Eurasian Plate, however, had been formed when radically changes fault activity intensified as the Indian Plate started out its great collision with the Eurasian continent [13,14]. As a result, a back-arc basin core was once created, which started out to shape the marginal basin, which would emerge as the Andaman Sea, the present-day levels of which commenced approximately 3-4 million years ago. On December 26, 2004, a massive component of the boundary between the Burma Plate and the Indo-Australian Plate slipped, inflicting the 2004 Indian Ocean earthquake. This megathrust earthquake had a magnitude of 9.3. Between 1300 and 1600 kilometres of the boundary underwent thrust faulting and shifted through about 20 meters, with the sea flooring being uplifted various meters. This raised in the sea ground generated a massive tsunami with an estimated height of 28 meters (30 ft) [15].
Genetic Algorithm
GAs optimization applications have many advantages. As regards, GA advantages originate in algorithms itself, which imitate the mechanisms of the natural evolution, where an organic population evolves over generations to adapt to an environment with the aid of selection, crossover and mutation [1]. In plan optimization problems, fitness, character and gens correspond to an objective function, plan candidate and diagram variables, respectively. In this regard, the range of the populace is maintained by a popular fitness sharing function. The satisfying N determination is used to determine the severity Pareto solution. In doing so, the blended crossover is used to generate children on fragment identified via parents and specific parameter. In this optimization, new plan variables of water masses have a weight common as
Where ϖ = (1+ 2l) _ ran1 − l , ch1 and ch2 are child 1,2, P1 and P2 are parent 1,2 which represent programmed scheme variables of the members of the new population and a reproduced pair of the old generation. Therefore, 2 ran is a random number which is uniform in [0,1]. When the mutation takes place, Eqs. 1 and 2 can be given as follows:
where 2 ran is a random number which is uniform in [0,1], and α is set to 5% of the given range of each variable. Subsequently, the water mass is a feature of sea temperature (ST) and sea salinity (SS), its diagram parameters have to be addressed predictably. Else, the computation deviates and infinite population cannot be weighed. Consequently, is set to 0.0, then mutation takes place at a likelihood of 10% [12]. In line with [16], genetic algorithm is commonly a characteristic of the reproducing step which entails the crossover and mutation techniques in MODIS data. In crossover step the chromosomes interchange genes. A local fitness value results every gene as
The cross-over and mutation are described in short in following sections which are difficulty to subsequent step of Genetic Algorithm [17]. In this understanding, the crossover operator constructs to converge around options with excessive fitness. Thus, the closer the crossover probability is to 1 and the quicker is the convergence [16]. Then the crossfire between two individuals consists to keep all individual populations of the first parent which have a local fitness greater than the average local fitness f( Pj av ) and substitutes the remained genes by the corresponding ones from the second parent. Hence, the average local fitness is defined by:
Hence, the mutation operator denotes the phenomena of awesome likelihood in the evolution process. Truly, some useful genetic records involving the chosen population may require to be misplaced for the duration of the reproducing step. As a result, the mutation operator introduces new genetic facts to the gene ordinary. Generally, the genetic algorithm will take two match individuals and mate them (a process referred to as crossover). The offspring of the mated pair will acquire some of the traits of the mother, and some of the parents. The methods of selection, crossover, and mutation are called genetic operators.
Results and Discussion
The tsunami impact on sea surface salinity has been examined on three MODIS satellite data along Aceh coastal waters. These data are acquired on 23rd ,26th and 27th, 2004 which represent pre, and post-tsunami event, respectively (Figure 2). According to [18], Moderate Resolution Imaging Spectroradiometer (MODIS) has 1 km spatial resolution and having 36 bands which have ranged from 0.405 to 14.285μm [18]. The MODIS satellite takes 1 to 2 days to capture all the scenes in the entire world, acquiring data in 36 spectral bands over a 2330 km swath [11].
Figure 2: MODIS satellite data (a) pre-tsunami event, (b) during the tsunami event and (c) post-tsunami event.
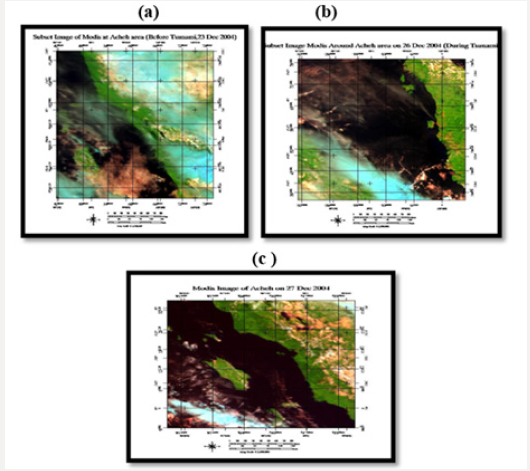
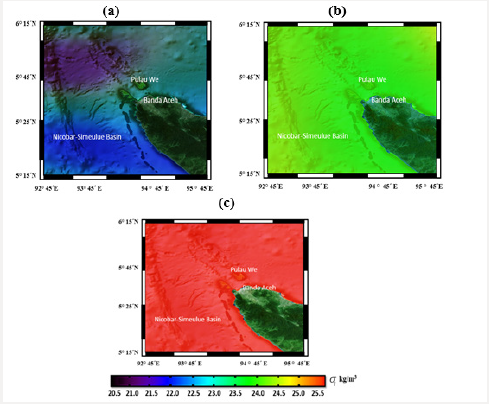
Figure 3 shows the synoptic information retrieved which is not appropriately simulated (Figure 3). This is because of the fact that the existence of heavy cloud covers pre and post-boxing day of 2004 on MODIS data. Most of the data about either onshore or offshore are definitely fuzzy due to the fact of the heavy cloud covers throughout December 2004. In fact, December represents the monsoon which is dominated by heavy cloud covers. This result agrees with [19]. Figure 4 indicates the methods of GA to retrieve water mass from MODIS data. It is well-defined that GA reform the statistics of land and sea surface fluctuation which are primarily based on population generation step with distinctive fitness values. Figure 4a suggests the initial generation of with every 10 individuals. These persons are encoded in binary values [0,1] as shown in brightness and darkest pixels, respectively. It is interesting to discover that with an increment of new release value of 4000, the fitness value is decreased with root suggest rectangular error (RMSE) of ninety. This proves the work of [12].
Within 6000 iterations, and RMSE value of ±2.87 kg/m3 is retrieved from the GA algorithm. It is interesting to find that the post-tsunami coastal waters have highest of 25.8 kg/m3 than the pre-tsunami period (Figure 4). The coastal waters have dominated by homogenous pattern during and post-tsunami 2004. It is far thrilling to locate that GA is capable of retrieving the entire situation of fluctuation pre, during and post-tsunami 2004 in comparison to direct estimation from MODIS facts (Figure 2). It way that GA capable of generating a new population of despite the fact that the presence of heavy cloud covers.
This finds out about confirming the abilities of GA as simulating device as stated with the aid of [12,6,20-22]. This because of the truth that Genetic algorithm predominantly means of the reproducing which involves the crossover and mutation tactics on the new populace in sequences of MODIS data. In this aspect, the crossover operator creates the population to acquire optimization options based on excessive fitness. This confirms the work of [16]. In other words, the genetic algorithm (GA) is successful in producing complicated patterns and performing awkward computations. In addition, fitness characteristic is chosen to determine the similarity of every individual gradient adjustment in MODIS facts even though of heavy cloud covers. This suggests that genetic algorithm is a notable simulator of ocean water loads in optical facts such as MODIS satellite data. Lastly, the tsunami the hanged the coastal water physical characteristics such as water mass due to its effects on water temperature and salinity. The incremental of water density could be due to salinity increment as a function of the high accumulation of suspended sediment. This agrees with [23,24].
Figure 4: σt retrieved from the genetic algorithm (GA)(a) pre-tsunami, (b)during tsunami and (c) post-tsunami.
Conclusion
This examination has proposed and shown another way to deal with a recovered water mass example from remote detecting information. The MODIS satellite information is procured pre, during and boxing day 2004 [25,26]. In this way, GA delivered another equation to recover the water mass by upgrading mistakes because of overcast spreads, and SST and SSS straight calculation executions. Therefore, GA produced a new formula to retrieve the water mass pattern by optimizing errors due to cloud covers, and SST and SSS linear algorithm implementations. The study shows that the genetic algorithm can reduce the error of retrieving sea surface density with±3.4 kg/m3. Further, coastal water Aceh is dominated by the maximum offshore value of 22.5 kg/m3. In conclusion, Genetic Algorithm can be used to retrieve water mass characteristics using MODIS satellite data during the 2004 tsunami boxing day.
References
- Marghany M (2014) Multi-Objective Evolutionary Algorithm for Oil Spill Detection from COSMO-Skey Med Satellite. ICCSA pp. 355-371.
- Bowden KF (1983) Physical oceanography of coastal waters. Ellis Horwood Limited.
- Alejandro C, Saadon MN (1996) Dynamic behaviour of the upper layers of the South China Sea. Proceedings of the National Conference on Climate Change pp. 135-140.
- Alejandro C, Demmler MI (1997) Wind-driven circulation of Peninsular Malaysia’s eastern continental shelf. Sci Mar 61(2): 203-211.
- Downes MS, Anand G, Stephen MG, Jorge LS (2011) Water mass exchange in the Southern Ocean in coupled climate models. Journal of Physical Oceanography 41: 1756-1771.
- Marghany M (2012) Intermonsoon water mass characteristics along coastal waters off Kuala Terengganu, Malaysia. International Journal of Physical Science 7(8): 1294-1299.
- Kilpatrick KA, Podestá G, Walsh S, Williams E, Halliwell V, et al. (2015) A decade of sea surface temperature from MODIS. Remote Sensing of Environment 165: 27-41.
- Wong MS, HL Kwan, JK Young, Nichol JL, Zhangging, et al. (2007) Modelling of Suspended Solids and Sea Surface Salinity in Hong Kong using Aqua/ MODIS Satellite Images. Korean Journal of Remote Sensing 23 (3): 161-169.
- Ellison W, A Balana, G Delbos, K Lamkaouchi, L Eymard, et al. (1998) New permittivity measurements of seawater. Radio Science 33(3): 639- 648.
- YH Ahn, P Shanmugam, JE Moon, JH Ryu (2008) Satellite remote sensing of a low-salinity water plume in the East China Sea. Ann Geophys 26: 2019-2035.
- Marghany M (2009) Linear algorithm for salinity distribution modelling from MODIS data. IEEE International Geoscience and Remote Sensing Symposium pp. 365-368.
- Marghany M, Mansor S (2016) Genetic Algorithm for South China Sea Water Mass Variations Using MODIS Satellite Data p. 1-6.
- Kelmelis JA, Schwartz L, Christian C, Crawford M, King D (2006) Use of Geographic Information in Response to the Sumatra-Andaman Earthquake and Indian Ocean Tsunami of December 26, 2004. Photogrammetric Engineering & Remote Sensing 72 (8): 862-876.
- Shulgin A, Kopp H, Klaeschen D, Papenberg C, Tilmann F, et al. (2013) Subduction system variability across the segment boundary of the 2004/2005 Sumatra megathrust earthquakes. Earth and Planetary Science Letters 365: 108-119.
- Titov VV, Gonzalez FI, Bernard EN, Marie C Eble, Harold O Mofjeld, et al. (2005) Real-time tsunami forecasting: Challenges and solutions. Natural Hazards 35(1): 35-41.
- Sivanandam SN, Deepa SN (2008) Introduction to Genetic Algorithms, by Springer Berlin Heidelberg New York, USA.
- Marghany M (2014) Utilization of a genetic algorithm for the automatic detection of oil spill from RADARSAT-2 SAR satellite data. Marine pollution bulletin 89(1-2): 20-29.
- Marghany M (2010) Examining the Least Square Method to Retrieve Sea Surface Salinity from MODIS Satellite Data. European Journal of Science of Research 40: 377-386.
- Liu CC, Liu JG, Lin CW, Wu AM, Liu SH, et al. (2007) Image processing of FORMOSAT‐2 data for monitoring the South Asia tsunami. International Journal of Remote Sensing 28(13-14): 3093-3111.
- Kahlouche S, K Achour, M Benkhelif (2002) Proceedings of 2002, WSEAS International Conferences.
- Marghany M (2015) Automatic detection of oil spills in the Gulf of Mexico from RADARSAT-2 SAR satellite data. Environmental Earth Sciences 74(7): 5935-5947.
- Marghany M (2015) Genetic algorithm for three-dimensional ice floes from Tandem-X image. CD of 36th Asian Conference on Remote Sensing.
- Marghany M (2014) Simulation of Tsunami Impact on Sea Surface Salinity along Banda Aceh Coastal Waters, Indonesia. Advanced Geoscience Remote Sensing pp. 229-251.
- Marghany M (2018) Advanced Remote Sensing Technology for Tsunami Modelling and Forecasting. pp. 316.
- Marghany M, Mansor S (2015) Genetic algorithm for oil spill automatic detection using synthetic aperture radar. Global NEST Journal 17(4): 858-869.
- Marghany M (2017) Automatic Detection of Oil Spill Disasters along Gulf of Mexico Using RADARSAT-2 SAR Data. Journal of the Indian Society of Remote Sensing 45(3): 503-511.

Top Editors
-

Mark E Smith
Bio chemistry
University of Texas Medical Branch, USA -

Lawrence A Presley
Department of Criminal Justice
Liberty University, USA -

Thomas W Miller
Department of Psychiatry
University of Kentucky, USA -

Gjumrakch Aliev
Department of Medicine
Gally International Biomedical Research & Consulting LLC, USA -

Christopher Bryant
Department of Urbanisation and Agricultural
Montreal university, USA -

Robert William Frare
Oral & Maxillofacial Pathology
New York University, USA -

Rudolph Modesto Navari
Gastroenterology and Hepatology
University of Alabama, UK -

Andrew Hague
Department of Medicine
Universities of Bradford, UK -

George Gregory Buttigieg
Maltese College of Obstetrics and Gynaecology, Europe -

Chen-Hsiung Yeh
Oncology
Circulogene Theranostics, England -
.png)
Emilio Bucio-Carrillo
Radiation Chemistry
National University of Mexico, USA -
.jpg)
Casey J Grenier
Analytical Chemistry
Wentworth Institute of Technology, USA -
Hany Atalah
Minimally Invasive Surgery
Mercer University school of Medicine, USA -

Abu-Hussein Muhamad
Pediatric Dentistry
University of Athens , Greece

The annual scholar awards from Lupine Publishers honor a selected number Read More...


