Lupine Publishers Group
Lupine Publishers
Menu
ISSN: 2637-6652
Review Article(ISSN: 2637-6652) 
Laboratory Investigation of the Low Salinity Water Flooding into Sandstone Reservoirs Volume 1 - Issue 4
Hasan N Al Saedi1*, Ralph E Flori2 and Patrick V Brady3
- 1Missouri University of Science and Technology/Missan Oil Company, USA
- 2Missouri University of Science and Technology, USA
- 3Sandia National Lab, USA
Received: May 01, 2018; Published: May 07, 2018
Corresponding author: Hasan N Al Saedi, Missouri University of Science and Technology/Missan Oil Company, USA
DOI: 10.32474/MAOPS.2018.01.000117
Abstract
In this study, we propose to quantify the control of mineral composition and water chemistry on water/rock interactions by using oil during low salinity water flooding of spatially heterogeneous sandstone porous media. A sandstone core and free clay sand core were prepared in chromatography columns and were water flooded sequentially with high low salinity water at the reservoir temperature of 90°C. Brine with high salinity (100,000) ppm was injected to simulate formation water. Then, Inflow LS water (1100) ppm. One of the columns only contains quartz; to investigate the role of the clay in the mechanism of LS water enhanced oil recovery (EOR). The other column contained quartz and identical quantities of clays. The results showed that during flooding, the free clay column with LS water the oil recovery from the quartz column was as great as that of the clay containing cores. The pH also increased significantly during LS water flooding for the free clay column.
Introduction
The results of previous published laboratory work showed that as the salinity of the injected water decreases the oil recovery increases. The experimental observation for Tang and Morrow [1] suggested a couple of chemical mechanisms for LS water flooding:
a) Clay should exist in the sandstone, and
b) Crude oil must contain polar components. Similarly, Lager et al. [2] stipulated a third condition to the previous two, which was
c) Divalent cations such as Ca2+ and Mg2+ must be one of the components of the formation water (FW).
Sohrabi et al. [3] exclude the influence of the clay in LS water flooding; they observed an additional amount of oil recovery during flooding of the free clay core. The reason behind increasing oil recovery was the formation of micelles stemming from the brine/ crude oil interaction. The dynamic contact angle measurement conducted by Facanha [4] on a quartz slab with HS and LS water showed an important alteration in wettability when LS water was substituted for HS water. Likewise, our experimental observations Al Saedi and Bradi [5] on sand and sand clay columns showed that the carboxylic released from the sand column was as great as from the sand clay columns. Different mechanisms of LS water flooding have been suggested, but it is still a topic of debate. Tang and Morrow [1] attributed the effect of LS water to the fines migration. Austad et al. [6] ascribed it to the desorption of organic materials from the clay surface, and we added desorption of organic materials from the quartz surface Al Saedi and Brady [7]. Lager et al. [8] attributed it to multi component ion exchange, and we observed a cation exchange on the quartz surface Al Saedi ,Brady [7]. The other mechanisms were reduction in interfacial tension McGuire et al. [9], double layer expansion Ligthelm et al. [10], and mineral dissolution Aksulu et al. [11]. In this paper, we examine the effect of a free clay sand column and different clay/sand columns on oil recovery at reservoir temperature (90°C). The columns were (a) 100% sand, (b) 95% sand + 5% kaolinite, (c) 95% sand + 5% Illite, and (d) 95% sand + 2.5% illite + 2.5% kaolinite. All the columns were prepared similarly in the same manner.
Experimental Section
i. Flow Cell: Two types of minerals were used in each cell: a dominant phase and a tracing phase. To mimic sandstone rocks, the dominant phase was quartz and the trace phase was a clay mineral. Two clay minerals (illite and kaolinite) were used as trace minerals.
ii. Material preparation: First, the mineral specimens were grounded and cleaned ultrasonically with acetone. Mineral characterization was performed using XRD. Then, the powders were sieved and different ranges of grain sizes were separated. The grain surfaces were washed with 1% HCl and deionized water many times and dried overnight in the oven at 70°C. The surface areas were measured by N2 gas sorption using the Brunauer Emmett Teller (BET) method (Micromeritics ASAP- 2020 surface analyzer).
iii. Flow cell building and packing: A chromatography column with dimensions of 1.5 cm by 6.5 cm were built and then packed with minerals. To inhibit the trapping of air bubbles, which can affect the hydraulic conductivity, a wet packing procedure was used Minyard, Burgos [12]. The mineral packing was achieved layer by layer to get rid of air. One end of the column was detached, and water was poured to a height of 2 cm. The minerals and water were added gradually to remove air. The removed end of the column then screwed on. The column ends were roofed with a fine filter in order to prevent mineral grains leaving the system. The columns were configured to suit the same permeability for all cases.
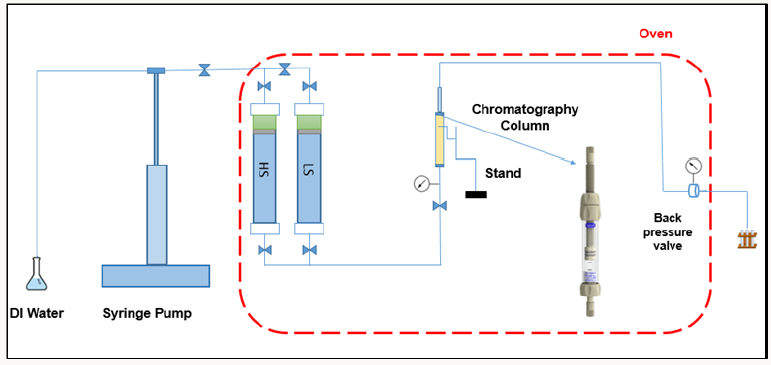
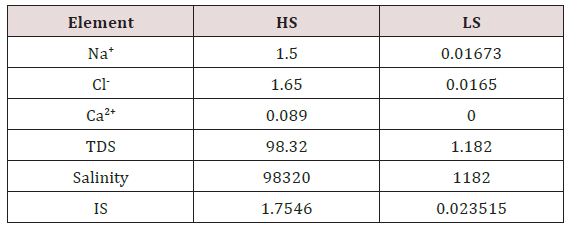
iv. Core Water Flooding: The packed porous media were then saturated with synthetic formation water. The water was displaced by 3 pore volume (PV) oil (from each direction) to achieve Swi and then allowed to age for a week at 70°C. The columns were then flooded with HS and LS water at 90°C (2 PV each). The HS water was identical to the formation water, while the LS water was diluted 100x from the HS water. HS water was injected to simulate formation water. LS water was then pumped from the bottom of the flow cells using a syringe pump. Effluent samples were collected from the top. HS water was injected into the columns until residual oil saturation (Sor) and the stabilized pressure was reached. After maximum oil recovery with HS water, LS water was then injected until no more oil was produced and injection pressure stabilized. The composition of brines and the schematic of the flow cells are shown in (Table 1) and (Figure 1), respectively.
Results and Discussion
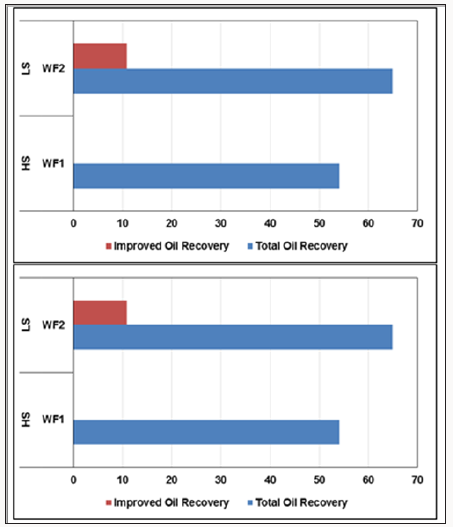
The results of these systematic experiments were shown in Figures 2-4 For the Quartz column, the secondary oil recovery using FW increased gradually until injecting 1 PV; then, the curve reached the plateau at 54% OOIP. The injected fluid was then switched to LS water and the incremental ultimate oil recovery (UOR) was 10.8% OOIP until there was no more oil produced and the pressure and pH stabilize (Figure 2.a).
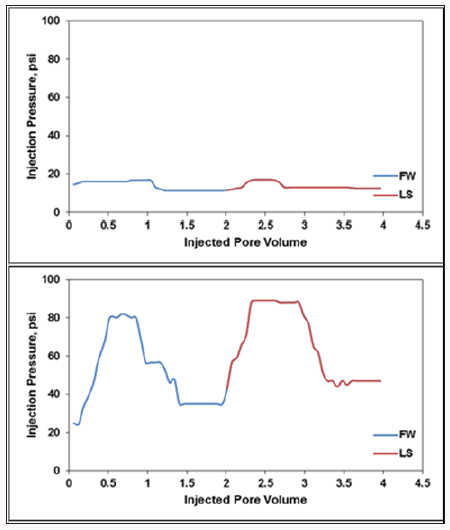
For the Quartz + Clay column, the secondary oil recovery was 53.33% OOIP, while it increased to 65.33% after injecting 2 PV LS water, meaning that there was an LS water flooding effect of 12% OOIP. To sum up, the total oil recovery during HS + LS water flooding was 64.8% and 65.33% for Quartz and Quartz + Clay, respectively. One can notice from the previous results that the existence of clay was barely effective on oil recovery from all the columns. (Figure 3) shows the pressure observations for each column during HS and LS water flooding. The pressure profile was normal in the Quartz column since there was no clay. There was a little increase in pressure while pushing the oil out of the column until the pressure stabilized at 16-17 psi during HS and LS water flooding (Figure 3.a). For the Quartz + Clay, the pressure was 82 psi during HS water flooding and 88 psi during LS water flooding. From the pressure curves in (Figure 3), it is obvious that the pressure increased before oil displacement during HS water flooding and decreased slowly until the pressure stabilized at a lower point. The pressure then increased during LS water flooding, not because of clay swelling (illite and kaolinite do not swell), but because of fines and oil movement and also because LS water caused microscopic sweep efficiency (Al-Saedi et al. 2018).
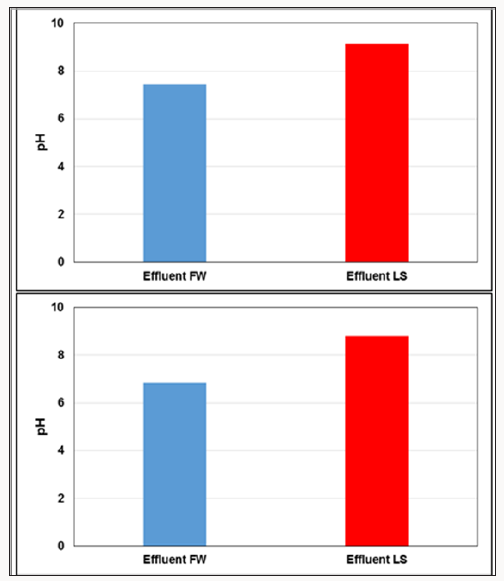
The same HS and LS water was used for all the experiments. The injected HS and LS water pH was 6.54 and 7.1, respectively. The HS effluent pH stabilized at 7.46. The LS effluent shifted upward during LS water flooding. It is traditionally attributed to the divalent cations exchange on the clay surface Austad et al. [6]; Aksulu et al. [11]; Brady and Morrow 2015). In the Quartz column, the pH jumped to 9.14 after injecting 2 PV LS water (Figure 4.a). Since this column does not contain clay, the pH jump can be ascribed to H+ exchange for Ca2+ and Na+. The Ca2+ and Na+ was sorbed already on the negative sites of quartz (>Si-O). That could explain the large oil recovery from the Quartz column. Both >Si-O and carboxylate are negatively charged, in this case the must repelled. The existence of Ca2+ in FW bridged the carboxylate and configured a positively charged group (–COOCa+) on the quartz surface as described in the following reaction:
> SiO− + Ca+2 + COO− ↔> SiOCaCOO
The injected LS water moves the reaction to the left, and in turn, more oil recovery was observed. The pH jumped up to 8.81 with LS water flooding for Quartz + Clay.
Conclusion
The debate around LS water mechanisms is still a topic for discussion. This experiment work shed light on the role of clay on the effect of LS water flooding EOR. The results of this work found out that the existence of clay in sandstone is important but not essential. The oil recovery and the other tests in this work from the Quartz column were in line with the other column containing clays. The cation exchange occurred on the quartz surface, the pH jumped to a high level, and oil recovery improved the same way as in the other columns contain clays.
Acknowledgement
The authors would like to express their grateful acknowledgements for Sandia National Laboratories, which is a multi mission laboratory managed and operated by National Technology and Engineering Solutions of Sandia, LLC, a wholly owned subsidiary of Honeywell International Inc., for the U.S. Department of Energy’s National Nuclear Security Administration under contract DE-NA- 0003525. The authors also would like to express their appreciation to the Higher Committee for Education Development in Iraq and the Iraqi Ministry of Oil/ Missan Oil Company for their support.
References
- Tang GQ, Morrow NR (1999) Influence of Brine Composition and Fines Migration on Crude Oil/Brine/Rock Interactions and Oil Recovery. Journal of Petroleum Science and Engineering 24 (2): 99-111.
- Lager A, Webb K J, Black CJJ, Singleton M, Sorbie KS (2006) Low salinity oil recovery an experimental investigation. Petrophysics 49 (1): 28-35.
- Sohrabi M, Mahzari P, Farzaneh SA, Mills JR, Tsolis P, Ireland S, et al. (2015) Novel Insights into Mechanisms of Oil Recovery by Use of Low Salinity Water Injection. Society of Petroleum Engineers.
- Facanha JMF, Mahzari P, Sohrabi M (2017) Direct Observation of Low Salinity Water Effect: Relationship Between Micro Dispersion Formation and Wettability Alteration. Society of Petroleum Engineers. Manama, Kingdom of Bahrain.
- Al Saedi Hasan N, Brady PV, Flori RE, Heidari P (2018) “Novel Insights into Low Salinity Water Flooding Enhanced Oil Recovery in Sandstone: Study of the Clay Role. SPE Improved Oil Recovery Conference held in USA.
- Austad T, Rezaei Doust A, Puntervold T (2010) Chemical mechanism of low salinity water flooding in sandstone reservoirs. Proceedings of the 2010 Society of Petroleum Engineers (SPE) Improved Oil Recovery Symposium USA.
- Al Saedi Hasan N, Ali K, Alhuraishawy, Ralph Flori, Patrick V Brady (2018) Sequential Injection Mode of High Salinity/Low Salinity Water in Sandstone Reservoirs: Oil Recovery and Surface Reactivity Tests. Journal of Petroleum Exploration and Production Technology.
- Lager A, Webb K J, Collins IR, Richmond DM (2008) LoSal enhanced oil recovery: Evidence of enhanced oil recovery at the reservoir scale. Proceedings of the 2008 Society of Petroleum Engineers (SPE) Symposium on Improved Oil Recovery, USA.
- McGuire PL, Chatham JR, Paskvan FK, Sommer DM, Carini FH (2005) Low salinity oil recovery: An exciting new EOR opportunity for Alaska’s North Slope. SPE Western Regional Meeting, USA
- Ligthelm DJ, Gronsveld J, Hofman JP, Brussee NJ, Marcelis F, van der Linde HA (2009) Novel waterflooding strategy by manipulation of injection brine composition. SPE 119835; EUROPEC/EAGE Conference and Exhibition.
- Aksulu H, Håmsø D, Strand S, Puntervold T, Austad T (2012) Evaluation of low salinity enhanced oil recovery effects in sandstone: Effects of the temperature and pH gradient. Energy Fuels 26(6): 3497-3503.
- Minyard ML, Burgos WD (2007) Hydrologic flow controls on biologic iron(III) reduction in natural sediments. Environmental Science & Technology 41(4): 1218-1224.

Top Editors
-

Mark E Smith
Bio chemistry
University of Texas Medical Branch, USA -

Lawrence A Presley
Department of Criminal Justice
Liberty University, USA -

Thomas W Miller
Department of Psychiatry
University of Kentucky, USA -

Gjumrakch Aliev
Department of Medicine
Gally International Biomedical Research & Consulting LLC, USA -

Christopher Bryant
Department of Urbanisation and Agricultural
Montreal university, USA -

Robert William Frare
Oral & Maxillofacial Pathology
New York University, USA -

Rudolph Modesto Navari
Gastroenterology and Hepatology
University of Alabama, UK -

Andrew Hague
Department of Medicine
Universities of Bradford, UK -

George Gregory Buttigieg
Maltese College of Obstetrics and Gynaecology, Europe -

Chen-Hsiung Yeh
Oncology
Circulogene Theranostics, England -
.png)
Emilio Bucio-Carrillo
Radiation Chemistry
National University of Mexico, USA -
.jpg)
Casey J Grenier
Analytical Chemistry
Wentworth Institute of Technology, USA -
Hany Atalah
Minimally Invasive Surgery
Mercer University school of Medicine, USA -

Abu-Hussein Muhamad
Pediatric Dentistry
University of Athens , Greece

The annual scholar awards from Lupine Publishers honor a selected number Read More...


