Lupine Publishers Group
Lupine Publishers
Menu
ISSN: 2638-6070
Research Article(ISSN: 2638-6070) 
Structural Mapping of Beans (Cowpea) Marketers in Imo State, Nigeria
Volume 2 - Issue 1Osuji MN*
- Department of Agricultural Economics, Federal University of Technology, Nigeria
Received: July 09, 2019; Published: July 18, 2019
*Corresponding author: Osuji MN, Department of Agricultural Economics, Federal University of Technology, Nigeria
DOI: 10.32474/SJFN.2019.02.000130
Abstract
The study is on structural Mapping of beans (cowpea) marketers in Imo state, Nigeria. Purposive and simple random sampling techniques were employed to select twenty- four (24) wholesalers and forty-two (42) retailers. Descriptive statistics, marketing margin analytical technique and Gini coefficient analytical technique were used to analyze the data collected. Results and Conclusion showed that majority of the beans traders were males, within the age range of 31-40 years, literate, married and have acquired marketing experience which ranges from 11-20 years. Beans’ marketing in the study area has two main channels, the major channel starts with the producers (beans farmer) to rural assembler, wholesalers, retailers and final consumer. The Gini coefficients for wholesalers and retailers were 0.663 and 0.656 respectively indicating inequality in the distribution of the traders. This also shows that the market structure for beans in the study area is imperfectly competitive.
Keywords: Structural; Organization; Beans (Cowpea); Marketers; Imo State
Introduction
Agriculture has been the backbone in the growth and development of many developing countries. It is a major sub-sector and has emerged to have a great importance in the development of economic sector of many developing countries including Nigeria. From the economic standpoint, according to [1] agricultural sub-sector has contributed profusely, constituting about 56.5% of gross domestic product (GDP) with 23% from crop production, employing about 70% labour force and providing over 80% of the food consumed in the country. The expansion of agriculture in Nigeria has greatly resulted to an increasing employment rate, foreign exchange rate and food security thereby elevating the standard of living of the populace [2]. Similarly, [3] also reported agriculture as a key driver to national survival, unemployment, food and foreign exchange earnings. However, the contribution of agriculture to Nigeria economy declined to 36.2% in [2] which was due to problem of flooding and other weather-related problems which adversely affected crop production and drastically brought down agricultural productivity in many part of the country [1,4]As a result, it is essential to resuscitate and heighten agricultural production in Nigeria specifically in the area of crop production to meet the appreciating demand for grains and leguminous crops and further ensure continual food supply to the growing population especially in the rural areas where income generation and livelihood heavily depend on agriculture, hence the ultimate goal of food security and sustainability can be attained. Beans (vigna unguiculata) are grains that are rich in protein source, consumed around the globe.it is a leguminous plant protein crop with protein content of 23%, rich in vitamins and minerals. According to [5] beans were introduced in the world mainly in the west and central Africa through slave trade and grow in tropical and sub-tropical area of the world [6]. It is cultivated in Nigeria mainly from its seed; [7] also reported that beans are essential staple food crop produced mainly for domestic consumption and animal feed. However; its role cannot be overemphasized. It is a cover crop commonly known for its capacity of improving and repairing soil fertility by converting atmospheric nitrogen through its root nodules to soil nitrogen which is in turn used up by plants.
This makes it able to strive well in poor and deteriorated soil. It is also intercropped with other crops such as maize, millet, sorghum in order to improve their yield. According to Muimui beans play a very important role in improving the livelihood of rural farmers by providing a source of income adding to its role to food and nutrition security. Market structure demonstrate the interrelated behavior of a market, such as the number and related strength of buyers and sellers, degree of freedom in determining the price, level and forms of competition, extent of product differentiation and ease of entry into and exit from market. The fundamental component of the structure conduct and performance (SCP) model described by [8] is the market structure. [9] also defined market structure as those features of the organization which seems to impact strategically the nature of competition and pricing within the market. [10] identified those factors considered to be of importance in determining the market structure of a product as the degree of product differentiation, the ease of entry and exit of the buyers and sellers into and out of the market and the status of knowledge about cost, price and market conditions among the participants in the market. The structure a market exhibits can be used to classify it based on the types of market structure that exist which includes perfect competition, monopolistic, oligopolistic and pure monopoly. Nigeria is currently the largest producers of beans in the world, yet, the demand for beans in Nigeria is running a domestic supply deficit of 518400 metric tons per year [11]. Moreover, expansion in beans production and marketing is hindered by inadequate research, poor information and record keeping which encourages weak production and distribution of beans in Nigeria. This is in line with [12] who reveals that Farmers usually accept lower prices for their products because of inadequate market information and capital to expand their beans production and access major markets for their produce. Beans marketing have a plethora of issues surrounding its prevalence, these necessitate the various research questions aimed to proffer solutions that can increase the organization of structure of beans marketing in Imo state Nigeria; the following research questions guided the study
a) What are the socioeconomic characteristics of beans marketers in Imo state?
b) What is the concentration of beans wholesalers and retailers in the study area?
c) What is the mapping of beans marketing channels in the study area? Therefore, this study aims at examining the structural mapping of beans marketers in the study area with the following specific objectives
a) Examine the socioeconomic characteristics of beans marketers in the study area.
b) Assess the organization of beans marketing in the study area through the channels
c) Ascertain the structural identity of beans marketing through the seller concentration.
Material and Methods
The study was conducted in Imo state, the state is situated in the South Eastern part of Nigeria. The state is divided into three agricultural zones which are Okigwe, Orlu and Owerri and consists of twenty-seven (27) local government areas [13] It lies within the latitude 40451N and 70151N and longitude 60501E and 70 251E with land area of about 5,100km2 (National Bureau of Statistics, 2014). It is bordered by Abia state on the East, River Niger and Delta state on the West, by Anambra State to the North and Rivers State to the South. It has an annual rainfall varying from 1,500mm to 2,200mm, an average annual temperature above 20oC and an annual relative humidity of 75% with humidity reaching 90% in rainy season. The estimated population is 4.8 million and the population density varies from 230-1,400 per square kilometer. The main occupation in Imo state is trading, civil service and agriculture [13]. The zonal main market was purposively selected due to relative high concentration of marketing activities and beans trade in these markets. These include owerri main market, orlu main market and okigwe main market.
From each zone, one rural LGA was randomly selected. In each of the rural LGAs, a major market was selected for the study, making it three (3) urban and three (3) rural markets to arrive at a total of six (6) markets. In each of the urban markets 6 beans wholesalers and 6 beans retailers were randomly selected. This gives 24 wholesalers and 24 retailers from the urban markets. From the rural markets, 6 retailers were randomly selected, giving 18 retailers on the whole. Therefore, this research was carried out using 24 wholesalers and 42 retailers (24 urban and 18 rural retailers) to give a total of 66 respondents for the study. Primary data was used for the study and it was obtained through the use of a structured questionnaire which was administered and retrieved from to 62 respondents. Data collected were analyzed using descriptive statistic, marketing margin analytical technique and Gini analytical technique. Gini coefficient is used to determine the market concentration of sellers in the market. It can be computed using the formula: G.C = 1 -ΣXY
Where, G = Gini coefficient
X = Percentage share of each class of seller.
Y = Cumulative percentage of the sales
The Gini coefficient ranges from zero to one. A perfect equality in concentration (low) of sellers is expected if Gini coefficient tends toward zero, while perfect inequality in concentration (high) of sellers is expected, if Gini coefficient tends towards one. This was also used by [1].
Results and Conclusion
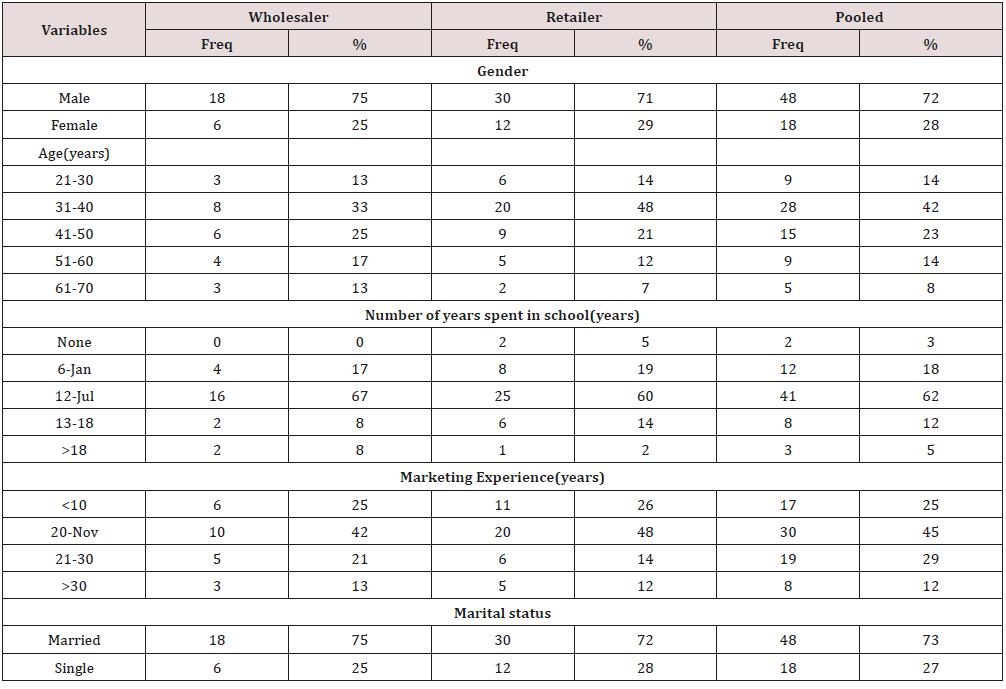
The result of socioeconomic characteristics presented in Table 1 above reveal that majority (72%) of the pooled beans traders were males, in the wholesaler category, 75% of the traders were male while 71% of the retailers were male and falls within the age range of 31-40 years which are referred to as economically active and usually self-motivated and innovative. The male involvement in beans marketing implies that beans marketing is vigorous and impose a lot of risks such as risk of travelling a long distance to the northern part in search of beans and as such may defer female participation in wholesale marketing considering their feminine nature and their significant role in home-keeping and child care. The response on their level of educational attainment shows that majority (67%) of the wholesaler, (60%) of the retailers and (62%) of the pooled beans traders has spent 7-12 years in school with the mean years of 12years and 11 years for wholesalers and retailers respectively. This implies that most of the bean’s traders are literate and are enlightened and can easily adopt innovative ideas that will enhance their performance and efficiency in carrying out their marketing activities. This is in line with the opinion of [14] that an educated marketer is in a better position for more investments and rational decisions for increased income than an uneducated one. The results in Table1 also revealed marketing experience of the beans marketers, it was indicated that about 42% of the wholesalers, 48% of the retailers and 45% of the pooled traders had been in beans marketing. The mean marketing experience was 8years and 9 years for wholesalers and retailers respectively. This implies that beans marketers have gained a rational knowledge in marketing which will enable them to manage their business more effectively while maximizing profit. The table showed that majority of the bean’s marketers were married, this could be attributed to the fact that married trader have more responsibility to cater for and also have free supply of family labor. The traders in the study area were found to belong to their trade/co-operative association, essence being to help them pool their resources together and purchase in bulk and also gain access to credit facilities to enable them to expand their businesses.
Tables 1-12
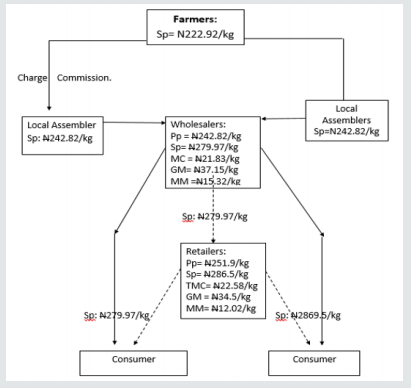
Marketing Channels for Beans
(Figure 1) Marketing Channels for Beans Marketing in the study area Pp= Purchase price, Sp= Selling Price, TMC = Total Marketing Cost, GM= Gross Margin, NM= Net Margin Source: Field Survey data, 2019. The result in the diagram above shows detailed marketing channels for beans. The first stage in the marketing channels starts with the major channel which is the producers (beans farmer) who sell to the rural assembler in the production area or in the local market [15]. The rural assembler then assemble the produce and sell to the wholesalers who normally comes from distant place to purchase the product, they normally purchase in large quantity from different rural assemblers and sell in small quantities to retailers who are normally traders, they are those retailers who sell to consumers and some of the local processors of moimoi and Akara. The minor channel is where the wholesalers sell their produce directly to consumers. This normally happened in the urban markets where beans processors directly purchase from the wholesalers as soon as they arrive from the Northern States where beans are purchased. The direct linkage between the producers and consumers is non-existent and not feasible because of the high market risks and financial requirement involved in purchasing it from the producers in the North.
Market concentration for beans marketers in the study area
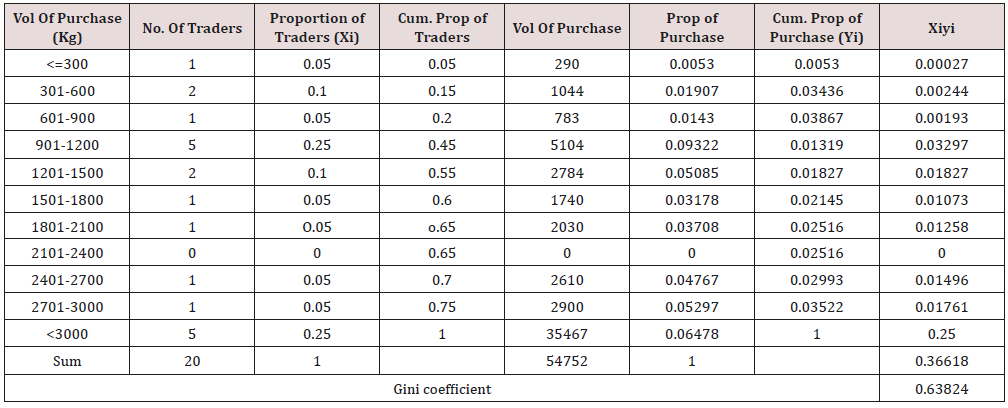
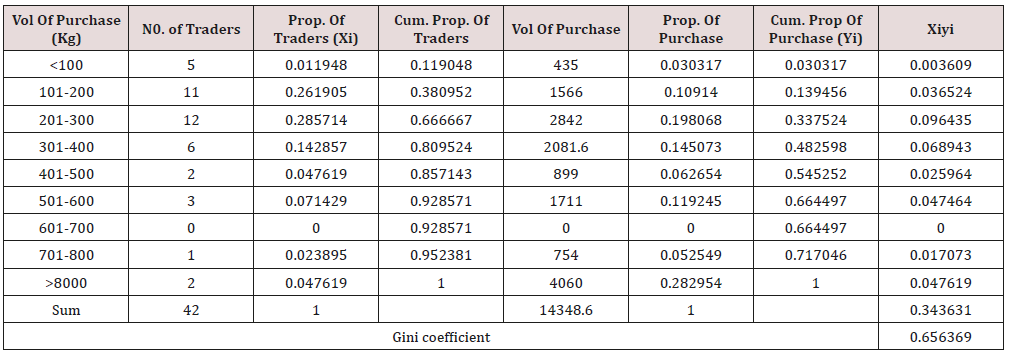
In Table 2 (a), it was shown that total sales of the sampled wholesalers was 54.75 metric tons and only 25% of them (wholesalers) sold a total of 35.47 metric tons representing 64.78% of the total beans sold by the wholesalers in the area while the majority of the wholesalers (75%) sold only 19.29 metric tons (35.22%) of the total beans marketers. It shows that only few traders (in this case 25%) can significantly influence the beans wholesale trade. The Gini coefficient for wholesalers was 0.663 which is higher than 0.35 that illustrates market equality. This indicates level of inequality of 0.663 among the distribution of the wholesalers [16]. This implies that there is 66.3% inequality in size distribution of wholesalers’ concentration. Thus, the market is 66.3% less competitive (Imperfect). In other words there is low level of competition in the wholesale beans market; it was found that there are few marketers who engaged in wholesale marketing because of the large investment of capital required and the marketing risk associated with travelling, sourcing and assembling of beans from different markets of Northern States. These few wholesalers could influence supplies by increasing or decreasing the quantity marketed. In other words, few wholesalers’ share was significant part of volume of trade in the market such that it could affect the market price which would invariably lead to market imperfection. In Table 2(b), it was shown that total sales of the sampled retailer was 14.35 metric tons, only 4.76% of the retailer sold 28.30% (4.06 metric tons) of the beans marketed, 28.51% of the retailers sold 19.81% (2.84) of the beans marketed, 14.28% of the retailers sold 14.50% (2.08 metric tons) of the beans marketed and 7.14% of the retailers sold 11.92% (1.71 metric tons) of the beans marketed. The Gini coefficient for retailers was 0.656 which is higher than 0.35 that illustrates market equality. This indicates level of inequality of 0.656 among the distribution of the retailers. This implies that there is 65.6% inequality in size distribution of retailer’s concentration thus, the market is 65.6% less competitive (imperfect) [17].
Conclusion
From the findings, it could be deduced that beans marketing is male dominated having majority of them in wholesaling than in retailing and are still at their active age. The beans move from the producers through the local assemblers, wholesalers, retailers and then to the final consumers. The market structure of beans in the study area is imperfectly competitive; this is because the Gini coefficient of the wholesalers and retailers were 0.663 and 0.656 respectively which is categorized as imperfectly competitive of oligopolistic market. This could be due to high level of inequality in the distribution of the traders resulting from existing market barriers to free entry and exist to the market, High initial capital requirement, risks associated with wholesale marketing and market skills.
References
- yeri AA, Salihu M, and Salamatu u (2015) Determination of Conduct, Performance and Structure of Cowpea Marketing in Yola North and South Local Government Areas of Adamawa State, Nigeria. American Research Journal of Agriculture.
- NBS (2012) Gross Domestic Product for Nigeria. A Publication of the National Bureau of Statistics Abuja, Nigeria.
- Adebayo K, Okuneye PA (2005) Economics of agricultural Extension IN: Agricultural Extension in Nigeria Adedoyin S F (Eds.), pp. 251.
- Girei, AA and Dire, A (2013) Profitability and Technical Efficiency Among the Beneficiary Crop Farmers of National Fadama II Project in Adamawa State, Nigeria. Net Journal of Agricultural Science 1(3): 87-92.
- Katanga YN, Hussain I, Wudil AH,Haruna U (2016) Analysis of cowpea Marketing channel in Kiyawa Local Government Area of Jigawa State, Nigeria. International Journal of Agricultural Policy and Research 4(9): 157-201.
- Debaniyu IF, Jagaba YC, Ramatu UK, Ingye IY (2011). Cowpea Marketing and Consumer Preference in Magama Local Government Area of Niger State, Nigeria. J Agric Soc Sci 7(1): 30-34.
- Afolami, CA (2001) Market Integration and Inter Temporal Pricing Efficiency for Cowpea in Nigeria. International Journal of Agricultural Science, Science, Environment and Technology 1(2): 171-185.
- Bain JS (1968) Industrial Organization, John Willey and Son, New York, 71-87. Beneficiary Crop Farmers of National Fadama II Project in Adamawa State, Nigeria Net Journal of Agricultural Science 1(3): 87-92.
- Olukosi JO, Isitor SU, Ode MO (2007) Introduction to Agricultural and Prices, Principle and applications. Living Books Series, GU Publications, Abuja FCT, pp. 37-44.
- Bukar, U, Mohammed D, Wakawa R, Shettima B G, and Muhammad S T (2015) Analysis of Market Structure, Conduct and Performance for Pepper in Borno State, Nigeria. Journal of Agricultural Economics, Environment and Social Sciences 1(1): 181-190.
- Coulibaly O, Lowenberg DeBoer J (2014). The economics of cowpea in West Africa.
- Langyintuo AS, Lowenberg Deboer J, Faye M, Lambert D, Ibro, et al. (2003). Cowpea supply and in west and Central Africa. Field Crops Res 82: 215-231.
- Obasi, Nzeakor, (2015) Factors Influencing the Cost and Profit of Beans Market in Umuahia North Local Government Area of Abia State, Nigeria International Journal of Agriculture Earth Science 2(3): 82-91.
- Izge AU, Odo PE, Dugje IY (2009) Arable Crop productions. Daa press limited. Kaduna state, Nigeria, pp. 3-7.
- Jigawa State Development Strategy Documents J-SDSD (2005). Jigawa State Ministry of Budget, Planning and Expenditure Control Dutse, pp. 1-5.
- Katanga YN, Hussain I, Wudil AH, Haruna U (2016) Analysis of cowpea Marketing channel in Kiyawa Local Government Area of Jigawa State, Nigeria. International Journal of Agricultural Policy and Research 4(9): 157-201.
- NBS (2014) Not Farms Alone: A study of Rural Livelihood in the Middle Belt of Nigeria. Darease Working paper, pp. 38.

Top Editors
-

Mark E Smith
Bio chemistry
University of Texas Medical Branch, USA -

Lawrence A Presley
Department of Criminal Justice
Liberty University, USA -

Thomas W Miller
Department of Psychiatry
University of Kentucky, USA -

Gjumrakch Aliev
Department of Medicine
Gally International Biomedical Research & Consulting LLC, USA -

Christopher Bryant
Department of Urbanisation and Agricultural
Montreal university, USA -

Robert William Frare
Oral & Maxillofacial Pathology
New York University, USA -

Rudolph Modesto Navari
Gastroenterology and Hepatology
University of Alabama, UK -

Andrew Hague
Department of Medicine
Universities of Bradford, UK -

George Gregory Buttigieg
Maltese College of Obstetrics and Gynaecology, Europe -

Chen-Hsiung Yeh
Oncology
Circulogene Theranostics, England -
.png)
Emilio Bucio-Carrillo
Radiation Chemistry
National University of Mexico, USA -
.jpg)
Casey J Grenier
Analytical Chemistry
Wentworth Institute of Technology, USA -
Hany Atalah
Minimally Invasive Surgery
Mercer University school of Medicine, USA -

Abu-Hussein Muhamad
Pediatric Dentistry
University of Athens , Greece

The annual scholar awards from Lupine Publishers honor a selected number Read More...


