Lupine Publishers Group
Lupine Publishers
Menu
ISSN: 2638-6070
Research Artcle(ISSN: 2638-6070) 
Standardization of Technology for Preparation of Sani-A Jaggery Based Crushed Sesame
Volume 3 - Issue 2DK Gojiya*, VN Gohil and VR Akabari
- Agricultural Research Station, India
Received: July 20, 2020; Published: July 29, 2020
*Corresponding author: DK Gojiya, Agricultural Research Station, JAU, India
DOI: 10.32474/SJFN.2020.03.000157
Abstract
Sesame seeds are used in the preparation of a number of food products. In north India, the black sesame seeds are used in preparation of Sani-Jaggery based crushed sesame. In this study an attempt was made to standardize the method for preparation of sani and enrich its quality with addition of different levels of dry fruits (cashewnuts and Almonds, date, Figures, Coconut shreds) and Honey and also assessed organoleptic and storage stability. The standardized sani was organoleptically evaluated using a sensorial affective hedonic scale. The results indicate that Sani samples prepared from raw sesame with 60% Jaggery and mixed with different level of dry fruits and packaged in PET (Polyethylene Terephthalate) container and stored at room temperature got good mean score up to 25 days storage except honey-based samples which was spoiled after 10 days storage. It was revealed that among all the sani treatments, Sani prepared with 10% addition of shredded cashewnuts and almonds (1:1) got highest mean sensory score for overall acceptability up to 25 days storage. There was a considerable growth in the microbial population during storage of sani samples but recorded below the satisfactory level up to 25 days of storage. E. coli and Salmonella was not detected in any of the samples during entire storage period.
Keywords: Sani; Sesame; Sensory; Storability; Microbial load
Introduction
Sesame (Sesamum indicum L) is one of the world’s important and oldest oilseed crop known to man that plays an important role in human nutrition. Sesame seeds are good source of proteins, complex carbohydrates and some minerals. The chemical composition of sesame shows that the seed is an important source of oil (44-58%), protein (18-25%), carbohydrate (~13.5%) and ash (~5%). Sesame seed is of approximately 50 percent oil (out of which 35% is mon Ranganna ounsaturated fatty acids and 44% polyunsaturated fatty acids) and 45 percent meal (out of which 20% is protein) [1,2]. It is source of nutritional and helpful biologically active components, such as phytochemicals Kanu et al 2007. Presence of isoflovones and sesamin plays a role in human health. India is the second highest producer of sesame seeds after Myanmar with an annual production of 751000 MT, followed by China and Tanzania during year 2017(Anon., 2020). Gujarat contributes 30% of total production followed by West Bengal (17.8%), Rajasthan (17.6%), Tamil Nadu (7.6%) Andhra Pradesh (5.4%) and Madhya Pradesh (5.2%) [3].
Sesame seeds are used in the preparation of a number of food products. In the Far-East, sesame seeds are roasted (180-200 °C) and their oil is extracted and sold as roasted sesame oil. Sesame oil is used as a salad or cooking oil, in shortenings, margarine and to marinate meat and vegetables. The seed is also consumed throughout the world in condiments and as an essential constituent in different recipes. It is used to add texture and flavor to bread, biscuit, cracks and salad dressing. In Gujarat sesame seeds are used in preparation of till chikki and particularly the black sesame seeds are used in preparation of Sani. Sani is the product prepared by mixing the jaggery with raw or roasted sesame seeds and partially crushing in equipment called ghani until the oozing of oil from sesame seeds. Sometimes sani is enriched by using date, Figures, cashew nut, almond, gums, coconut and many other valuable ingredients. Sani is especially prepared and consumed in winter to keep the body warm and aiding blood circulation. But no scientific and standard method is available for the preparation of sani. Therefore, this study was proposed to standardize the method for preparation of sani and to evaluate it’s organoleptic.
Materials and Methods
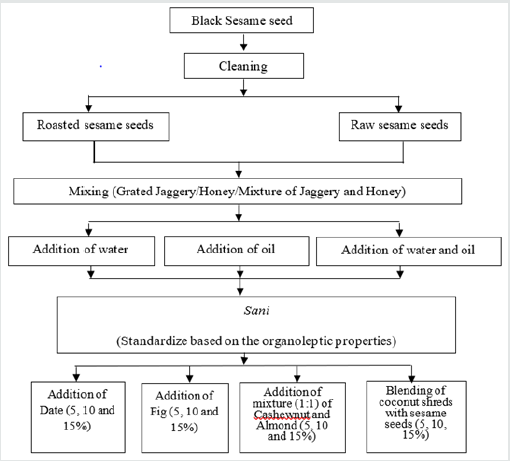
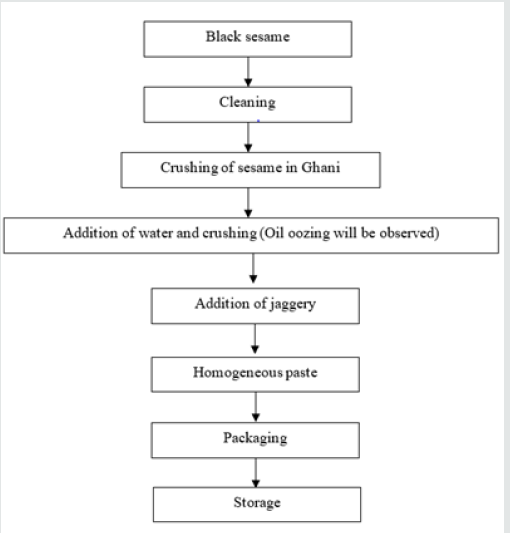
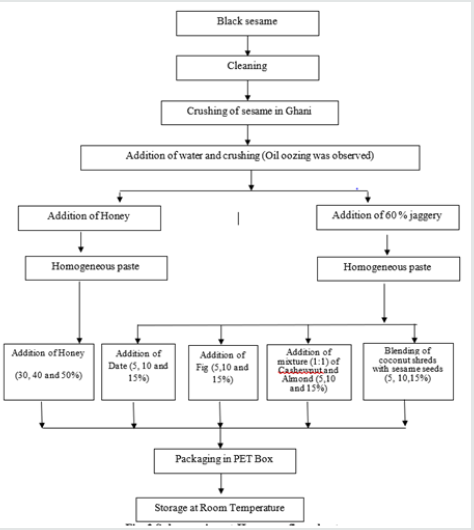
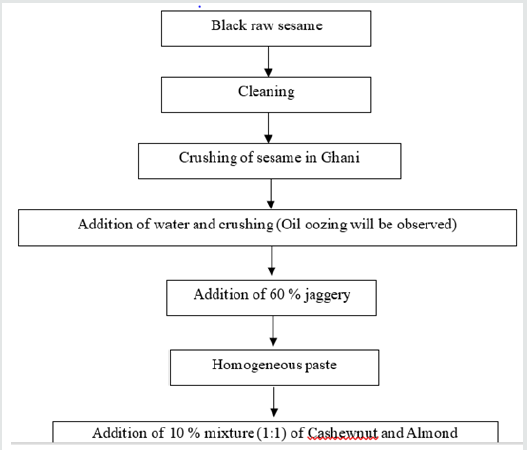
Initially Sani-Jaggery based crushed sesame was developed according to the experimental details shown in Figures 1. Earlier, it was decided to add oil and oil with water but during the experimentation, it was found that oil separated out during the crushing process was sufficient to prepare the sani. So, there was no need to add extra oil. Hence, it was decided to discard the treatment of addition of oil and oil with water. The sani prepared using honey was found to be sour after 3-4 days of its preparation. The samples added with honey got the good sensory score, but its shelf life was shorter. Keeping all these facts in view, the experiment was divided in to two parts viz., sub-experiment-I and sub-experiment-II as per flow charts given in Figures 2 & 3, respectively. All the samples of both experiments (Sub Exp-I &Exp-II) were kept for 1 month of storage and analyzed in terms of arithmetic mean of their sensory attributes such as taste, flavour, colour, texture, appearance and overall acceptability at 5 days interval by 9-points Hedonic scale standard method as suggested by Ranganna et al. [4]. Mean sensory score of different attributes table is presented here under. The panelists from different ages including students and faculties were given the coded samples of sani and allowed to judge the samples for different sensory attributes based on their degree of preference [5-8].
Experimental Details Sub-experiment I
The sub experiment I was carried out as per details and flow chart given below.
Independent parameters
Type of sesame (A): (A1= Roasted and A2= Raw). Level of Jaggery (B): (B1=40 %, B2=50 % and B3=60 %).
Results and discussion of sub-experiment I
Effect of sub-experiment-I treatments on organoleptic
properties viz., taste, flavor, texture, Color, Appearance and
Overall acceptability were studied, and their results are
summerized below.
From the Table 1, it can be seen that the sensory mean
score for the taste of different samples was decreased with
an increase in storage period. On the first day, the highest mean score for the taste was reported for the sample A2B3
(7.40±0.70) followed by A2B2 (7.10±0.99). It was also noted
that after 15 days of storage treatmets A1B1, A1B2, A1B3 and
A2B1 were spoiled hence this four treatments are discarded.
A2B3 treatment got highest taste mean score (4.20±0.72)
followed by treatment A2B2 with taste mean score(3.80±0.82)
after 25 days storage.
From the Table 2 it can be seen that as the storage period increases, the sensory mean score for the flavour decreases. On the first day, treatment A2B3 had highest mean score (7.46) followed by treatment A2B2 (7.40±0.52). But after 25 days of storage, remainig both treatments had decreased sensory mean score for the flavour, treatment A2B2 and A2B3 had sensory mean score of 4.00±0.52 and 3.70±0.48 respectively.
Table 2: Mean score for flavor of different samples at 5 days interval of storage (Mean ± SD, n=10).

From the Table 3, it can be seen that as the storage periods increased, the sani had poor texture. As the time passed, sensory mean score of the texture decreased. The product slightly got dried-up due to evaporation of moisture which also resulted in decrease in texture mean score. The sani found harder with the increase in storage period. On the very first day, the treatment A1B3 and A2B3 found highest sensory mean score (7.40) followed by the treatment A2B2 (7.30±0.52). Hardness in the form of texture increased as the storage life increased. At the end of the 25 days treatment A2B3 had mean score of 3.90±0.48 for the texture followed by 3.70±0.48 (A2B2).
Table 3: Mean score for Texture of different samples at 5 days interval of storage (Mean ± SD, n=10).

From Table 4, it can be seen that the mean score for the appearance decreased as the storage period increased. At the first day, the treatment A2B3 had the highest mean score of 7.20±0.63 followed by A2B3 (7.10±0.99) and A1B3 (7.00±0.67). At the end of the Day-25, the sensory mean score for the appearance decreased in comparison to Day 25. The (4.10±0.48) mean score was noted for the treatment of A2B3followed by treatment A2B2 (3.60±0.67).
Table 4: Mean score for appearance of different samples at 5 days interval ofstorage (Mean ± SD, n=10).

Table 5 represents the mean sensory mean score for the color of different sani samples. From the data, it can be seen that highest mean score for color was noted for the treatment A2B2 (7.30±1.43) followed by A1B3 (7.20±0.82). But as the storage period increased, mean score for the color decreased and at the end of the Day-25, treatment A2B3 had highest mean score for the color (3.80 ± 0.53) followed by A2B2 (3.60±0.70).
Table 6 represents the overall acceptability of the different treatments. It can be seen that the mean score for the overall acceptability decreased as the storage period increased. At the first day, the treatment A2B3 had the highest mean score of 7.10±0.57followed by A2B2 (6.90±1.37) and A1B2 (6.80±1.03). At the end of the Day-25, the sensory mean score for the overall acceptability decreased in comparison to Day 1. The highest mean score was rated for the treatment of A2B3 (3.80±0.48) followed by A2B2.
Table 6: Mean score for overall acceptability of different samples at 5 days interval ofstorage (Mean ± SD, n=10).

Results of sub experiment I
Sani samples were prepared according process flow chart shown
in Figures 2 and packaged in PET (Polyethylene Terephthalate)
container and stored at room temperature. During storage it was
found that the mean sensory score of all treatments were decreased,
but remained well within acceptable limits during 15 days storage
period. After the 15 days storage the treatment A1B1, A1B2, A1B3
and A2B1 were spoiled therefore after 15 days storage period,
these four treatments were discarded. The mean sensory score of
treatments A2B2 and A2B3 reported within acceptable limits up to
25 days storage period.
Among these two treatments, treatment A2B3 (raw sesame
with 60% Jaggery) had the highest mean score of 7.10±0.57 for
overall acceptability. Treatment A2B3 also got good sensory mean
score up to 25 days storage. Keeping above fact in view, it is revealed
that the raw sesame with 60% Jaggery is best combination for sani
making process.
Further the Sub experiment-II was carried out to developed Sani as per treatment A2B3 (raw sesame with 60% Jaggery) of sub experiment-I with addition of dry fruits at different levels according to the experimental details and flow chart given below.
Experiment details of sub-experiment II
Effect of different treatments on Taste of sani sample at 5 days’ intervals of storage is reported in the Table 7. From the data it can be seen that the mean sensory mean score for the taste of different samples was decreased with an increase in storage period. On the first day, the highest mean score for the taste was reported for the sample CA-10 (8.00±0.47) followed by CA-5 (7.50±0.71). From the data, it can also be seen that fresh honey-based samples got good sensory mean score but after 10 days of storage, they started to become sour so they were discarded after 10 days of storage. After 25 days of storage, the highest taste mean score (4.70±1.01) was observed for the treatment CA-5 and CA-10 while the lowest taste mean score (3.20±0.38) was recorded by the treatment D-15.
Table 7: Taste mean score of different sani treatments at 5 days intervals of storage (Mean ± SD, n=10).
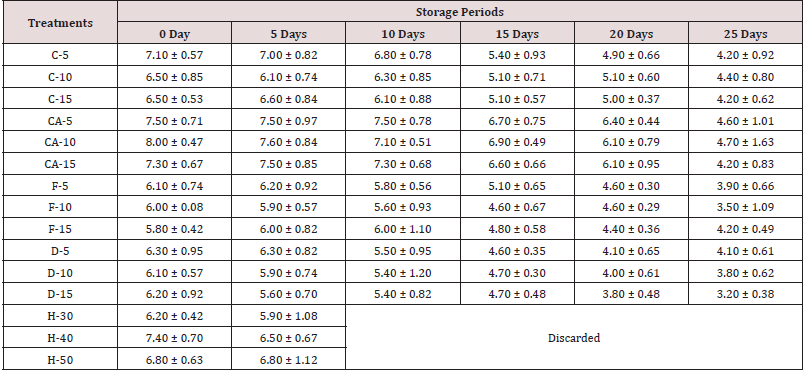
Table 8 represents the Flavor mean score of different sani treatments at 5 days’ intervals of storage.it can be observed from the Table 8, that the mean sensory score for the flavor of different samples was decreased with an increase in storage period. On the first day, the highest mean score for the flavor was found for the sample CA-10 (7.70±0.48) followed by CA-5 (7.00±0.94). At the end of 25 days of storage, the highest flavor mean score (4.40±0.57) was observed for the treatment CA-10 while the lowest taste mean score (3.30±0.46) was reported by the treatment D-15.
Table 8: Flavor mean score of different sani treatments at 5 days intervals of storage (Mean ± SD, n=10).
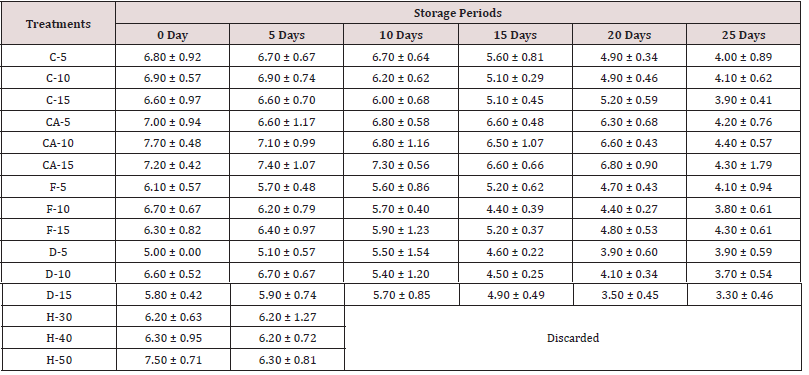
The influence of different treatments on Texture of sani sample during storage is shown in Table 9. From the data it was noted as the time passes, sensory mean score of the texture decreases. The sani found harder with the increase in storage period. At the first day, the cashewnuts and Almonds added Sani sample got highest mean score. The treatment CA-5 and CA-10 had the highest mean score of 7.40±0.95followed by D-10 (7.20±0.99). At the end of the 25 day, the sensory mean score for the texture decreased in comparison to 1st Day and the highest mean score was rated for the treatment CA-5 (4.20±1.55) followed by C-15 (4.10±0.61).
Table 9: Texture mean score of different sani treatments at 5 days intervals of storage (Mean ± SD, n=10).
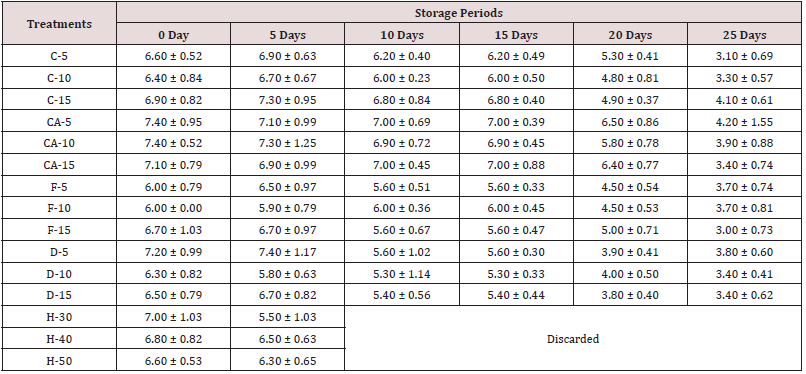
Table 10 represents the color mean score of different sani treatments at 5 days’ intervals of storage. It can be seen that the mean score for the color decreased as the storage period increased. At the first day, the treatment CA-5 had the highest mean score of 8.00±0.67followed by CA-15 (7.30±0.42). At the end of the 25 days, the sensory mean score for the color decreased in comparison to 1st day and the highest mean score was rated for the treatment CA-10 (4.10±0.13) followed by CA-15 (4.00±1.07).
Table 10: Color mean score of different sani treatments at 5 days intervals of storage (Mean ± SD, n=10).
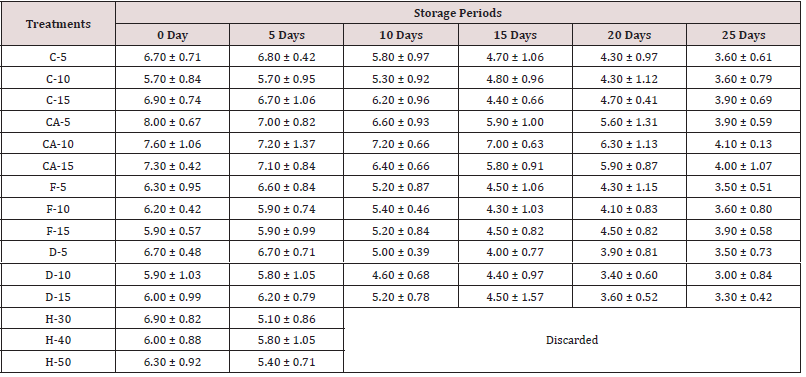
Table 11 represents the appearance mean score of different sani treatments at 5 days’ intervals of storage. Mean score for the appearance is gradual decline in sensory attributes during storage in all treatments. At the first day, the treatment CA-5 had the highest mean score of 7.20±0.79, followed by C-15 (7.00±0.67) and CA- 10 (7.00±0.94). At the end of the 25 days, the highest sensory mean score for the appearance was rated for the treatment C-15 (4.40±0.81) followed by treatment C-5 (4.30±1.23).
Table 11: Appearance mean score of different sanitreatments at 5 days intervals of storage (Mean ± SD, n=10).
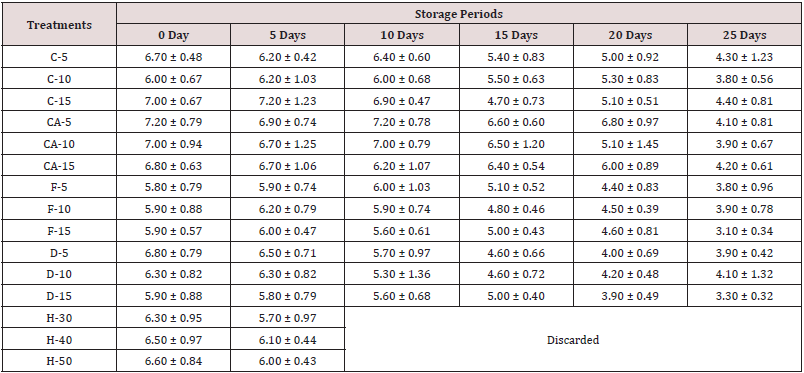
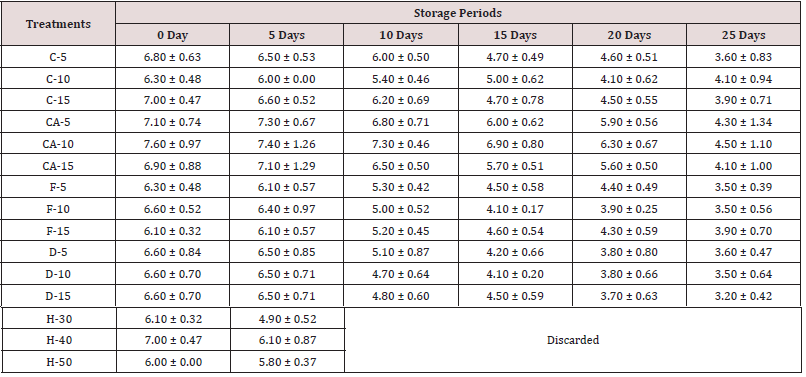
It is clearly observed from the Table 12 data that the mean score of overall acceptability of the different sani products stored at room temperature decreased with the passage of time. On the first day, the highest mean score for the overall acceptability was found for the sample CA-10 (7.60±0.97) followed by CA-5 (7.10±0.74). At the end of 25 days of storage, the highest overall acceptability mean score (4.50±1.10) was observed for the trea
Table 12: Overall acceptability mean score of different sani treatments at 5 days intervals of storage (Mean ± SD, n=10).
Microbial status of sani during storage
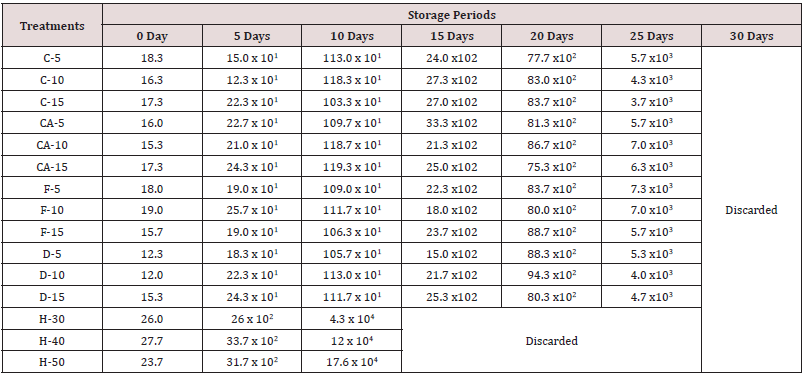
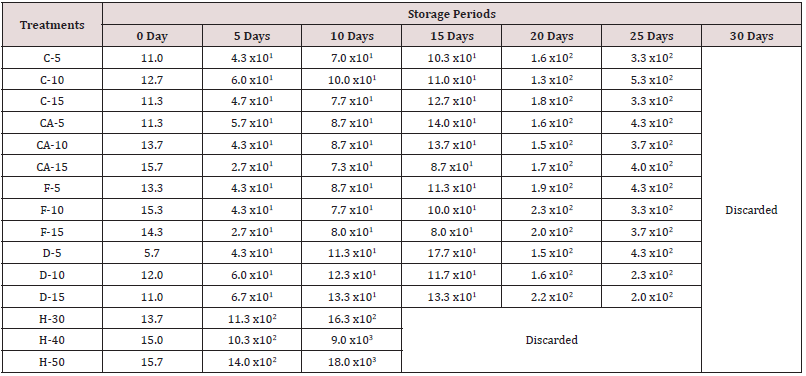
Microbial analysis in terms of Total plate count (cfu/g), yeast & mould (cfu/g), E. coli (cfu/g) and Salmonella (cfu/g) count were determined as described by AOAC 2006 [7] 18th ed. 1g of each sample was added to 9ml sterile distilled water and vortexed. This formed the initial dilution from which subsequent tenfold dilutions were made and used for analysis. Portions 0.1ml of different serial decimal dilution was spread plated on nutrient agar for total plate count and potato dextrose ag APEDA ar for fungi count. Total plate count and Yeast & Mold count (cfu/g) are presented in Table 13 & 14. E. coli and Salmonella was not detected in any of the samples during entire storage period.
The perusal of Table 13 & 14 revealed that there was a considerable growth in the microbial population during storage of different sani samples. In jaggery based sani counts were recorded below the satisfactory level i.e. < 1x10⁴ cfu/g hence, assumed to be safe and fit for human consumption up to 25 days of storage. After the 30 days of storage all the samples cross the recommended level of total plate count as well as yeast & mould count, therefore all the sample were discarded after 30 days of storage. It was observed that the honey based sani gave the satisfactory results for microbial population up to 5 days’ storage. After the 10 day of storage, honey became sour and microbial population of the honey-based samples was reached above the prescribed limit. They are assumed to be unsafe for human consumption so, all the honey-based samples were discarded after 10 days of storage.
Conclusion of sub-experiment-II
Sani samples prepared from raw sesame with 60% Jaggery and mixed with different level of dry fruits according to process flow chart shown in Figures 3 & 4. The samples were packaged in PET (Polyethylene Terephthalate) container and stored at room temperature during the sub experiment-II. All the samples got good mean score up to 25 days storage except honey-based samples which was spoiled after 10 days storage. Therefore, all the honeybased samples were discarded after 10 days storage. It was found that among all the sani treatments, treatment CA-10 (Sani prepared with 10% addition of Cashewnuts and Almonds (1:1)) got highest mean sensory score for overall acceptability up to 25 days storage. The treatment CA-10 had overall acceptability mean score of 7.6 on 1st day and 4.5 on 25th day of storage (Table 15).
The Bio-Chemical Analysis of Optimized Sani Sample
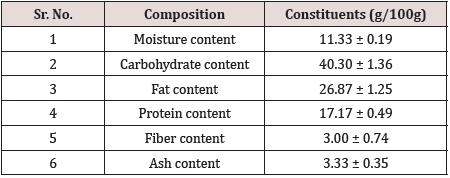
The bio-chemical constituent of optimized sani sample was analyzed in triplicate for moisture content, fat content, protein content, fiber content and ash content using standard methods of Association of Official Analytical Chemists (AOAC, 2006). The carbohydrate content was obtained by difference (i.e. subtracting the values obtained for moisture content, fat content, protein content, fiber content and ash content from 100). The results are as under.
Conclusion
In this present study the formulation and process for preparation of sani enriched with different level of dry fruits were standardized. The research data discovered from this research suggest that Sani should be prepared from black raw sesame with 60% jaggery added with 10 % Cashewnut and Almond (1:1). The sani prepare from this method and packed in PET (Polyethylene Terephthalate) container safely stored at room temperature without quality deterioration up to 25 days storage except honey-based samples which was spoiled after 10 days storage.
Acknowledgments
The authors are grateful to Project Coordinator (Sesame & Niger), All India Coordinated Research Project on Sesame and Niger, ICAR authors would also like thank to the Junagadh Agricultural University for cooperation and provided necessary facilities to achieve the desired goals of this research.
Conflict of Interest
We declare that we have no conflict of interest.
References
- Gandhi AP (2009) Simplified process for the production of sesame seed (Sesamum indicum L) butter and its nutritional profile. Asian Journal of Food and Agro-Industry 2(1): 24-27.
- Hansen R (2011) Sesame Profile.
- APEDA A (2018) Processed Food Products Export Development Authority. Ministry of Commerce & Industry, GOI.
- Ranganna S (1979) Manual of analysis of fruit and vegetable products p.7-8.
- Borchani C, Besbes S, Blecker C, Attia H (2010) Chemical characteristics and oxidative stability of sesame seed, sesame paste and olive oils. Journal of Agricultural Science and Technology 12: 585-596.
- Kanu J (2011) Biochemical analysis of black and white sesame seeds from China. American Journal of Biochemistry and Molecular Biology 1(2): 145-157.
- AOAC (2006) Official Methods of Analysis. Association of Official Analytical Chemists. Washington, USA.
- Food and Agriculture Organization of the United Nations (2017). FAOSTAT database.

Top Editors
-

Mark E Smith
Bio chemistry
University of Texas Medical Branch, USA -

Lawrence A Presley
Department of Criminal Justice
Liberty University, USA -

Thomas W Miller
Department of Psychiatry
University of Kentucky, USA -

Gjumrakch Aliev
Department of Medicine
Gally International Biomedical Research & Consulting LLC, USA -

Christopher Bryant
Department of Urbanisation and Agricultural
Montreal university, USA -

Robert William Frare
Oral & Maxillofacial Pathology
New York University, USA -

Rudolph Modesto Navari
Gastroenterology and Hepatology
University of Alabama, UK -

Andrew Hague
Department of Medicine
Universities of Bradford, UK -

George Gregory Buttigieg
Maltese College of Obstetrics and Gynaecology, Europe -

Chen-Hsiung Yeh
Oncology
Circulogene Theranostics, England -
.png)
Emilio Bucio-Carrillo
Radiation Chemistry
National University of Mexico, USA -
.jpg)
Casey J Grenier
Analytical Chemistry
Wentworth Institute of Technology, USA -
Hany Atalah
Minimally Invasive Surgery
Mercer University school of Medicine, USA -

Abu-Hussein Muhamad
Pediatric Dentistry
University of Athens , Greece

The annual scholar awards from Lupine Publishers honor a selected number Read More...


