Lupine Publishers Group
Lupine Publishers
Menu
ISSN: 2638-6070
Research Article(ISSN: 2638-6070) 
Comprehensive Analytical Study of Consciousness Energy Treatment on Tocopherol Using GC-MS LC-MS FT-IR UV-Vis and NMR Spectroscopy
Volume 2 - Issue 5Mahendra Kumar T1 and Snehasis J2*
- 1Trivedi Global, Inc., Henderson, USA
- 2Trivedi Science Research Laboratory Pvt. Ltd., India
Received: March 04, 2020; Published: March 12, 2020
*Corresponding author: Snehasis J, Trivedi Science Research Laboratory Pvt. Ltd., Maharashtra, India
DOI: 10.32474/SJFN.2020.02.000148
Abstract
Alpha-tocopherol is the biologically active and abundant form of vitamin E found in mammalian tissues. Some of the major issues associated with tocopherol is solubility in solvents, sensitivity to oxidizing agents and air, critical storage conditions, and the absorption and efficiency in the body are widely variable. Therefore, the current study was designed to investigate the impact of the Trivedi Effect®-Consciousness Energy Treatment on the isotopic abundance ratios (PM+1/PM and PM+2/PM) and structural properties of tocopherol using LC-MS, GC-MS, FT-IR, UV-vis, and NMR spectroscopy. The Tocopherol sample was divided into two parts. One part of the sample was termed as the untreated/control sample, while the other part of the sample received the Trivedi Effect®-Biofield Energy Treatment remotely for ~3 minutes Mr. Mahendra Kumar Trivedi, who was located in the USA, while the test samples were located in the research laboratory in India. The Treated sample was designated as the Biofield Energy Treated sample. The LC-ESI-MS analysis of both the samples showed the mass of protonated parent molecular ion at m/z 431.3 (calcd for C29H51O2 +, 431.39) at the retention time 21.7 minutes. The relative peak intensities of the Treated sample were significantly improved compared to the Control sample. The isotopic abundance ratios of PM+1/PM (2H/1H or 13C/12C or 17O/16O) and PM+2/PM (18O/16O) were significantly increased by 12.63% and 36.18%, respectively in the Treated tocopherol compared to the Control sample. Thus, 2H, 13C, 17O, and 33S contributions from C29H51O2 + to the isotopic m/z 432.4 and 18O contribution to the isotopic m/z 433.4 was significantly increased in the Treated sample compared with the Control sample. The GC-MS chromatographic peak area of the Biofield Energy Treated tocopherol (40229717.47) was significantly increased by 8.41% compared to the Control sample (37109379.65). The FTIR, UV-Vis, 1H and 13C NMR spectroscopic structural analysis showed that the structure of the Biofield Energy Treated sample was similar to the Control sample. The increased mass peak intensities, isotopic abundance ratios and the peak area of the Biofield Energy Treated tocopherol might be influenced by the Trivedi Effect®-Consciousness Energy Treatment via the possible mediation of neutrinos. Thus, the Trivedi Effect® Treated tocopherol might be advantageous for designing better nutraceuticals, dietary supplements and or /pharmaceutical formulations which might provide better therapeutic responses against vitamin E deficiency, spinocerebellar ataxia, myopathies, peripheral neuropathy, retinopathy, skeletal myopathy, impairment of the immune response, red blood cell destruction, cancer, inflammations, cataracts, coronary heart disease, oxidative stress induced pre-eclampsia, Alzheimer’s, Parkinson’s, and other degenerative diseases, onset and progression of age-related macular degeneration (AMD), etc.
Keywords: Tocopherol; The Trivedi Effect®; Energy of Consciousness Treatment; Chromatography; Spectroscopy; Peak Area; Peak intensity; Isotopic Abundance
Introduction
Tocopherols are the family of vitamin E compounds naturally found in leafy green vegetables, vegetable oils, fish, nuts. Eight different forms of vitamin E exists naturally are four tocopherols and four tocotrienols. The α- (alpha), β- (beta), γ- (gamma) and δ- (delta) forms of tocopherols and tocotrienols occur depend upon the number and position of methyl groups on the chromanol ring [1]. Alpha (α)-tocopherol, the fully methylated tocopherol (Figure 1), is the most biologically active and abundant of all the components of vitamin E found in mammalian tissues [2]. The biological function of α-tocopherol is more interesting on membrane-resident proteins and enzymes, gene expression, and signaling cascades. It may be related to its contribution to membrane structure and dynamics, and thus modulation of membrane dependent signaling mechanisms such as protein and lipid kinases [3]. Vitamin E is used mainly as an antioxidant in preparations containing fat (ointments, creams, parentrals, oils, etc.) and cosmetics [4]. In combination with other antioxidants, such as zinc and vitamin C, vitamin E indicates a protective against the onset and progression of agerelated macular degeneration (AMD) [5]. It is also involved in the regulation of the production of eicosanoids by inhibition of both phospholipases A2 (PLA2) and cyclooxygenase (COX) activities. It has been used to slow down the progression of cataracts, coronary heart disease, oxidative stress leading to pre-eclampsia, Alzheimer’s and Parkinson’s, and other degenerative diseases [6-10]. The combined α and γ tocopherol supplements may be considered in prostate and other cancer prevention [11]. Deficiency of tocopherol can cause spinocerebellar ataxia [12], myopathies [13], peripheral neuropathy, ataxia, skeletal myopathy, retinopathy, impairment of the immune response [14], red blood cell destruction [15], etc. Chronic use of high doses of tocopherol may cause nausea, diarrhea, or vision deficiencies [16]. Some of the major issues associated with tocopherol is the solubility in solvents, high sensitivity to oxidizing agents, turning dark on exposure to air, critical storage conditions, and the absorption and efficiency in the body are widely variable [17,18]. The Trivedi Effect®-Energy of Consciousness Treatment has significantly influenced the bioavailability of poorly bioavailable compounds (i.e., resveratrol, berberine, and 25-hydroxyvitamin D3 in Male Sprague-Dawley rats) [15-17] and altered the physicochemical and thermal properties of many pharmaceutical/ nutraceutical compounds [19-25]. The Trivedi Effect® is natural and the only scientifically proven phenomenon in which a person can harness this inherently intelligent energy from the universe and transmit it anywhere on the planet [26]. Biofield Energy is the electromagnetic field exist around the human body [27,28]. Biofield based Energy Therapies are also used against various human disease conditions and accepted worldwide [27-29] and have been recognized as a Complementary and Alternative Medicine (CAM) health care approach by National Center of Complementary and Integrative Health (NCCIH) along with other therapies, medicines and practices such as Ayurvedic medicine, traditional Chinese herbs and medicines, yoga, aromatherapy, homeopathy, Qi Gong, Tai Chi, chiropractic/osteopathic manipulation, meditation, acupuncture, acupressure, naturopathy, Reiki, hypnotherapy, healing touch, movement therapy, cranial sacral therapy, etc. [30,31]. The Trivedi Effect®-Consciousness Energy Treatment (Biofield Energy Treatment) also has the surprising ability to alter the characteristic properties of metals and ceramics [32, 33], organic compounds [34, 35], crops [36, 37], microbes [38,39], etc. The Trivedi Effect®, assumed to act through the possible mediation of neutrinos [26], has also altered the isotopic abundance ratio of some of the organic compounds [34,35]. A study on the natural stable isotope is required to understand the isotope kinetic effects resulting from the alterations of the isotopic composition, which have many applications in different fields of sciences [40-42]. Highly sophisticated analytical techniques such as Gas chromatography – mass spectrometry (GC-MS) and liquid chromatography – mass spectrometry (LC-MS) are widely used for the study of isotopic abundance ratio analysis with sufficient precision [41]. Therefore, a study has been performed to determine the impact of the Trivedi Effect®-Consciousness Energy Treatment on the isotopic abundance ratios of PM+1/PM (2H/1H or 13C/12C or 17O/16O), and PM+2/PM (18O/16O) along with structural properties of tocopherol using LC-MS, GC-MS, Fourier transform infrared (FT-IR) spectrometry, ultraviolet-visible (UV-vis), and NMR (Nuclear Magnetic Resonance) spectroscopy.
Materials and Methods
Chemicals and reagents
D/L-alpha-tocopherol (99.30%), a clear yellow/brown viscous oil was purchased from Alfa Aesar, India, and the other chemicals used in the experiment were of analytical grade also available in India.
Consciousness energy healing treatment strategies
The tocopherol test sample was equally divided into two parts. One part of tocopherol was termed as the Biofield Energy Treated sample, which received the Consciousness Energy Treatment (the Trivedi Effect®) remotely under the standard laboratory conditions for ~3 minutes by Mr. Mahendra Kumar Trivedi, who was located in the USA, while the test samples were located in the research laboratory in India. The other part of the test sample was termed as the Control/untreated sample, which did not receive the Trivedi Effect®-Consciousness Energy Treatment but was subjected to a “sham” healer under similar laboratory conditions. The “sham” healer did not have any knowledge about the Biofield Energy Treatment. The Control/untreated and the Biofield Energy Treated tocopherol samples were kept in similar sealed conditions and further analyzed by using GC-MS, LC-MS, FT-IR, UV-Vis, and NMR analytical techniques.
Characterization
Liquid chromatography-mass spectrometry (Lc-Ms) analysis and calculation of isotopic abundance ratio
The LC-MS analysis of the Control and the Biofield Energy Treated tocopherol was performed using LC-Dionex Ultimate 3000, MS-TSQ Endura (USA) equipped with a photo-diode array (PDA) detector connected with a triple-stage quadrupole mass spectrometer (Thermo Scientific TSQ Endura, USA) with a Thermo Scientific Ion Max NG source and atmospheric pressure chemical ionization (APCI). The analysis was performed on a reversed phase Zorbax SB-C18 100 × 4.6mm, 3.5μm in gradient mode in the liquid chromatograph. The mobile phase was 2mM ammonium formate and 0.5% formic acid in water (mobile phase A), and acetonitrile at a constant flow rate of 0.6mL/min (mobile phase B). The column temperature was kept constant at 40 ˚C. The injection volume was 10μL and the total run time was 30 minutes. Chromatographic separation was achieved using a gradient condition as follow: 0min- 50%B, 5min-90%B, 10min-100%B, 20min-100%B, 25min-50%B, and 30min-50%B. Peaks were monitored using the PDA detector. The mass spectrometric analysis was performed under the +ve ESI mode. The total ion chromatogram peak area% and mass spectrum of the individual peak which appeared in LC, along with the full scan, were recorded. The mass peak intensities of the mass spectrum of the individual peak were recorded. The natural abundance of the C, O, and H isotopes can be predicted from the comparison of the relative abundance of the isotope peak with respect to the base peak. The values of the natural isotopic abundance of the common elements were obtained from the literature [42-45]. The isotopic abundance ratios (PM+1/PM and PM+2/PM) for the Control and the Biofield Energy Treated tocopherol were calculated. % change in isotopic abundance ratio of the Treated tocopherol = [(IARTreated – IARControl)/ IARControl) x 100] Where, IARTreated: isotopic abundance ratio in the Treated tocopherol and IARControl: isotopic abundance ratio in the Control tocopherol.
Gas chromatography-mass spectrometry (GC-MS) analysis
The GC-MS analysis of the Control and the Biofield Energy Treated tocopherol was performed using Agilent 7890B with 5977B Mass selective detector, USA [46]. Gas chromatograph equipped with a silica capillary column HP-5 MS (30m x 0.25mm x 0.25μm) and coupled to the quadrupole detector with pre-filter. The mass spectrometer was operated in an electron ionization (EI) positive mode at the electron ionization energy of 70eV. The oven temperature was programmed from 50 °C (1 min hold) to 150 °C@20 °C/min to 200 °C (6min hold) @25 °C/min to 280 °C@20 °C/min (12min hold). Temperatures of the injector, detector (FID), auxiliary, ion source, and quadrupole detector were 230, 250, 280, 230, and 150 °C. The tocopherol was dissolved in methanol (5mg/ mL), and 5.0μL was splitlessly injected with helium as a carrier gas with a flow rate of 2.0mL/min. Mass spectra were scanned from m/z 40 to 1050 at a stability of ± 0.1m/z mass accuracy over 48 hours and mass peak intensities of the mass spectrum of the individual peak were recorded.
Percent change in peak intensity (I) was calculated using following equations:

Where, IControl and ITreated are the peak intensity of the Control and Biofield Energy Treated samples of tocopherol, respectively.
Fourier transform infrared (FT-IR) spectroscopy
The FT-IR spectroscopy was recorded on the Spectrum ES (Perkin Elmer, USA) Fourier transform infrared spectrometer with the frequency array of 400-4000cm-1. The compound was run as NaCl disks in mull method (2mg of Control/Biofield Energy Treated sample in 2 drops of chloroform).
Ultraviolet-visible pectroscopy (UV-Vis) analysis
The UV-Vis spectral analysis of the tocopherol was carried out using a Shimadzu UV-2400PC series (Japan). The absorbance spectra with the wavelength of maximum absorbance (λ max) were recorded.
Nuclear magnetic resonance (NMR) analysis
1H NMR spectra of tocopherol were recorded at 400MHz on Agilent-MRDD2 FT-NMR. Approximately 3mg of the sample was dissolved in DMSO-d6. Chemical shifts (d) were in parts per million (pPM) relative to the solvent’s residual proton chemical shift {(CD3)2SO, δ = 2.5}. 1H NMR multiplicities were designated as singlet (s), doublet (d), doublet of doublet (dd), triplet (t), quartet (q), multiplet (m), broad (br), apparent (app). Similarly, 13C NMR spectra of tocopherol were measured at 100 MHz on Agilent-MRDD2 FT-NMR spectrometer at room temperature. Approximately 25mg of the sample was dissolved in DMSO-d6. Chemical shifts (d) were in parts per million (pPM) relative to the solvent’s residual carbon chemical shift {(CD3)2SO, δ = 39.52}.
Results and Discussion
Liquid chromatography-mass spectrometry (Lc-Ms) analysis
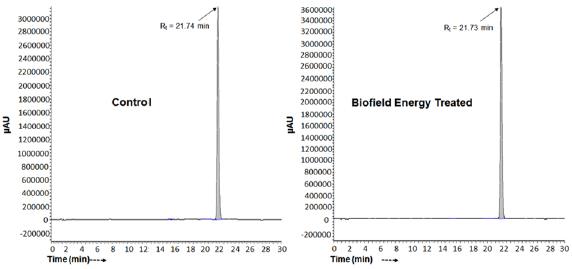
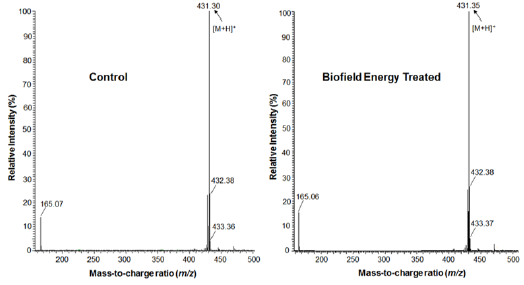
The Control and the Biofield Energy Treated samples of tocopherol showed the chromatographic peak at retention times (Rt) 21.7 minutes (Figure 2). The peak area% of the Control and the Biofield Energy Treated tocopherol at Rt 21.7 minutes was 99.2% in both the cases. This indicated that the polarity of both the samples remained similar. The LC-ESI-MS spectra exhibited the protonated molecular ion peak (Figure 3) of tocopherol at m/z 431.30 in the Control and 431.35 in the Biofield Energy Treated sample (calcd for C29H51O2 +, 431.39). The isotopic peaks were observed at m/z 432.4 (M+1) and 433.4 (M+2) in both the spectra. The parent mass peak at m/z 431.3 was the base peak with 100% relative peak intensity in case of both the spectra (Figure 3). But, the relative peak intensities of the isotopic peaks in the Treated tocopherol were significantly altered compared to the Control sample.
Figure 3: The ESI-MS spectra of the Control and Biofield Energy Treated tocopherol at Rt 21.7 minutes in the chromatograms.
Isotopic abundance ratio analysis
The Control and the Biofield Energy Treated samples of tocopherol showed the mass of protonated molecular ion at m/z 431.3 (calcd for C29H51O2 +, 431.39) with 100% relative abundance in the spectra. The theoretical calculation of isotopic peak PM+1 for the protonated tocopherol presented below:
P (13C) = [(29 x 1.1%) x 100% (the actual size of the M+ peak)] / 100% = 31.90%
P (2H) = [(51 x 0.015%) x 100%] / 100% = 0.77%
P (17O) = [(2 x 0.04%) x 100%] / 100% = 0.08%
PM+1 i. e.13C, 2H, and 17O contributions from C29H51O2 + to m/z 432.4 = 32.75%
Similarly, the theoretical calculation of isotopic peak PM+2 for the protonated tocopherol is presented below:
P (18O) = [(1 x 0.20%) x 100%] / 100% = 0.2%
PM+2 of 18O contribution from C29H51O2 + to m/z 433.4 = 0.2%
The calculated isotopic abundance of PM+1 value 32.75% was higher to the observed value (23.75%). But, the calculated PM+2 value 0.2% was lower to the observed value (3.87%) (Table 1). The probability of A + 1 and A + 2 elements having an isotope with one and two mass units heavier, respectively than the most abundant isotope (i.e.,13C,17O, and 18O) contributes to the mass of the isotopic molecular ion [M+1]+ and [M+2]+. 2H did not contribute to any isotopic m/z ratios of tocopherol because of its less natural abundance compared to the abundances of C and O isotopes [47-50]. But, the contributions of 13C, 17O, and 18O was major from tocopherol to the isotopic mass peak at m/z 432.4 and 433.4 confirmed from the calculations.
The percentage change in the isotopic abundance ratios (PM+1/ PM and PM+2/PM) in the Biofield Energy Treated tocopherol was calculated compared to the Control sample (Table 1). The isotopic abundance ratio of PM+1/PM (2H/1H or 13C/12C or 17O/16O) in the Biofield Energy Treated tocopherol was significantly increased by 12.63% compared to the Control sample (Table 1). This indicated that the 2H, 13C, 17O, and 33S contributions from C29H51O2 + to the isotopic m/z 432.4 in the Biofield Energy Treated tocopherol sample was significantly increased compared to the Control sample. Similarly, the isotopic abundance ratio of PM+2/PM (18O/16O) in the Biofield Energy Treated tocopherol also significantly increased by 36.18% compared to the Control sample (Table 1). Therefore, the 18O contribution from C29H51O2 + to the isotopic m/z 433.4 in the Biofield Energy Treated tocopherol was significantly increased compared to the Control sample. Based on the results, it can be assumed that the Trivedi Effect®-Consciousness Energy Treatment might provide the necessary energy for the neutrino oscillations that lead to the alteration of the isotopic abundance ratio of tocopherol. The neutrino is an electrically neutral elementary particle with very small mass that interacts only via the weak subatomic force and gravity [51,52]. The discovery neutrino oscillations seem to give credence to the postulates on effect on the atomic weight and charge by the Trivedi Effect® [26]. The alteration in isotopic abundance ratio may affect the kinetic isotope effects of the atoms/molecules. It is very useful to study the reaction mechanism, understand the enzymatic transition state, and the mechanism that is supportive for designing effective and specific inhibitors, etc. [42]. Therefore, the Biofield Energy Treated tocopherol with improved isotopic abundance ratio (PM+1/PM and PM+2/PM) was assumed to be more advantageous for the designing of better nutraceutical/pharmaceutical formulations.
Table 1: LC-ESI-MS isotopic abundance ratio analysis of Control and the Biofield Energy Treated tocopherol.

PM = the relative peak intensity of the parent molecular ion M +; PM+1 = the relative peak intensity of the isotopic molecular ion [M+1]+, PM+2 = the relative peak intensity of the isotopic molecular ion [M+2]+, and M = mass of the parent tocopherol molecule.
Gas Chromatography-mass spectrometry (GC-MS) analysis
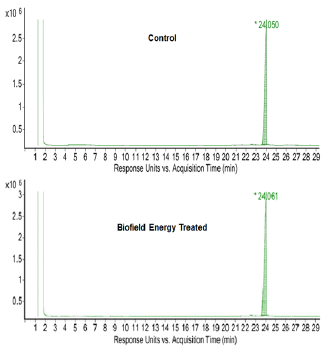
The GC-MS chromatograms of tocopherol showed the single chromatographic peaks in the case of both the Control, and the Biofield Energy Treated samples at 24.1 minutes (Figure 4). It indicated that the polarity of the Biofield Energy Treated tocopherol remained similar compared to the Control sample. But, the GC chromatographic peak area of the Biofield Energy Treated tocopherol (40229717.47) was significantly increased by 8.41% compared to the Control sample (37109379.65) (Table 2). This indicated that the solubility of the Biofield Energy Treated tocopherol was increased compared to the Control sample. The GCMS spectra of the Control and the Biofield Energy Treated tocopherol at Rt of 24.1 minutes exhibited the presence of the molecular ion at m/z 430.5 (calcd for C29H51O2 +, 430.38) along with other lower mass fragmentation peaks (Figure 5). The GC-MS fragmentation pattern and mass peak intensities of the Biofield Energy Treated tocopherol were very close compared to the Control sample (Figure 5 & Table 2). The increased peak area of the Biofield Energy Treated tocopherol is assumed to be the influence of Consciousness Energy Treatment (the Trivedi Effect®).
Figure 5: GC-MS spectra of the Control and the Biofield Energy Treated tocopherol at Rt 24.1 minutes.
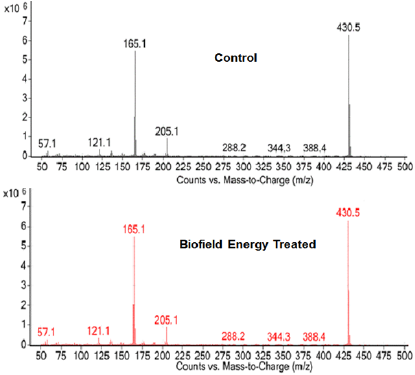
Table 2: GC-MS chromatographic peak area and mass peak intensities analysis at Rt 24.1 minutes of the Control and the Biofield Energy Treated tocopherol.

Fourier transform infrared (FT-IR) spectroscopy
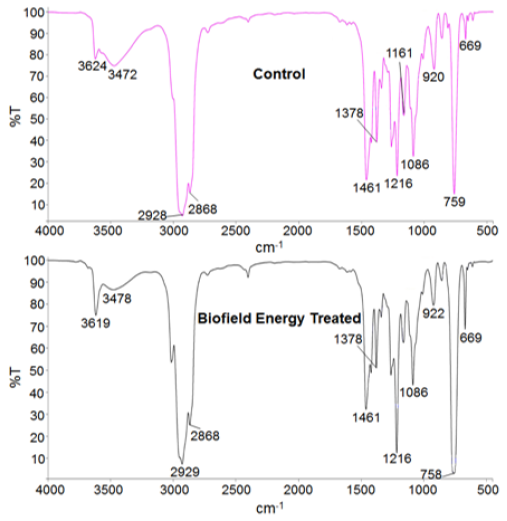
The Control and the Biofield Energy Treated tocopherol samples were investigated by FT-IR spectroscopy (Figure 6). The FT-IR spectra of both the Control and the Biofield Energy Treated Tocopherol showed the clear stretching and bending peak in the functional group and fingerprint region. The broad peak in the functional group region at 3472cm-1 in the Control and 3478cm-1 in the Biofield Energy Treated spectrum was due to O-H stretching. The spectra showed aliphatic C-H stretching at 2929, and 2868cm- 1 for both the Control and the Biofield Energy Treated samples of tocopherol. The aromatic C=C and aliphatic C-O-C stretching frequency were observed at 1460cm-1 and 1085 cm-1, respectively for both the Control and the Biofield Energy Treated samples of tocopherol. The fingerprint region of the Biofield Energy Treated tocopherol also remained the same compared to the Control sample. The FT-IR spectra did not display any changes in the vibrational frequencies. Overall, there was no alteration in the structural properties observed in the Biofield Energy Treated tocopherol as compared to the Control sample. The detailed experimental vibrational spectra of tocopherol were similar to that of earlier reported literature [53]. Since both the spectra have very similar IR bands of tocopherol, it is indicated that there was no significant alteration in the structural properties of the Biofield Energy Treated sample compared to the Control sample.
Ultraviolet-visible spectroscopy (UV-Vis) analysis
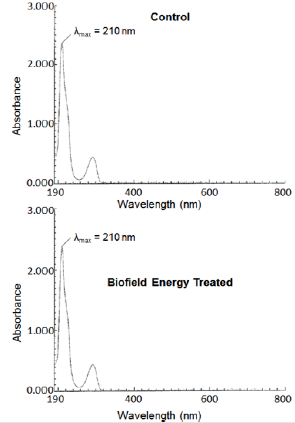
The UV-visible spectra of the Control and the Biofield Energy Treated tocopherol are shown in Figure 7. The Control and the Biofield Energy Treated samples showed the maximum absorbance at 210nm (λ max). The experimental data were closely match to the published literature data. The peak at 210nm showed a minor shift of absorbance maxima from 2.3716 in the Control to 2.3827 in the Biofield Energy Treated sample. The analysis revealed that the electronic transitions between the highest occupied molecular orbital and lowest unoccupied molecular orbital remained same in the Control and the Biofield Energy Treated tocopherol samples.
Nuclear magnetic resonance (NMR) spectroscopy analysis
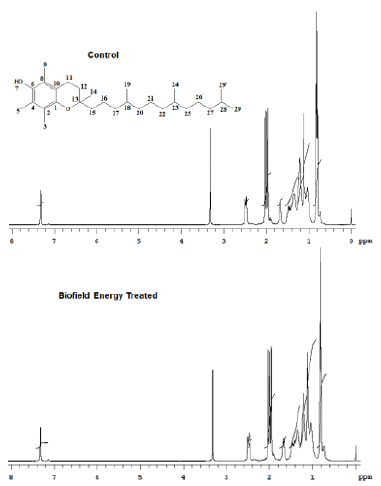
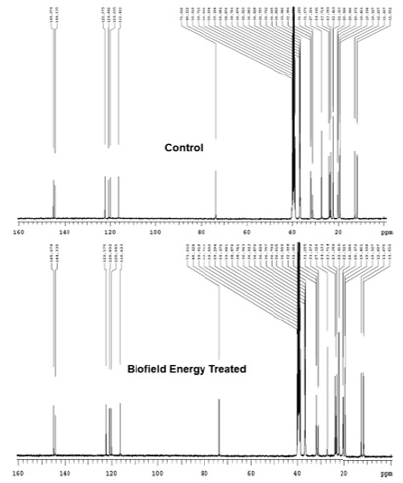
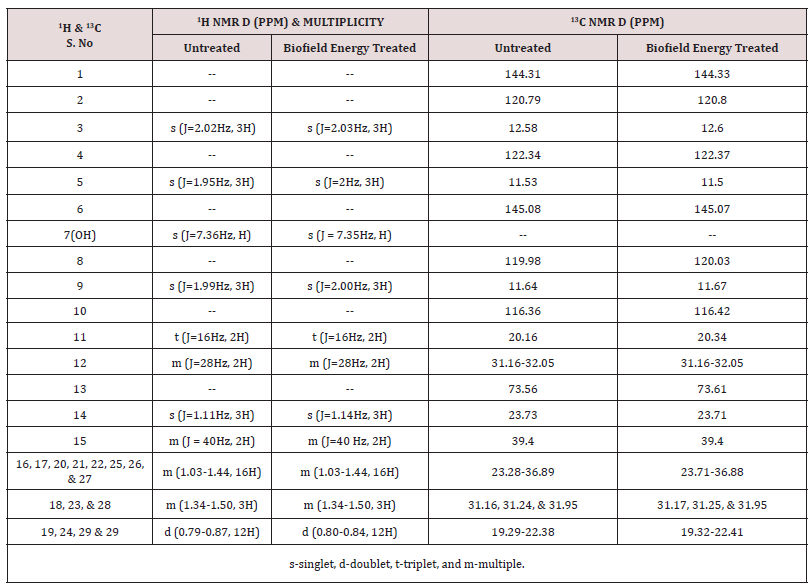
The 1H NMR spectra of the Control and the Biofield Energy Treated tocopherol are shown in Figure 8. The signals for the proton coupling of CH3, CH2, CH, and OH protons in both the 1H NMR spectra of tocopherol were in the range of δ 0.8 to 7.4pPM (Figure 8 and Table 3). The 1H signals for the Control and the Biofield Energy Treated tocopherol were close to each other. Correspondingly, 13C NMR spectra of the Control and the Biofield Energy Treated tocopherol are shown in Figure 9. The carbon signals for CH3, CH2, CH, =C<, and C-OH groups in both the Control and the Biofield Energy Treated NMR spectra were in the range of 11.5-145.1 (Figure 9 and Table 3). The 13C signals for the Control and the Biofield Energy Treated tocopherol were close to each other. The experimental data were closely matched to the published literature. The NMR spectral data indicated that structure of the Biofield Energy Treated tocopherol did not alter compared to the Control sample.
Conclusion
Overall experimental results revealed that the Trivedi Effect®- Consciousness Energy Treatment (Biofield Energy Treatment) showed a significant impact on the mass peak intensities, isotopic abundance ratios and the peak area of tocopherol. The LC-ESIMS analysis of both the samples showed the mass of protonated parent molecular ion at m/z 431.3 (calcd for C29H51O2 +, 431.39) at the retention time 21.7 minutes. The relative peak intensities of the Biofield Energy Treated sample were significantly improved compared to the Control sample. The isotopic abundance ratios of PM+1/PM (2H/1H or 13C/12C or 17O/16O) and PM+2/PM (18O/16O) were significantly increased by 12.63% and 36.18%, respectively in the Biofield Energy Treated tocopherol compared to the Control sample. Thus, 2H, 13C, 17O, and 33S contributions from C29H51O2 + to the isotopic m/z 432.4 and 18O contribution to the isotopic m/z 433.4 were significantly increased in the Biofield Energy Treated sample compared with the Control sample. The GC-MS chromatographic peak area of the Biofield Energy Treated tocopherol (40229717.47) was significantly increased by 8.41% compared to the Control sample (37109379.65). The increased mass peak intensities, isotopic abundance ratios and the peak area of the Biofield Energy Treated tocopherol might be influenced by the Trivedi Effect®- Consciousness Energy Treatment via the possible mediation of neutrinos. Thus, the Trivedi Effect® Treated tocopherol could be advantageous for designing better nutraceuticals, dietary supplements and/or pharmaceutical formulations which might provide better therapeutic responses against vitamin E deficiency, spinocerebellar ataxia, myopathies, peripheral neuropathy, skeletal myopathy, retinopathy, impairment of the immune response, red blood cell destruction, cancer, inflammations, cataracts, coronary heart disease, oxidative stress induced pre-eclampsia, Alzheimer’s, Parkinson’s, and other degenerative diseases, onset and progression of age-related macular degeneration (AMD), etc. Similarly, the Biofield Energy Treated tocopherol could be used as a better antioxidant in food, pharmaceutical, and nutraceutical preparations containing fat (ointments, creams, oils, etc.) and cosmetics.
Acknowledgement
The authors are grateful to GVK Biosciences Pvt. Ltd., Trivedi Science, Trivedi Global, Inc., and Trivedi Master Wellness for their assistance and support during this work.
References
- Bauernfeind J (1980) In: Machlin LJ (Ed.), Vitamin E: A Comprehensive Treatise, Marcel Dekker, New York pp. 99.
- Wilson GJ, Lin CY, Webster RD (2006) Significant differences in the electrochemical behavior of the α-, β-, γ- and δ- tocopherols (vitamin E). J Phys Chem B 110(23): 11540-11548.
- Jeffrey A, Thad H, Stephen RW, William S, John K (2010) The location and behavior of α-tocopherol in membranes. Molecular nutrition & food research 54(5): 641-651.
- Beniamino P, Glauco G, Gaspare P (1995) Vitamine E added silicone gel sheets for treatment of hypertrophic scars and keloids. Int J Dermatol 34(7): 506-509.
- Van Leeuwen R, Boekhoorn S, Vingerling JR, Witteman JC, Klaver CC, et al. (2005) Dietary intake of antioxidants and risk of age-related macular degeneration. JAMA 294(24): 3101-3107.
- McNeil J, Robman L, Tikellis G, Sinclair MI, McCarty CA, et al. (2004) Vitamin E supplementation and cataract: Randomized controlled trial. Ophthalmology111(1): 75-84.
- Sesso HD, Buring JE, Christen WG, Kurth T, Belanger C, et al. (2008) Vitamins E and C in the prevention of cardiovascular disease in men: The physicians' health study II randomized controlled trial. JAMA 300(18): 2123-2133.
- Rumbold AR, Crowther CA, Haslam RR, Dekker GA, Robinson JS (2006) Vitamins C and E and the risks of preeclampsia and perinatal complications. N Engl J Med 354(17): 1796-806.
- Takeda AAS, dos Santos J, Marcussi S, Silveira LB, Soares AM, et al. (2004) Crystallization and preliminary X-ray diffraction analysis of an acidic phospholipase A2 complexed with p-bromophenacyl bromide and α-tocopherol inhibitors at 1.9- and 1.45-Å Biochimica et Biophysica Acta 1699(1-2): 281-284.
- Bradford F, Sanjay G (2005) A review of antioxidants and Alzheimer's disease. Ann Clin Psychiatry 17(4): 269-286.
- Bradford F, Sanjay G (2005) A review of antioxidants and Alzheimer's disease. Ann Clin Psychiatry 17(4): 269-286.
- Traber MG, Atkinson J (2007) Vitamin E, antioxidant and nothing more. Free Radic Biol Med 43(1): 4-15.
- Brigelius Flohé R, Traber MG (1999) Vitamin E: Function and metabolism. FASEB J 13(10): 1145-1155.
- Kowdley KV, Mason JB, Meydani SN, Cornwall S, Grand RJ (1992) Vitamin E deficiency and impaired cellular immunity related to intestinal fat malabsorption. Gastroenterology 102(6): 2139-2142.
- Ellie W, Rolfes SR (2011) Peggy Williams, (Ed.), Understanding Nutrition (12th). California: Wadsworth, Cengage Learning, USA.
- https://www.drugs.com/npp/vitamin-e.html. Retrieved 09 December 2019.
- http://www.brenntag.com/media/documents/bsi/product_data_sheets/life_science/basf_vitamins/basf_vitamin_e_dl-alpha-tocopherol_pds.pdf.
- Borel P, Preveraud D, Desmarchelier C (2013) Bioavailability of vitamin E in humans: An update. Nutr Rev 71(6): 319-331.
- Branton A, Jana S (2017) The influence of energy of consciousness healing treatment on low bioavailable resveratrol in male Sprague Dawley International Journal of Clinical and DeveloPMental Anatomy 3(3): 9-15.
- Branton A, Jana S (2017) The use of novel and unique biofield energy healing treatment for the improvement of poorly bioavailable compound, berberine in male Sprague Dawley American Journal of Clinical and Experimental Medicine 5(4): 138-144.
- Branton A, Jana S (2017) Effect of the biofield energy healing treatment on the pharmacokinetics of 25-hydroxyvitamin D3 [25(OH)D3] in rats after a single oral dose of vitamin D3. American Journal of Pharmacology and Phytotherapy 2(1): 11-18.
- Trivedi MK, Branton A, Trivedi D, Nayak G, Ellis MP, et al. (2017) Effect of the energy of consciousness (The Trivedi Effect®) on physicochemical, thermal, structural, and behavioral properties of magnesium gluconate. Chemical and Biomolecular Engineering 2(2): 113-123.
- Trivedi MK, Branton A, Trivedi D, Nayak G, Nykvist CD, et al. (2017) Evaluation of the Trivedi Effect®- Energy of Consciousness Energy Healing Treatment on the physical, spectral, and thermal properties of zinc chloride. American Journal of Life Sciences 5(1): 11-20.
- Trivedi MK, Branton A, Trivedi D, Shettigar H, Bairwa K, et al. (2015) Fourier Transform Infrared and Ultraviolet-Visible Spectroscopic Characterization of Biofield Treated Salicylic Acid and Sparfloxacin. Nat Prod Chem Res 3(5): 186.
- Trivedi MK, Patil S, Shettigar H, Bairwa K, Jana S (2015) Spectroscopic characterization of biofield treated metronidazole and tinidazole. Med chem 5(7): 340-344.
- Trivedi MK, Mohan TRR (2016) Biofield energy signals, energy transmission and neutrinos. American Journal of Modern Physics 5(6): 172-176.
- Rubik B, Muehsam D, Hammerschlag R, Jain S (2015) Biofield science and healing: history, terminology, and concepts. Glob Adv Health Med 4: 8-14.
- Warber SL, Cornelio D, Straughn, J, Kile G (2004) Biofield energy healing from the inside. J Altern Complement Med 10(6): 1107-1113.
- Movaffaghi Z, Farsi M (2009) Biofield therapies: Biophysical basis and biological regulations? Complement Ther Clin Pr 15(1): 35-37.
- Barnes PM, Bloom B, Nahin RL (2008) Complementary and alternative medicine use among adults and children: United States, 2007. Natl Health Stat Report 12: 1-23.
- Koithan M (2009) Introducing complementary and alternative therapies. J Nurse Pract 5(1): 18-20.
- Trivedi MK, Patil S, Tallapragada RM(2013) Effect of biofield treatment on the physical and thermal characteristics of Silicon, Tin and Lead powders. J Material Sci Eng 2(3):125.
- Trivedi MK, Patil S, Tallapragada RM (2013) Effect of Bio Field Treatment on the Physical and Thermal Characteristics of Vanadium Pentoxide Powders. J Material Sci Eng S11:001.
- Trivedi MK, Branton A, Trivedi D, Nayak G, Bairwa K, et al. (2015) Impact of Biofield Treatment on Spectroscopic and Physicochemical Properties of p-Nitroaniline. Insights in Analytical Electrochemistry 1: 1-8.
- Trivedi MK, Branton A, Trivedi D, Nayak G, Latiyal O, et al. (2015) Evaluation of Biofield Treatment on Atomic and Thermal Properties of Ethanol. Organic Chem Curr Res 4:145.
- Trivedi MK, Branton A, Trivedi D, Nayak G, Gangwar M, et al. (2015) Agronomic characteristics, growth analysis, and yield response of biofield treated mustard, cowpea, horse gram, and groundnuts. International Journal of Genetics and Genomics 3(6): 74-80.
- Trivedi MK, Branton A, Trivedi D, Nayak G, Mondal SC, et al. (2015) Evaluation of plant growth, yield and yield attributes of biofield energy treated mustard (Brassica juncea) and chickpea (Cicer Arietinum) Seeds. Agriculture, Forestry and Fisheries 4(6): 291-295.
- Trivedi MK, Branton A, Trivedi D, Nayak G, Mondal SC, et al. (2015) Antimicrobial sensitivity, biochemical characteristics and biotyping of Staphylococcus saprophyticus: An impact of biofield energy treatment. J Women’s Health Care 4(6): 271.
- Trivedi MK, Branton A, Trivedi D, Nayak G, Shettigar H, et al. (2015) Antibiogram of multidrug-resistant isolates of Staphylococcus saprophyticus after biofield treatment. J Infect Dis Ther 3: 244.
- Schellekens RC, Stellaard F, Woerdenbag HJ, Frijlink HW, Kosterink JG (2011) Applications of stable isotopes in clinical pharmacology. Br J Clin Pharmacol 72(6): 879-897.
- Muccio Z, Jackson GP (2009) Isotope ratio mass spectrometry. Analyst 134(2): 213-222.
- Weisel CP, Park S, Pyo H, Mohan K, Witz G (2003) Use of stable isotopically labeled benzene to evaluate environmental exposures. J Expo Anal Environ Epidemiol 13(5): 393-402.
- Rosman KJR, Taylor PDP (1998) Isotopic compositions of the elements 1997 (Technical Report). Pure Appl Chem 70(1): 217-235.
- Smith RM (2004) Understanding Mass Spectra: A Basic Approach 2nd (), John Wiley & Sons Inc, Canada.
- Jürgen H (2004) Gross Mass Spectrometry: A Textbook 2nd (Edn.), Springer: Berlin, Germany.
- Trivedi MK, Panda P, Sethi KK, Jana S (2017) Metabolite profiling in withania somnifera roots hydroalcoholic extract using LC/MS, GC/MS and NMR spectroscopy. Chem Biodiversity 14(3): e1600280.
- http://www.ionsource.com/Card/Mass/mass.htm.
- https://chem.libretexts.org/Core/Analytical_Chemistry/Instrumental_Analysis/Mass_Spectrometry/Mass_Spectrometry%3A_Isotope_Effects.
- Susanne M (2016) Direct neutrino mass experiments. Journal of Physics: Conference Series 718(2): 022013.
- Nakamura K, Petcov ST (2016) Neutrino mass, mixing, and oscillations. Chin Phys 40: 100001.
- https://www.chemicalbook.com/SpectrumEN_10191-41-0_IR1.htm.
- Giacomelli C, Giacomelli FC, Alves LO, Timbola AK, Spinelli A (2004) Electrochemistry of vitamin E hydro-alcoholic solutions. J Braz Chem Soc 15(5): 748-755.

Top Editors
-

Mark E Smith
Bio chemistry
University of Texas Medical Branch, USA -

Lawrence A Presley
Department of Criminal Justice
Liberty University, USA -

Thomas W Miller
Department of Psychiatry
University of Kentucky, USA -

Gjumrakch Aliev
Department of Medicine
Gally International Biomedical Research & Consulting LLC, USA -

Christopher Bryant
Department of Urbanisation and Agricultural
Montreal university, USA -

Robert William Frare
Oral & Maxillofacial Pathology
New York University, USA -

Rudolph Modesto Navari
Gastroenterology and Hepatology
University of Alabama, UK -

Andrew Hague
Department of Medicine
Universities of Bradford, UK -

George Gregory Buttigieg
Maltese College of Obstetrics and Gynaecology, Europe -

Chen-Hsiung Yeh
Oncology
Circulogene Theranostics, England -
.png)
Emilio Bucio-Carrillo
Radiation Chemistry
National University of Mexico, USA -
.jpg)
Casey J Grenier
Analytical Chemistry
Wentworth Institute of Technology, USA -
Hany Atalah
Minimally Invasive Surgery
Mercer University school of Medicine, USA -

Abu-Hussein Muhamad
Pediatric Dentistry
University of Athens , Greece

The annual scholar awards from Lupine Publishers honor a selected number Read More...


