Lupine Publishers Group
Lupine Publishers
Menu
ISSN: 2638-6070
Research Article(ISSN: 2638-6070) 
A New Approach Against Food Frauds: The Portable Near- Infrared Device for Fish Fillets Identification
Volume 4 - Issue 1Simona Sciuto1*, Giovanna Esposito1*, Luana Dell’Atti1, Francesco Rossi2, Maria Vittoria Riina1, Gabriele Merlo3,Luca Magnani3, Alfredo Benso2, Elena Maria Bozzetta1 and Pier Luigi Acutis1
- 11Istituto Zooprofilattico Sperimentale del Piemonte, Liguria e Valle d’Aosta, Turin, Italy
- 2Politecnico di Torino, Turin, Italy
- 3Esselunga SpA, Biandrate, Italy
Received: May 11, 2021 Published: May 26, 2021
*Corresponding author:Giovanna Esposito, Istituto Zooprofilattico Sperimentale del Piemonte, Liguria e Valle d’Aosta, Turin, Italy
DOI: 10.32474/SJFN.2021.04.000177
Abstract
The demand for analytical methods for fish product authenticity has increased dramatically, particularly in rapid and nondestructive food authentication. Near-infrared (NIR) handheld devices can meet this need for fast, reliable, non-destructive and in situ analysis. Aim of this study was to verify fish fillets species by using a pocket-sized NIR sensor, called SCiO, a handheld NIR spectrometer that can easily scan solid and liquid samples. The species were chosen from among the most commonly sold on the market as fresh. Samples were divided in two groups, one for calibration and one for validation. The first was performed to set up the instrument and the second to cross-validate model performance. The fish species were correctly identified with a global accuracy between 93.97% and 96.58% and were all confirmed by a validated method based on genetic marker. The samples correspond to the declaration, suggesting this method as a good screening approach to avoid fish frauds with good accuracy.
Keywords:Fish Fillets; Species Substitution; NIR; SCiO
Introduction
Fish and seafood are among the top ten commodities considered by European Union legislators as being most at risk for fraud (Report on the food crisis, fraud in the food chain and the control thereof (2013/2091 (INI) of the Committee on the Environment, Public Health and Food Safety). Mislabelling, and seafood species substitution in particular i.e. selling a species different from the one declared on the label, are the most common commercial frauds [1]. To date, Ocean, an international organization, has compiled more than 100 studies on seafood mislabelling and species substitution [2]: mislabelling was found in more than 30% of the species analysed [1,3]. Usually, fraud involves the substitution of a valuable species with a less valuable one, but commercial fraud can have other consequences, especially health implications when toxic or allergenic species are sold, or ecological issues when species illegally labelled as less endangered are actually overexploited [4]. Fish fillet products are more likely to be mislabelled, because they lost most of their species-specific morphological traits [5,6]. Most frequent substitutions are sole with plaice, red snapper with pagri and squid with tattler. Basically, two different methods are used in the identification of fish species: visual identification of morphological characters and DNA analysis. The first is based on subjective and visual control and requires expert personnel, making it unsuitable for authentication of fish fillets; DNA analysis, while highly accurate also for authenticating fillets, is relatively expensive and entails sampling of every fillet, that may then result unsuitable for sale as a whole. Since it is carried out by specialized laboratories, it cannot be employed for large scale rapid analysis. This situation has created the need for a species identification method that is lowcost, preserve the wholeness of the fillet, and is applicable on large scale, both by food producers in the factory and by consumers in stores [7,8]. Near-infrared (NIR) handheld devices can meet the need for fast, reliable, non-destructive, and in situ analyses for food authentication. NIR spectroscopy is a widely applied technique that collects the reflected light of a sample material in the nearinfrared region of the electromagnetic spectrum (from about 700 nm to 2500 nm) influenced by the internal and external chemical composition of the samples and is mainly generated from the stretching and bending of O–H, N–H, and C–H functional groups. Unlike traditional chemical analysis, no reagents are required, and no wastes are produced because no sample preparation is required. Furthermore, it is possible to acquire a lot of samples per days. The technique provides accurate information about the physical and chemical properties of a food sample. It works according to the principle that each type of molecule vibrates in its own unique way and molecular vibrations interact with light to create a unique spectral signature [9-11]. Miniaturisation of NIR instruments began more than a decade ago to reduce cost and weight, as well as to create a market in the non-scientific community. One of the main challenges of downsizing, however, is to maintain a device’s spectral performance in wavelength range and resolution. Recently, miniaturized, relatively inexpensive NIR spectrometers have gained use as an alternative to laboratory-based spectral measurements, since they require minimal equipment and are easy to use. While their resolution is lower than laboratory-based spectrometers, the handheld devices generate more data at reduced cost, coupled with the use of machine learning methods, potentially offsetting this disadvantage. In 2016 Consumer Physics [Israel] launched their first pocket-sized NIR sensor, the SCiO, a handheld NIR spectrometer, that can scan solid and liquid samples and can be easily and safely used even in inexperienced hands. While the quality parameters of fish as measured by NIR spectroscopy have been variously studied [5,12] to the best of our knowledge, species identification with handheld instrumentation has been less reported in the literature [7,13]. The aim of this study was to investigate the accuracy of a handled NIR instrument as a potential tool in food authentication analysis for species identification of fish fillets. The SCiO model tested was the less expensive version, that not allows processing of raw data, because we wanted to evaluate the most basic but also the most affordable and easy to use version of the device. In order to reinforce the obtained results, the fillets were also analysed with an in house validated method based on genetic marker used for official investigation in food fraud. The analyses were obtained by using the mathematical and statistic model supplied by the SCiO instrument. The sample numbers to create a calibration model was 100 samples for species, then the models were tested on an independent data set in order to estimate its predictive ability.
Materials and Methods
Device
The SCiO (Consumer Physics, Tel Aviv, Israel) is a NIR spectrometer that works at wavelengths between 740 and 1070 nm; when paired with a smartphone application (SCiO Developer Toolkit), it leverages a cloud-based database. A drawback is that parameters and settings cannot be modified by the operator. The detector measures attenuated reflectance from the opaque surface of a scanned sample. The SCiO acquires data spectra via the smartphone app and then analyses them by means of a browserbased web app to generate a classification model for analysing the matrix of interest.
Sample collection and spectra acquisition
Nine fish species were selected: Merluccius merluccius (mm), Pollachius virens (ca), Epinephelus costae (ce), Gadus morhua (mn), Pleuronectes platessa (pl), Sebastes norvegicus (sa), Scomber scombrus (sg), Chelidonichthys lucerna (gl) and Synaptura cadenati (so). These species were chosen because they are the most commonly sold on the market as fresh fillets. Two independent sets of samples were formed, one for calibration and one for validation data analysis. The first was used to create the model and the second to cross-validate model performance. For calibration, 100 samples of each species were collected, and each fillet was scanned three times. Fish fillets were. For validation, 50 samples of each species were collected and each fillet was scanned three times. Before starting acquisition, the instrument was calibrated following the instructions of the device.
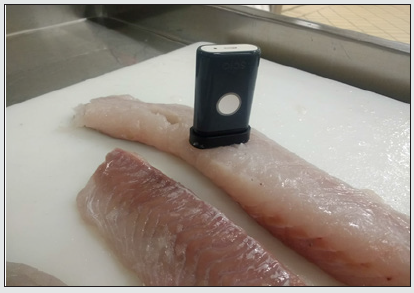
The samples were scanned on a flat bench top, with the device placed over the sample [Figure 1]. Multiple scans of each fillet were performed to increase the accuracy, as recommended in the manufacturer’s manual; scans were acquired at different places on the fillets to take into account possible variations in the portion of the fillet. NIR acquisition was performed directly on site at the Esselunga production and wholesale distribution plant. The scans were acquired on different days and months, from January 2018 to March 2020 in order to have fresh samples from different lots of fish.
Data analysis and results of NIR spectral analysis The data acquired during training were analysed by the four algorithms onboard the instrument. The generated classification models were compared for coefficient of variation [Figure 1]. And matrix of confusion. The four algorithms were: Processed, Normalize, Processed & Normalize, (log) R and Normalize. In detail, Processed assumes that the Lambert-Beer law is valid; the measured signal becomes linear with the concentration via log transformation and the result is adjusted for noise and deviations from the model. Normalize normalizes the signal to compensate for changing measurement conditions (e.g., variation in scanning distances). The Y axis still means reflectance but in normalized units instead of raw reflectance. Processed and Normalize first assumes the Lambert-Beer law (Processed) and then normalizes the results to compensate for differences in the optical path between samples. This is useful, for example, when there is variation in sample thickness. (log) R and Normalize is similar with Processed and Normalized; it uses a more aggressive form of Processed and adds more noise, which may be the only way to create a good model in some cases. Species assignment of each fillet during validation was based on the results of at least two out of three scans. When the SCiO was unable to identify the species of a sample, it gave “undefined” as result. When the device returned “undefined” as a result in two or three out of three scans, the final result was classified as “undefined”. The model accuracy was calculated as the percentage of fillets correctly identified over the total number of fillets scanned, considering or not in the calculation the undefined results.
DNA analysis
1 g of each species was sampled and stored at -20 °C until DNA analysis. Species identification was performed analysing a portion of Cytochrome c oxidase subunit I gene (COI) widely used as genetic marker and comparing the obtained nucleotide sequences with those present on public DNA databases. Genomic DNA was extracted from all samples using a commercial kit (DNeasy Blood & Tissue Kit, Qiagen). COI gene was amplified following the standard protocol described by Ward et al. (2005) and the reaction was run on a Gene Amp PCR System 9700 (Applied Biosystems™). PCR products were sequenced on both strands using Big Dye Terminator Cycle Sequencing Kit v3.1 (ThermoFisher) and analysed by capillary electrophoresis on a 3130 Genetic Analyzer (Applied Biosystems™). For each sample the two sequences were aligned on SeqMan software (DNASTAR package) to obtain a consensus sequence that was compared with those available in GenBank (http://blast.ncbi. nlm.nih.gov/Blast.cgi) and in BOLD (https://www.boldsystems. org/index.php/databases) databases. The previous validation data of the method showed that it is possible assign the species for value of a similarity ≥98%. DNA analysis was performed in all samples used for the calibration data set (n=900) while for validation only in the case of error in sample classification.
Results and Discussion
Figure 2A: Confusion table of Normalize model applied on calibration set. As showed Merluccius merluccius (mm) was the species with the lowest accuracy respect to the other one.
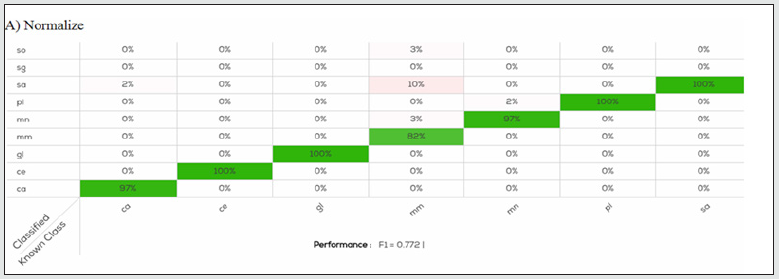
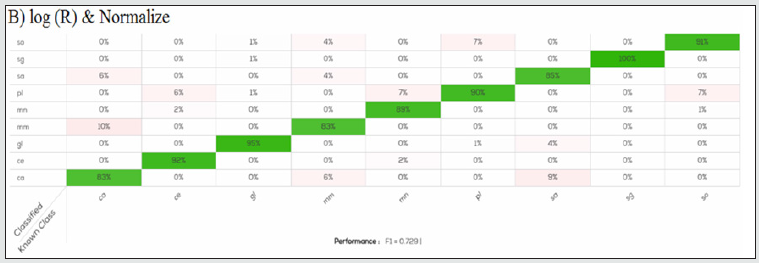
The data (2700 scans) acquired for calibration were analysed with the four algorithms to generate the classification model. The F1 related to model performance was 0.72, 0.77, 0.71, and 0.73 for the Processed, Normalize, Processed & Normalize, and log (R) & Normalize. Figures 2 and 3 presents the results of the confusion matrix of the models. For all species, except for Scomber scombrus (sg) there is slightly error in species identification, less than 10%. Even if the performance values were similar, species identification were quite different, in details for the models produced by the algorithm Processed the accuracy in species identification was between 90-100%, for Normalize was 82-100%, for Processed & Normalize 88-96% and for (log) R and Normalize was 83-100%. The higher number of species, n=5 (pl, sa, sg, gl, ce) correctly identified at 100% was produced by the Normalize algorithm [Figure. 2]. The most difficult species to identify were Gadus morhua for Processed (90%), Merluccius merluccius for Normalize (82%), Pleuronected platessa and Pollachius virens for Processed &Normalize, Pollachius virens and Merluccius merluccius for (log) R and Normalize, as showed in Figures 2 and 3 respectively. Despite these minimal differences, all methods returned good results calculated as percentage of fillet classification. All results obtained by the software by using the calibration data scans were tested on the validation samples (1350 scans) producing an F1 value of 0.97, 0.97, 0.96, and 0.98 for the Processed, Normalize, Processed & Normalize, and log (R) & Normalize algorithm, respectively. The results obtained were very similar, in all test models, the fish species were correctly predicted and not confused with another one, with an accuracy of 100%. Otherwise, considering the samples classified as undefined, that were 12% of the sample obtained from the validation data set, we obtained a global accuracy in fillet prediction slightly lower, among 93.97 and 96.58% [Table 1].
Figure 2B: Confusion table of Processed model applied on calibration set. For all species, except for Scomber scombrus (sg) there is slightly error in species identification, less than 8%.
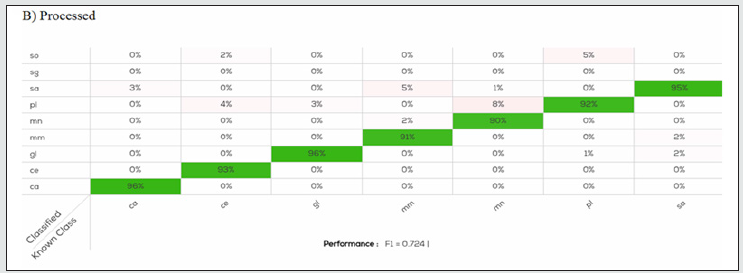
Table 1: Accuracy results of the cross-validation. Percentage of fillets, of each species, correctly identified considering undefined samples.
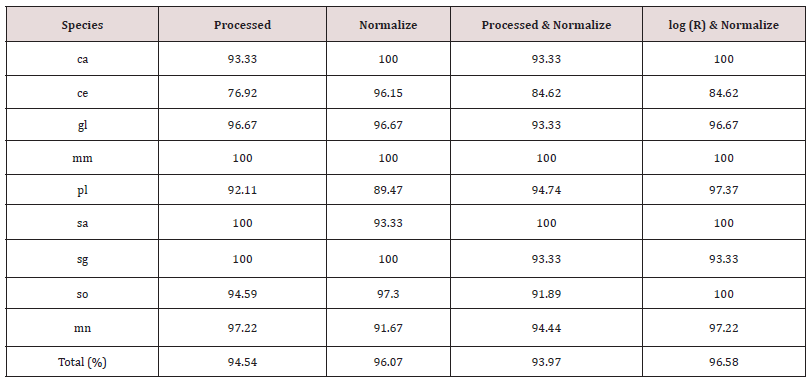
Figure 3A: Confusion table of Processed & Normalize model applied on calibration set. In all species there is an error in species identification lower than 8%.
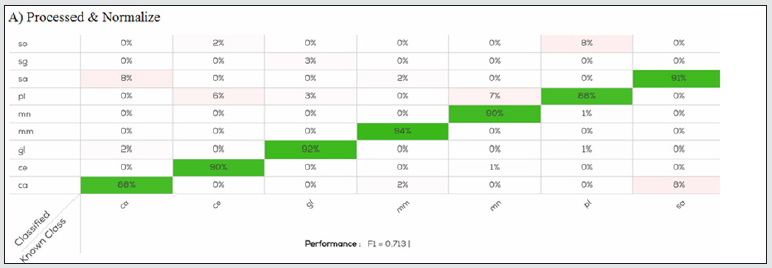
Figure 3B: Confusion table of log (R) & Normalize model applied on calibration set. For all species, except for Scomber scombrus (sg) there is slightly error in species identification, less than 10%.
Normalize produced for each species a better accuracy (89.47- 100%) and showed the higher value of F1 in the calibration model (0.77) Another interesting result was that Merluccius merluccius was always correctly identified in all the prediction models, while the major undefined samples were related to Pleuronectes platessa for Normalize with a accuracy of 92.11% and Epinephelus costae for Processed, Processed & Normalize, and log (R) & Normalize in which it was obtained the lowest accuracy, 76.92, 84.62 and 84.62% respectively. DNA analysis was performed in all samples used for the calibration data set in order to produce with the instrument a true model for classification. According to the labelling, all samples used for the calibration data set belong to the declared species: results from DNA analysis shown a similarity ≥ 98% with the species of fish fillets as declared., Similarly, DNA analysis performed on 54 samples classified as “undefined” from the validation data set shown a similarity ≥ 98% with the species reported on labels. The results obtained confirmed that NIR and DNA analysis gave the same results, and the present study shows that the SCiO device has the potential for successful application in the authentication of fish fillets. As reported in a recent study [14], results obtained by SCiO device are comparable with data obtained from benchtop NIR. It may be advantageously used by food industries to screen large numbers of samples directly on site and to check their supplies inexpensively and rapidly, without interfering with production and distribution processes. It may eventually be coupled with more complex tests, like DNA analysis, to confirm doubtful cases. These features, along with good device performance, are fundamental for this method to be used by an inexperienced user, including consumers who wish to protect themselves against food fraud and species substitution [15-18].
Highlights
Near-infrared (NIR) handheld devices can be used in situ analysis for fish authentication.
Fish fillets can be correctly identified with good accuracy 94 ÷ 97.
The method can be used to detect food fraud in species substitution.
Acknowledgment
This study was funded by the European Union’s Seventh Framework Program for research, technological development, and demonstration, under grant agreement No. 613688 and the Italian Ministry of Health.
This study was supported by the Italian Ministry of Health, under Grant nr.IZSPLV– RC 02-18 RC.
Conflict of Interest
Sciuto and Esposito contributed equally to the work.
References
- Pardo M A, E Jimenez, B Perez Villareal (2016) Misdescription incidents in seafood sector. Food Control 62(1): 277-283.
- Oceana (2016) Deceptive dishes: seafood swaps found worldwide.
- Black C, P C Olivier, S A Haughey, J Balog, S Stead, et al. (2017) A real time metabolomic profiling approach to detecting fish fraud using rapid evaporative ionisation mass spectrometry. Metabolomics 13(12): 153.
- Kim M, K Kwon, Y K Jung, T S Kang (2018) A rapid real-time PCR method to differentiate between mottled skate (Beringraja pulchra) and other skate and ray species. Food Chemistry 255: 112-119.
- Solberg C (1995) Use of near infrared transmittance in quality analysis of fish.
- Tepedino V, A Berrini, V Borromeo, D Gaggioli, C Cantoni, et al. (2001) Identification of commercial fish species belonging to the orders Pleuronectiformes and Gadiformes: Library of Isoelectric focusing patterns. J AOAC Int 84(5): 1600-1607.
- Grassi S, E Casiraghi, C Alamprese (2018) Handheld NIR device: a non-targeted approach to assess authenticity of fish fillets and patties. Food Chemistry 243: 382-388.
- Lasch P, S Uhlig, C Uhlig, C Wilhelm, N Bergmann, et al. (2019) Development and in-house validation of an LC-MS and LC-MS/MS assay for the determination of food fraud for different fish species. J AOAC Int 102(5): 1330-1338.
- Kosmowsky F, T Worku (2018) Evaluation of a miniaturized NIR spectrometer for cultivar identification: the case of barley, chickpea and sorghum in Ethiopia. PLOS ONE.
- Morillas A V, J Gooch, N Frascione (2018) Feasibility of a handheld near infrared device for the qualitative analysis of bloodstains. Talanta 184: 1-6.
- Wiedemar V, C W Huck (2018) Evaluation of the performance of three hand-held near-infrared spectrometer through investigation of total antioxidant capacity in gluten-free grains. Talanta 189(1): 233-240.
- Uddin M, E Okazaki (2011) Classification of fresh and frozen-thawed fish by Near-infrared Spectroscopy. Journal of Food Science 69(8): 665-668.
- O'Brien N, C A Hulse, F Pfeifer, H W Siesler (2013) Near infrared spectroscopic authentication of seafood. Journal of Near Infrared Spectroscopy 21(4): 299-305.
- Pennisi F, Giraudo A, Cavallini N, Esposito G, Merlo G, et al. (2021) Differentiation between Fresh and Thawed Cephalopods Using NIR Spectroscopy and Multivariate Data Analysis. Foods 10(3): 528.
- Berrini A, V Tepedino, V Borromeo, C Secchi (2005) Isoelectric focusing identification of four freshwater fish commercially labeled Perch. J AOAC Int 88(2): 670-672.
- Jacquet J L, D Pauly (2008) Trade secrets: Renaming and mislabeling of seafood. Marine Policy 32(3): 309-318.
- Shokralla S, R S Hellberg, S M Handy, I King, M Hajibabaei (2015) A DNA Mini-Barcoding system for authentication of processed fish products.
- Ward R D, T S Zemlak, B H Innes, PR. Last, P D N Hebert (2005) DNA barcoding Australia's fish species. Phil Trans R Soc B 360(1462): 1847-1857.

Top Editors
-

Mark E Smith
Bio chemistry
University of Texas Medical Branch, USA -

Lawrence A Presley
Department of Criminal Justice
Liberty University, USA -

Thomas W Miller
Department of Psychiatry
University of Kentucky, USA -

Gjumrakch Aliev
Department of Medicine
Gally International Biomedical Research & Consulting LLC, USA -

Christopher Bryant
Department of Urbanisation and Agricultural
Montreal university, USA -

Robert William Frare
Oral & Maxillofacial Pathology
New York University, USA -

Rudolph Modesto Navari
Gastroenterology and Hepatology
University of Alabama, UK -

Andrew Hague
Department of Medicine
Universities of Bradford, UK -

George Gregory Buttigieg
Maltese College of Obstetrics and Gynaecology, Europe -

Chen-Hsiung Yeh
Oncology
Circulogene Theranostics, England -
.png)
Emilio Bucio-Carrillo
Radiation Chemistry
National University of Mexico, USA -
.jpg)
Casey J Grenier
Analytical Chemistry
Wentworth Institute of Technology, USA -
Hany Atalah
Minimally Invasive Surgery
Mercer University school of Medicine, USA -

Abu-Hussein Muhamad
Pediatric Dentistry
University of Athens , Greece

The annual scholar awards from Lupine Publishers honor a selected number Read More...


