Lupine Publishers Group
Lupine Publishers
Menu
ISSN: 2638-5910
Research Article(ISSN: 2638-5910) 
The Relationship between Oxidative Stress, Obesity and Type 2 Diabetes Volume 2 - Issue 3
Fatma Mnif1*, Loukil F1, Sahnoun R1, Arous A2, Messoud T2 and Abid M1
- 1Department of Endocrinology, Hedi Chaker Hospital, Tunisia
- 2Pharmacological faculty of Monastir, Tunisia
Received: September 17, 2019 Published: October 03, 2019
Corresponding author: Fatma Mnif, Department of Endocrinology, Hedi Chaker Hospital, Tunisia
DOI: 10.32474/ADO.2019.02.000140
Abstract
Obesity is an excess of fat in the body, resulting from an imbalance between daily caloric intake and energy expenses, it was recognized as a disease in 1997 by the World Health Organization (WHO). A classic view of its etiology lies in an inability to use lipids and a chronic inequality between anabolism and the catabolism that would be causal in weight gain. According to WHO, obesity has reached the proportions of a global epidemic (more than one in ten adults in the world is obese).
Keywords: Oxidative stress; Type 2 diabetes; Obesity; Insulin; Magnesium
Abbreviations: WHO: World Health Organization; BMI: Body Mass Index; DID: Insulin Dependent Diabetes; NIDDM: Non-Insulin Dependent Diabetes; ADO: Oral Antidiabetic; HbA1c: Glycated Hemoglobin; AOS: Activated oxygen species; ADN: Acide Désoxyribo Nucléique; AGE: Advanced Glycation Products; Co A: Co-enzyme A; ACC: Acétyl Co-enzyme A Carboxylase; AMPK: Adénosine Monophosphate Protein Kinase; HGPO: Hyperglycémie provoquée par voie rale; HPLC: High Performance Liquid Chromatography; CT: Cholestérol Total; TG: Triglycérides; HDL-C: Hight density lipoproteins cholesterol
Introduction
In some forms of obesity, the accumulation of fat in “bad places”, that is, somewhere else than in adipocytes, seems to be responsible for diabetes associated with impaired insulin signals. In this case, mild weight loss can sometimes correct diabetes [1]. In turn diabetes, characterized by high blood sugar, can cause severe damage to the body. Oxidative stress in turn is a highly incriminated phenomenon in the pathophysiology of these two diseases. In fact, free radicals are harmful to the body, their frequent accumulation in the cells of obese subjects generally leads to the disruption of the role of insulin and the development of a state of insulin resistance thus preparing for the installation of true non-insulin-dependent diabetes. For this reason, it seems important to take this oxidative stress in obese and diabetic for better treatment. Many epidemiological studies indicate a relationship between obesity and diabetes and to better understand this relationship, we found it necessary to study the links between serum levels of various variables including insulin, vitamin E, and some cations involved in a major metabolic process incriminated in the pathophysiology of these two diseases: oxidative stress (we study magnesium (Mg), zinc (Zn) and calcium (Ca)), in obese diabetic type 2 and obese non diabetics.
Patients and Methods
Patients
It‘s a prospective analytic study. It concerns three types of populations: obese type 2 diabetic subjects, obese non-diabetic subjects who are compared to control subjects matched by age and sex. An information sheet was prepared for each patient and witness with the patient’s first and last names, their anthropometric measures, age, sex, Body Mass Index (BMI) and other information (Appendix). None of the witnesses had a supplement in one of the dosed items.
Withdrawals
Samples were taken at the endocrinology department of the Hedi Cheker University Hospital in Sfax and at the Kerkennah Regional Hospital between January and June 2018. Blood samples were taken after a 12-hour fast at the elbow crease vein according to the following Table 1. Some markers of oxidative stress are evaluated in all patients if each population. Chemical methods to analyse these markers are reported in Table 2
Statistical Analyzes
Statistical analysis of the data is performed using the Statistical 6.1 software (Stat Soft, France). The analysis of the results is done using a two-way analysis of variance (ANOVA). The study of the relationships between the study parameters was performed by means of the Pearson correlation coefficient. All statistics are considered statistically significant for a probability threshold of less than 0.05 (p <0.05).
Results
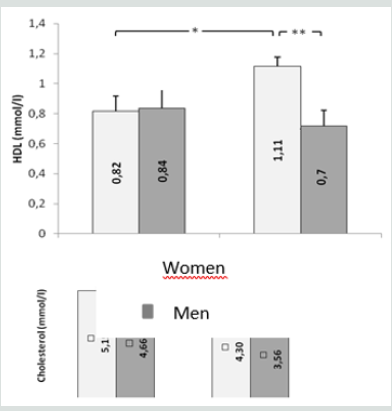
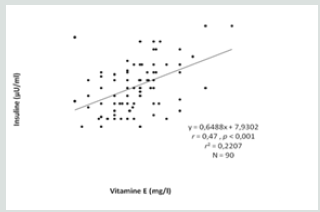
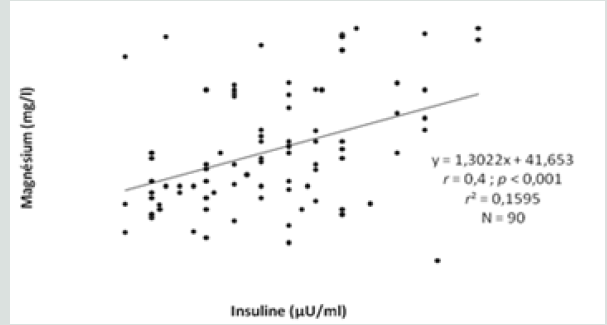
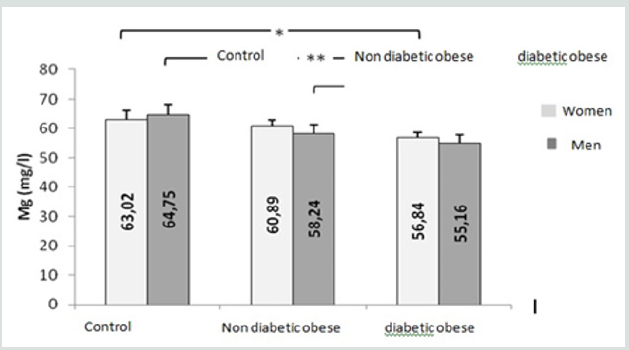
This study included three types of populations. The first one is composed of 30 obese type 2 diabetic subjects, including 7 men and 23 women between 38-76 years old, with an average age of 57 years. The BMI is between 30 - 88Kg / m2 and on average it is 37.1Kg /m2. They are all non-smokers and have no other diseases associated with their diabetes and obesity. The second population is composed of 30 obese non-diabetic subjects, including 7 men and 23 women aged between 23-65 years old, with an average age of 44 years. The BMI is between 30 - 47Kg / m2 and on average it is 38. 5Kg / m2. They are all non-smokers and have no other diseases associated with their obesity. These two groups of diabetic obese and nondiabetic obese are compared to 30 control subjects matched by age and sex with a mean age of 52 years and an average BMI of 22.4Kg / m2. Table 3 shows the anthropometric characteristics of our study population. Metabolic finding shows that obese diabetics have a significantly high fasting blood glucose level (11.25 +/- 3.95 at p <0.001) compared to non-diabetics, but there is no “sex” effect on blood glucose, as well as the CT rate, which also shows a significant difference between women and men. On the other hand, for the TG we did not notice any significant difference between the two groups. For HDL-C there is a significant difference, especially between women of both groups (p <0.05). Post hoc analysis of Bon feroni showed a significant difference between obese diabetics compared to non-diabetic obese (p = 0.007) Figure 1. We also note that there is a negative correlation between TG and HDL: the more TG increases, the lower is the HDL, and vice versa: the lower the TG decreases the higher is the HDL. Table 4 shows also that the level of insulin in diabetic obese group is significantly lower compared to non-diabetic obese and control group. Our results show also that, compared to healthy subjects, all non-diabetic obese subjects do not have a significantly different insulinaemia, we note a significant increase only in men who represent almost 23% of non-diabetic obese (p <0.05). A significant positive correlation (r = 0.4, p <0.001) was found between erythrocyte magnesium and insulinemia. This correlation confirms findings from multiple studies that prove the role of magnesium in improving insulin sensitivity and reducing the risk of type 2 diabetes [2] Figure 2. A significant positive correlation (r = 0.4, p <0.001) was also found between erythrocyte magnesium and vitamin E level (Figure 3 & 4). Regarding zinc, our research found no significant differences between the two groups of obese on the one hand and between these two groups and the control group on the other hand Figure 5. On the other hand, our study found a significant positive correlation (r = 0.33, p <0.05) between blood glucose and zinc: the more the blood glucose increases, the more the zinc increases, and vice versa: the lower the blood glucose, the lower the zinc Figure 6.
Table 4.
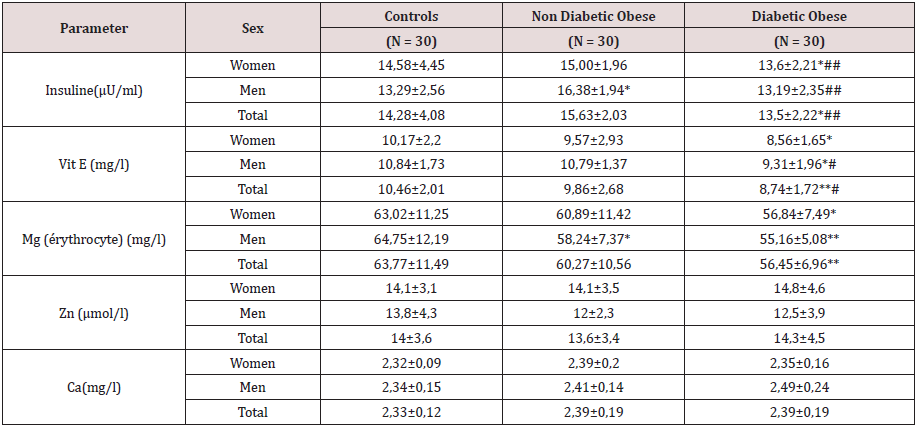
*, **: Significantly different from the control group at p <0.05 and p <0.01, respectively.
#, ##: Significantly different from non-diabetic obese at p <0.05 and p <0.01 respectively.
Figure 4: Comparison of erythrocyte magnesium concentrations between the groups studied. (*, **: Significantly different from the control group at p <0.05 and p <0.01, respectively).
Discussion
The determination of plasma insulin is of great diagnostic and
therapeutic interest not only in diabetics but also in the obese.
Insulin resistance is considered a pre-diabetic state, with type 2
diabetes being the subsequent stage where inadequate secretion of
insulin by an incompetent pancreas fails to maintain normal blood
glucose levels [3]. On the other hand, the relationship between
obesity and insulin resistance is now recognized. These results are
consistent with those found by the National Institute of Nutrition in
Tunis in 2009 in a study of fasting insulinemia and its correlations
with different anthropometric and metabolic parameters in a
Tunisian population of obese adults. found that one-third of obese
patients have fasting insulin levels [4]. In another context, studies
on the research of the relationship of oxidative stress with obesity
and diabetes are multiple and they all confirmed a considerable
decrease in total antioxidant status in obese and diabetic compared
to healthy subjects, which testifies to the presence of a state of
intense oxidative stress in these populations. To counter the
harmful effects of free radicals, the body can rely on the antioxidant
properties of several vitamins and especially vitamin E which is best
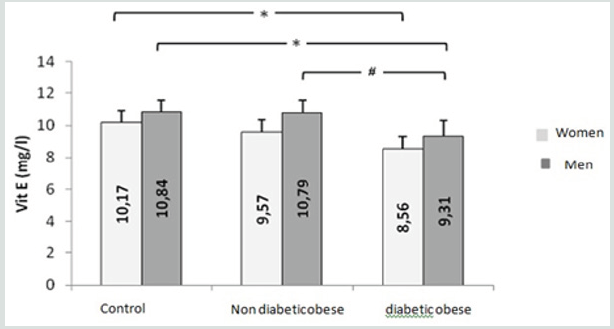
known for its antioxidant effect. Table VI confirm these findings,
indeed the level of vitamin E in diabetic obese group is significantly
lower compared to non-diabetic obese and control group. We also
note that the level of Mg is significantly lower in diabetic obese
group compared to control group. This observation does not agree
with the results of the study done by the National Institute of
Nutrition in Tunis in 2009 but it is in agreement with that found by
several researches on the role of vitamin E in the prevention of type
2 diabetes in obese people [5]. however, in our comparative study
we found that there is no significant difference between the control
group and that of the non-diabetic obese.
This result does not confirm that found by Viroonedomphol
D et al. [6] nor the hypothesis that favors the antioxidant role of
vitamin E and consequently its impact on the pathophysiology
of obesity. This discrepancy may be due to the variability of the
diets of the subjects or the difference in age of obesity. In general,
contradictory results from studies evaluating the effect of vitamin E
on inflammation, oxidation and the risk of type 2 diabetes could be
partly explained by genetic differences between individuals, likely
to cause different reactions to micronutrients. Micronutrients are
part of the nutritional needs of the body, their lack or excess can
create a metabolic disorder. In this sense we have studied the role
of magnesium, zinc and calcium in obesity and type 2 diabetes.
Regarding magnesium, we found that erythrocyte magnesium was
significantly lower (p <0.05) in obese men compared to our control
group, whereas for all obese we did not observe this difference.
In the diabetic obese of our study population, we see a significant
difference compared to the group of controls (p <0.01 and p <0.05).
This result is similar to a Moroccan study including type 2 diabetic
patients and apparently healthy subjects, matched for age, sex, and
BMI, this study indicates that plasma and erythrocyte magnesium
is significantly decreased in patients’ diabetics compared to the
control group. These data are consistent with those found in the
United States [7] and other European countries [8]. A recent metaanalysis
(compilation of several studies) seems to confirm the
preventive effect of magnesium [9].
This result confirms the hypothesis of Sprietsma JE and
Schuitemaker GE [9] that type 2 diabetes may be accompanied by
a loss of intracellular zinc and an excess of zinc in the blood [10].
This finding could confirm an antioxidant and other anti-diabetes
action of zinc. Regarding the relationship between zinc and obesity
our results show a positive but not significant relationship between
zinc and BMI (r = 0.05) which is not consistent with the results of
the study done in Tunisia (March 2007) studying the variation of
zincemia in the Tunisian obese. His results showed that the zincemia
of the obese was significantly lower than that of the controls and
the decrease of the serum zinc in the obese was even more marked
than the BMI was high. The hypozincemia of the obese did not
seem to be explained by a dietary zinc deficiency but rather by a
redistribution of the total zinc pool with adipose sequestration of
this micronutrient. In addition, a dietary or therapeutic correction
of hypozincemia is not indicated because it is a factor that increases
weight gain in obese patients [11]. The preventive role of dietary
calcium has been the subject of many studies. Calcium is involved
in the prevention of osteoporosis. Today, calcium is giving rise to a new interest in another subject of public health: obesity. Our
study, in which we did not find a significant difference between
the calcemias of the controls (non-obese) and those of the obese
non-diabetic subjects studied, does not support the hypothesis of
an adipocyte action that explains the weight and metabolic lipid
effects of calcium.
On the other hand, we found a negative but not significant
correlation (r = - 0.04) between the serum calcium and the BMI
of our patients. Large retrospective or prospective US (NHANES,
CARDIA study), Canadian (Quebec Family Study) or Australian
(National Nutrition Survey) studies support the regulating role of
dietary calcium on body weight and fat distribution. In addition,
the few clinical trials in obese adults [12]. For example, intestinal
chelation of ingested fatty acids was suspected with limited
enterocyte absorption [13], with increased faecal excretion of
fatty acids occurring in rats fed a high calcium diet [14]. It seems,
however, that these effects are modest and cannot be sufficient
to explain the weight and fat loss observed in both animals and
humans [15]. Regarding the role of calcium in the prevention or
improvement of the diabetic state, the results we found show that
there is no significant difference between the calcemia of nondiabetic
obese and that of obese diabetics so no Diabetes effect on
serum calcium. Our results also showed a positive but not significant
correlation (r = 0.06) between blood glucose and serum calcium.
Several studies find different results from ours: for example, that
of Pittas AG et al. which showed that women who had the highest
intakes of calcium and magnesium were the least prone to diabetes
during the 7 years of study [16]. Another systematic study with
meta-analysis has shown that dairy products, especially some of
their essential components such as calcium, significantly reduce the
risk of developing type 2 diabetes [17-18]. Similarly, a systematic
study with meta-analysis found that people who consumed larger
amounts of dairy products had a significantly lower relative risk
of developing type 2 diabetes than those with lower milk product
consumption [19-20].
References
- Grandmougin L (2002) Diabète et obésité. Nature 415: 247-254.
- Ludvik B, Nolan JJ, Baloga J, Sack D, OlefskyJ (1995) Effect of obesity on insulin resistance in normal subjects and patients with NIDDM. Diabetes44:1121-1125.
- F Mahjoub (2009P230 Insulinemia, anthropometric, metabolic and blood pressure parameters in Tunisian obese adults. Diabetes & Metabolism35: 81.
- Abahusain MA, Wright J, Dickerson JW, Dickerson JW, de Vol EB (1999) Retinol, alphatocopherol and carotenoids in diabetes. European Journal53(8): 630-635.
- Viroonudomphol D, Pongpaew P, Tungtrongchitr R, Changbumrung S, Tungtrongchitr A, et al. (2003) The relation between anthropometric measurements serum vitamin A and E concentrations and lipid profiles in overweight and obese subjects. Asia Pac J Clin Nutr 12(1) :73-79.
- Nadel JL, Rude RK (1995) Disorders of magnesium metabolism. EndocrinolMetab ClinNorthAm 24(2): 623-641.
- Walti MK, Zimmermann MB,SpinasGA,Hurrell RF (2003)Low plasma magnesium in type 2 diabetes. Swiss Med Wkly 133(19-20): 289-292.
- Laurie BarclayMD (2003) Medscape Medical News 2003. Diabetes Care 27: 59-65.
- Rumawas ME, McKeown NM, Rogers G, Meigs JB, Wilson PW, et al. (2006) Magnesium intake is related to improved insulin homeostasis in the Framingham offspring cohort. J Am Coll Nutr 25(6): 486-492.
- Murakami K, Okubo H, Sasaki S (2005) Effect of dietary factors on incidence of type 2 diabetes: A systematic review of cohort studies. J Nutr Sci Vitaminol51(4): 292-310.
- Sprietsma JE, Schuitemaker GE (1994) Diabetes can be prevented by reducing insulin production. Med Hypotheses42(1):15-23.
- Omar S, Ben Mami F,Azzabi S,Dakhli S,Hedhili A, et al. (2002) Médecine et nutrition 38(3): 92-96.
- Summerbell CD, Watts C, Higgins JP, Garrow JS (1998)Randomised controlled trial of novel, simple, and well supervised weight reducing diets in ourpatients. BMJ317(7171):1487-1489.
- Zemel MB, Richards J, Mathis S, Milstead A, Gebhardt L (2005) Dairy augmentation of total and central fat loss in obese subjects. Int J ObesRelatMetabDisord29(4):391-397.
- Welberg JW, Monkelbaan JF, de Vries EG, Muskiet FA, Cats A, et al. (1994) Effects of supplemental dietary calcium on quantitative and qualitative fecal fat excretion in man. Ann NutrMetab 38(4):185-191.
- Papakonstantinou E, Flatt WP, Huth PJ, Harris RB (2003) High dietary calcium reduces body fat content, digestibility of fat, and serum vitamin D in rats. Obes Res11(3):387-394.
- Parikh SJ, Yanovski JA (2003) Calcium intake and adiposity. Am J Clin Nutr77(2):281-287.
- Pittas AG, Lau J, Hu FB, Dawson-Hughes B (2007) The role of vitamin D and calcium in type 2 diabetes: A systematic review and meta-analysis. J Clin Endocrinol Metab2(6):2017-2029.
- Elwood PC, Givens DI, Beswick AD, Fehily AM, Pickering JE, et al. (2008) The survival advantage of milk and dairy consumption: An overview of evidence from cohort studies of vascular diseases, diabetes and cancer. J Am Coll Nutr27(6):723-734.
- Raquel Villegas, Yu-Tang Gao, Qi Dai, Gong Yang, Hui Cai, et al. (2009) Dietary calcium and magnesium intakes and the risk of type 2 diabetes: theShanghai Women's Health Study. American Journal of Clinical Nutrition 89(4): 1059-1067.

Top Editors
-

Mark E Smith
Bio chemistry
University of Texas Medical Branch, USA -

Lawrence A Presley
Department of Criminal Justice
Liberty University, USA -

Thomas W Miller
Department of Psychiatry
University of Kentucky, USA -

Gjumrakch Aliev
Department of Medicine
Gally International Biomedical Research & Consulting LLC, USA -

Christopher Bryant
Department of Urbanisation and Agricultural
Montreal university, USA -

Robert William Frare
Oral & Maxillofacial Pathology
New York University, USA -

Rudolph Modesto Navari
Gastroenterology and Hepatology
University of Alabama, UK -

Andrew Hague
Department of Medicine
Universities of Bradford, UK -

George Gregory Buttigieg
Maltese College of Obstetrics and Gynaecology, Europe -

Chen-Hsiung Yeh
Oncology
Circulogene Theranostics, England -
.png)
Emilio Bucio-Carrillo
Radiation Chemistry
National University of Mexico, USA -
.jpg)
Casey J Grenier
Analytical Chemistry
Wentworth Institute of Technology, USA -
Hany Atalah
Minimally Invasive Surgery
Mercer University school of Medicine, USA -

Abu-Hussein Muhamad
Pediatric Dentistry
University of Athens , Greece

The annual scholar awards from Lupine Publishers honor a selected number Read More...


