Lupine Publishers Group
Lupine Publishers
Menu
ISSN: 2644-1381
Research Article(ISSN: 2644-1381) 
Statistical Significance: Reliability of P-Values Compared to Other Statistical Summaries Volume 2 - Issue 1
Jacqueline Zawada1, John Kolassa2* and Yodit Seifu3
- 1University of Notre Dame, USA
- 2Rutgers, the State University of New Jersey, USA
- 3Department of Statistics, Merck & Co of Kennilworth, NJ, USA
Received: November 28, 2019; Published: December 09, 2019
*Corresponding author: John Kolassa, Rutgers, The State University of New Jersey, USA
DOI: 10.32474/CTBB.2019.02.000128
Abstract
Statistical inference has strongly relied on the use of p-values to draw conclusions. For over a decade this reliance on the p-value has been questioned by researches and academics. The question of whether p-values are truly the best standard, and what other possible statistics could replace p-values l has been discussed deeply. We set out to understand the amount of variation within p-values, and to find if they really are as reliable as the frequency of their use would suggest. To answer this question, we studied a set of clinical trials over the past two years. We also aim to describe the variety of information included in drag labels, and determine whether this information conforms to FDA guidelines. We found a large variation in the presentation of clinical trial data, much of which was not in line with the guidelines of the FDA. Our findings also show that among the clinical trials we studied there is more variation among the p-values than among the estimates. From this, we can conclude that the estimates from clinical trials should hold a heavy weight in the decision of whether or not to approve the drug. This finding suggests that there is validity to the skepticism of the reliance on p-values, and that further studies need to be done to find a new, more reliable, standard in statistical inference.
Introduction
The concept of “statistical significance” is seen throughout
scientific research. It is common for this significance to be measured
in the form of a p-value. Broadly, a p-value can be described as the
probability that a certain statistical value would be equal to or more
extreme than its observed value. The widespread standard is that if
a researcher can prove a p-value of less than or equal to some cutoff
point (commonly 0.05 or 0.01), then it is unlikely that the difference
between the observed value and the statistical observation is due to
chance alone, thus justifying rejection of the null hypothesis.
In the past decade the scientific community has been questioning
this reliance on the use of p-values to draw conclusions. Questions
such as why so many researches use the standard of p< 0.05 or
p 0.01 and, why much of the foundation of statistical research is
built on this assumption, have been swirling around the scientific
community [1].
One goal of this research is to investigate this skepticism into the
practice of p-values. Are p-values the most accurate representation
of significance in statistical research? The general plan was to
survey recent clinical results to compare reproducibility of results
given by p-values as compared with other statistical summaries.
The aim is to study the stability of the p-values relative to their
corresponding parameter estimate. This approach was the result
of a prior conjecture, undermined in our findings, that differences
in inclusion and exclusion criteria among various studies leads to
different definitions of population treatment effect, and so greater
variability in estimates. The second goal of this research is to
evaluate the type of information that is provided in the clinical trial
section of approved drug labels. The FDA has issued guidelines as
to what should be provided within this section of the label, and the
intent is to evaluate if most drug companies are following these
guidelines and if there is a standard to the type of details and data
that is given.
Data Source
The data for this study came from U.S food and drug administration website. It includes all novel drug approvals from 2018 up to June 10th of 2019. Novel drug is a classification given by the FDA to drugs that are innovative or serve previously unmet medical needs. The drug labels and corresponding label reviews were used to gather the qualitative and quantitative information. There were 71 total approvals from this time period. Nineteen of these approvals were for cancer drugs, which were not included in the analysis, so overall, 51 labels were reviewed for this study. Oncology drugs were not used for this study because the development process and resulting label for such drugs are very different from other drugs approved by the FDA. Figure 1.
Qualitative Analysis
The clinical trial component of the label falls in section 14. This section of the label describes and gives the data for the studies pertinent to the approval of the drug. In January of 2006 a guideline was issued by the Center for Drug Evaluation and research, part of the FDA, that outlined what type of studies should be included in this section of the label, how they should be described, and how the data should be presented [2].
Types of Studies
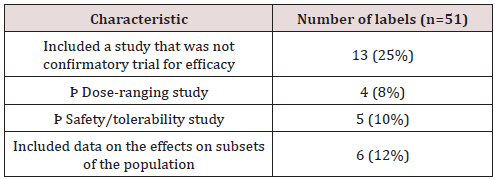
The first section of this guideline focuses on the types of studies that should be presented in section 14 of the label. These include clinical trials that either: [2] provide primary evidence of effectiveness, [3] show effects on subsets of populations, [4] provide information on different doses, or, [5] give evidence on the safety of the drug. Most of the approvals included studies that aimed to do the first of these four things: prove the primarily the efficacy of the drug. Thirteen approvals included trials that were not confirmatory studies for efficacy; 4 of these were dose-ranging trials and 5 were focused on evaluating the safety and tolerability of the drug. Six approvals included data on the effects of the drug on subsets of populations. All studies within the group analyzed could be classified into one of the four groups laid out by the FDA in their guideline. (Table 1).
Data
The FDA acknowledges that it is often more effective for data
to be presented in a table or graph, and encourages applicants
to do so [2]. This recommendation was followed for many of the
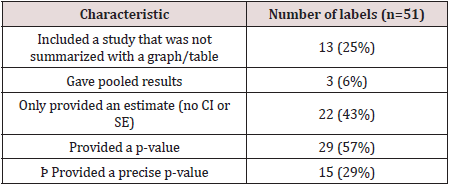
trials. There were 13 labels that included a trial where the data
was summarized in a paragraph rather than a table or graph.
When presenting data from multiple studies, the FDA recommends
that it is best to give the results from each study separately, but in special cases it is acceptable to give combined results from multiple
studies. They clarify that this should be done, “only when they are
scientifically appropriate and better characterize the treatment
effect” [2]. There were only 3 labels that gave pooled results from
the studies conducted.
There were 22 labels that only provided an estimate and did not
give a confidence interval or standard error. However, in nearly all
of these cases the estimate was given as a proportion, so standard
errors and confidence intervals could be calculated using sample
sized and estimated proportions. In addition, there were 22 labels
that did not give a p-value. In the case where a p-value was given, it
was often reported as less than or equal to a common benchmark.
Twenty-nine of the labels reported a p-value and of those, 15 had
a study where a precise p-value was reported. In general, there
was not much explicit detail on how the p-values and confidence
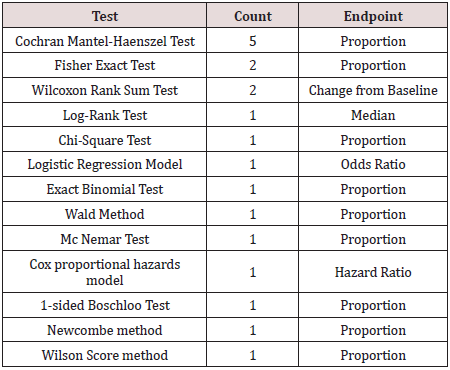
intervals were calculated. If a test or method was specified it was
usually written as a footnote. There were some commonalities
between the methods that were used. The most common were the
Mantel-Haenszel test, the Fisher exact test, and the Wilcoxon test.
The table below shows which tests were listed and how many labels
included a study that used that test, and the associated estimate
that is reported. (Table 2).
One study, of a drug used to treat influenza, reported two different methods used to calculate the p-value. The label reported that the “treatment resulted in a statistically significant shorter time to alleviation of symptoms compared to placebo using the Gehan- Breslow’s generalized Wilcoxon test (p-value: 0.014, adjusted for multiplicity). The primary analysis using the Cox Proportional Hazards Model did not reach statistical significance (p-value: 0.165)” [4]. This is notable because one p-value is significant, and one is not. This drug was the only label that mentioned using multiple tests to calculate p-values. The label did not explain the reasoning for using two different methods; however, the statistical review did give a deeper description. The applicant of the drug had pre-specified the use of the Cox proportional hazards model. However, in the treatment of acute influenza the proportional hazard assumption, which assumes that over time, the ratio of the hazards is constant, was not met. With acute influenza the survival curves converge after only a short period of time, thus violating the proportional hazard assumption. So, although the applicant had pre-specified the used of the Cox model, it ended up being more appropriate to use the Generalized Wilcoxon test. This explanation had to be found in the review of the drug [6]. The label simply listed two p-values with no reasoning, and it may have been beneficial for the reader to give some clarification within the label itself. (Table 3).
Details
Along with presenting the data from the studies, the clinical
trials section of the label also describes other pertinent details
about the trials. The FDA recommends providing the endpoints for
evaluating efficacy, the population that was studied, and any other
relevant details about how the study was conducted or how the
data was analyzed [2]. Every label made it clear what the primary
or co-primary endpoint for efficacy was. Most of the studies had
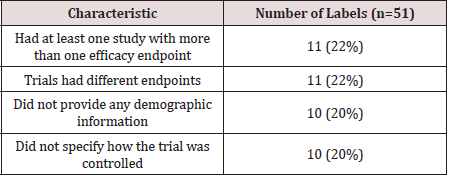
only one primary efficacy point; however, 11 labels had co-primary
endpoints listed. For many approvals, the endpoints were the same
across all trials; however; in 11 cases, not all of the trials reported
a common endpoint.
Most of the labels also gave data on either age, race, gender,
or all three of these demographics. However, 10 of the approvals
did not provide data on the population that studied. In these cases,
this information could always be found in other sections of the
label as well as the statistical review of the submission. There were
generally one or two sentences at the beginning of the section to
describe how the studies were conducted. There was no standard
format of what types of details should be included, but it usually included how the study was controlled, the scope of the study, if it
was randomized, and if there was any blinding and type of blinding.
Not all of the studies included all of those details, but most had
some combination of them. The most standard detail was to state
how the study was controlled. There were 10 labels that included a
study that did not explicitly state how it was controlled. Out of these
studies, 5 of them were not controlled, 3 were active-controlled, and
2 were placebo controlled. While this information was not explicitly
stated in the label, it could be found in the statistical review. This
information is summarized in (Table 4) below. Overall, while there
are some similarities in the types of details provided within the
clinical trials section of the label, which details are given, and in
what format vary greatly within the labels.
Quantitative Analysis
Data overview
The set of studies looked at was the Novel Drug Approvals for all of 2018 and 2019 up to 10 June. The criteria were that each trial needed to be controlled, have two or more studies, and contain enough information that one could gather or compute an estimate, standard error, p-value, and the confidence interval for the primary endpoint of the study. This data allowed us to find the total variation within the p-values and the total variation within the estimates, thus allowing us to determine which was more stable. Overall, there were 71 total approvals from the time period investigated. From this sample set 33 fit the criteria to be included in the data set and 38 did not.
Trials excluded
From the 71 approvals evaluated, 20 of the trials were cancer trials, so they were automatically excluded from the dataset. Cancer trials were not included because they have more specific standards that make them unique from the other approvals in the evaluated set and thus, they would not fit in with the data set well. One of the main issues that arose with the cancer drug approvals is that a majority of the cancer drugs were approved with only one trial. Of the 20 cancer drug approvals,18 had only one trial.
Beyond the cancer trials, there were 18 other labels that could not be included in the final dataset. The most common issue with these trials was that there was only one study conducted. This occurred in 10 of the studies examined. The FDA does allow for drugs to be approved with one study as long as there was significant evidence of its efficacy. However, general guidance requires two adequate studies FDA backgrounder 2018.
Six approvals had at least two trials, but were excluded because
they were not primarily focused on evaluating the efficacy of the
drug. There was a total of 4 approvals that included dose ranging
trials, however 2 of these were able to be included in the dataset
because they still included at least 2 confirmatory trials, which were
powered for efficacy. Dose studies include multiple different doses
of the same drug. The goal of these trials is to find what doses of
the drug are safest and are most optimal for the drug to be effective
[5]. Because there are numerous doses and the endpoint was not
focused on efficacy of the drug, these trials were not included. Two
more approvals were excluded because they focused on the safety
and tolerability of the drug rather than its efficacy.
There were 3 remaining unique cases that were also excluded.
The approval for the drug TPOXX to treat smallpox was excluded
because it was only tested on animals and no humans were included
in the trial. In animal studies there is not the same absolute concern
for the welfare of the subjects, and the trials are hence conducted
slightly differently from human studies. The approval for the
drug Recovi was also excluded from the dataset because although
it had 2 trials, the second trial is still ongoing and thus does not
have complete or usable data. Lastly, there was one label that did
not provide the sufficient amount of data to gather an estimate
and confidence interval, so it could not be included in the dataset.
Figure 2
Data Collection Methods
An estimate, confidence interval, standard error, and p-value
were gathered or calculated from each trial for the labels that
were included in the data set. In the case where the endpoint was
measured as a proportion and no confidence interval or standard
error was given, the standard error and confidence interval for the
difference in treatment mean were immediately calculated and
entered into the spreadsheet. Beyond this, all calculations to find
the standard errors and p-values for trials were done in R.
If an exact p-value was given, then that was the one that was
used for the analysis, it was not recalculated. In the cases where a
p-value did have to be calculated, a normal distribution and a twosided
p-value were assumed, and the standard normal distribution
function was used in R.
The dataset included the statistics for the primary or coprimary
endpoints for all efficacy trials from the labels used. Some
labels provided multiple doses; in this case the recommended
dose was used for the data set. If there was no recommended dose
given, then the largest dose was used. To be included, the dose or
endpoints needed to be used throughout all of trials. For example, if
trial 1 included endpoint A and B and trial 2 only included endpoint
B, the only endpoint B for trial 1 and 2 were used in the dataset.
In addition, if there was not enough data provided for the primary
endpoint to be included in the dataset (i.e. no confidence interval or
SE) then the first secondary endpoint listed was used for that study.
In several labels, the estimate did not lie exactly in the middle of the
confidence interval. This is likely due to rounding in the reported
data. Most of the studies reported values up to only one or two
decimal places. In these cases, the middle of the confidence interval
was calculated and used as the estimate.
Calculation/Result
First, the standard errors were calculated using the confidence intervals and all the p-values were transferred to (-∞, ∞) scale using the normal quantile function. This was done so that when using the p-values in subsequent calculations the values were transformed to a scale making subsequent linear modeling appropriate. For example, a p-value of 6.37E-19 would become -8.81. An average of the standard errors for each common endpoint for each set of studies was also calculated. Then, two linear mixedeffects models were constructed using this data. In the first model, the response variable was the normal quantiles and there were two random effects: one for the different drugs and one for the possible different endpoints within each drug. The second model was set up in the same manner, except the response variable was the estimate divided by the average standard error for each trial. Total variation was calculated by dividing the residual variation by the sum of the residual and the drug random effect variation. The endpoint random effect variation was not included in this calculation. The total variation found within the p-value model was 0.3721 and the total variation found within the estimate model was 0.2881.
Conclusion
This data shows that the variability among the p-values is larger than the variability among the estimates. Hence, there is information about the drug behavior as a whole that is contained in the estimates beyond that which is contained in the p-values. The information provided by p-values does not support the frequency of its use in statistical inference. The studies we have reviewed reinforce the idea of utilizing the estimates of treatment effects when evaluating the effects of a new drug.
Acknowledgement
I would like to acknowledge the generous help of NSF grant DMS 1712839
References
- Ronald WL, Nicole AL (2016) The ASA Statement on p-values: Context, Process, and Purpose. The American Statistician 70 (2): 129-133.
- Center for Drug Evaluation and Research (2006) Clinical Studies Section of Labeling for Human Prescription Drug and Biological Products-Content and Format: Guidance for Industry Food and Drug Administration, USA.
- Food and Drug Administration Modernization Act (FDAMA) of (1997) FDA Backgrounder on FDAMA. US Food and Drug Administration, USA.
- Genentech Inc (2018) Xofluza (baloxavirmarboxil) Approval Label, USA.
- Schmidt R (1988) Dose-finding studies in clinical drug development. Eur J Clin Pharmacol 34 (1): 15-19.
- Smith, Fraser, ThambanValappil (2018) Xofluza Statistical Review and Evaluation. Genentech Inc, USA.

Top Editors
-

Mark E Smith
Bio chemistry
University of Texas Medical Branch, USA -

Lawrence A Presley
Department of Criminal Justice
Liberty University, USA -

Thomas W Miller
Department of Psychiatry
University of Kentucky, USA -

Gjumrakch Aliev
Department of Medicine
Gally International Biomedical Research & Consulting LLC, USA -

Christopher Bryant
Department of Urbanisation and Agricultural
Montreal university, USA -

Robert William Frare
Oral & Maxillofacial Pathology
New York University, USA -

Rudolph Modesto Navari
Gastroenterology and Hepatology
University of Alabama, UK -

Andrew Hague
Department of Medicine
Universities of Bradford, UK -

George Gregory Buttigieg
Maltese College of Obstetrics and Gynaecology, Europe -

Chen-Hsiung Yeh
Oncology
Circulogene Theranostics, England -
.png)
Emilio Bucio-Carrillo
Radiation Chemistry
National University of Mexico, USA -
.jpg)
Casey J Grenier
Analytical Chemistry
Wentworth Institute of Technology, USA -
Hany Atalah
Minimally Invasive Surgery
Mercer University school of Medicine, USA -

Abu-Hussein Muhamad
Pediatric Dentistry
University of Athens , Greece

The annual scholar awards from Lupine Publishers honor a selected number Read More...


