Lupine Publishers Group
Lupine Publishers
Menu
ISSN: 2637-4676
Research Article(ISSN: 2637-4676) 
The Effects of Different Phosphate Sources on Growth Performance, Blood Calcium-Phosphorus and Bone Characteristics of Broilers Volume 8 - Issue 2
Kaveh Jafarikhorshidi1*, Hasan Dallalfarsh Rasouli1, Mehrdad Irani1 and Hamed Kioumarsi2
- 1Animal Science Department, Ghaemshahr Branch, Islamic Azad University, Ghaemshahr, Iran
- 2Animal Science Research Department, Gilan Agricultural and Natural Resources Research and Education Center, AREEO, Rasht, Iran
Received: February 13, 2020; Published: February 25, 2020
Corresponding author: Kaveh Jafarikhorshidi, Animal Science Department, Ghaemshahr Branch, Islamic Azad University, Ghaemshahr, Iran
DOI: 10.32474/CIACR.2020.08.000285
Abstract
The study was performed to assess using burned bone meal as an organic and di-calcium phosphate as an inorganic phosphate source with different amounts of calcium in diet of broiler chicken (Ross-308). The experimental diets involved supplying overall available phosphorus in the form: (1) di-calcium phosphate (14% available phosphorus and 23% calcium), (2) di-calcium phosphate (18% available phosphorus and 23% calcium), (3) burned bone meal (12% available phosphorus and 32% calcium), (4) burned bone meal (14% available phosphorus and 32% calcium), and (5) burned bone meal (16% available phosphorus and 32% calcium). A completely randomized design consisting of five treatments and three replicates was used. The data were statistically analyzed using the Proc GLM model in SAS version 9.1. The results indicate that the source of phosphorus used in the diets affects performance and bone characteristics of the broilers. The chickens fed overall available phosphorus by di-calcium phosphate (14% available phosphorus and 23% calcium) had the best performance which with regards to economic and environmental interests that dictate phosphorus be held to minimum levels, is a promising outcome. The bone characteristics results revealed that the chickens fed with the inorganic source of calcium with a higher amount of phosphorus had the best performance. Thus, the bone meal requires a slightly higher amount of phosphorus than that required for growth performance of broilers.
Keywords: Broiler; phosphate source; performance; blood parameter; bone characteristics
Introduction
Dietary calcium (Ca) and phosphorus (P) serve a variety of functions in metabolism, growth and health, which emphasizes the important economic implications of these minerals in poultry nutrition [1]. In order to determine the efficiency of the use of mineral elements in animal diets, we must be aware of their relative bioavailability in the components of diet and feed. The chemical analysis of food alone cannot determine the biological efficiency of that nutrient [2]. Several factors affect the biological efficiency of mineral elements and especially micronutrients. Consumption of mineral elements at lower levels, physical form, digestibility of whole diets, interactions of mineral elements together and nutrients, inhibitors and physiological circumstances of the animal, processing conditions of each of the components of the diet and the age of the animal all affect the bioavailability of the elements [3]. Rostagno [4] mentioned similar P availability and digestibility in broilers for Monocalcium Phosphate (MCP), Dicalcium Phosphate (DCP) and Tricalcium Phosphate (TCP). Most feed phosphates categorized as MCP and DCP are mixtures of these sources. Therefore, differences between sources and also within a source exist [5]. Hamdi et al. [6] stated that the P could improve growth rate in some ranges and can have an intervention with other micromineral absorption processes. There have been many methods to determine bone characteristics, and there is a relationship between diet and bone characteristics. It has been shown that the chemical composition of the diet has a significant effect on growth indices and mineral composition and bone structure [7]. Phosphorus is one of the most expensive nutrients in poultry diets and an essential mineral for virtually all farm animals and plays a key role in cellular metabolism, cellular regulatory mechanisms and in bone mineralization [6, 8]. It is also a source of environmental concerns. However, mineral sources of P in diets are still a need in order to meet the requirements of poultry and prevent mineral deficiencies [6]. Therefore, providing an adequate P supply without excessive amounts remains an important issue. Fallah et al. [9] stated that mineral source and concentration could impact the performance and bone mineralization in broiler chickens. One of the crucial tests for estimating dietary sufficiency and also the bioavailability of P is bone development along with measuring the growth performance of the animals [10]. In this study, the researchers measured the assumption that different feed phosphates in organic and inorganic forms, varying in the amount of P and Ca, will affect the performance, blood calcium and phosphorus concentrations and bone characteristics of broiler chickens.
Materials and Methods
Birds and experimental treatments
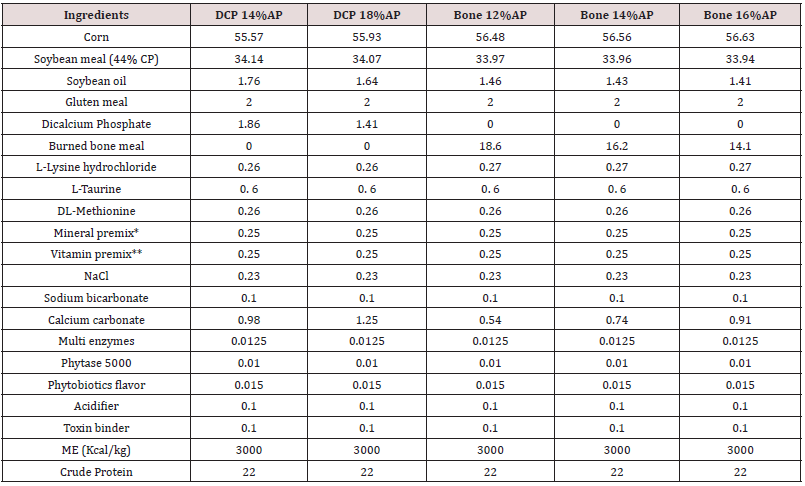
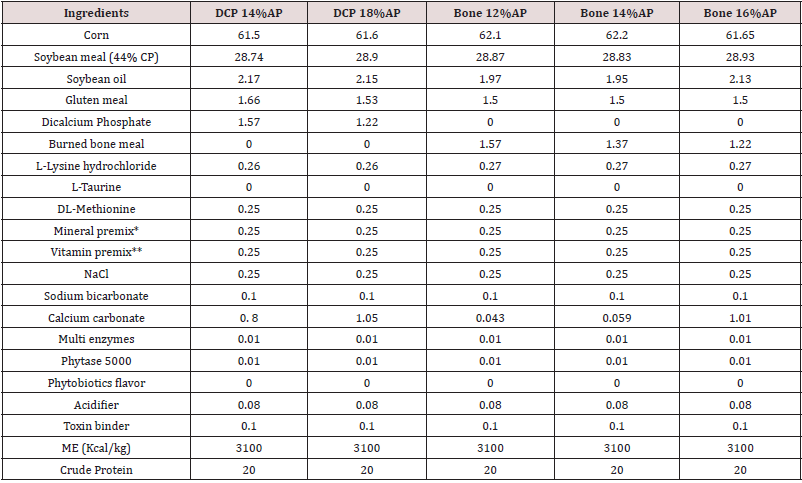
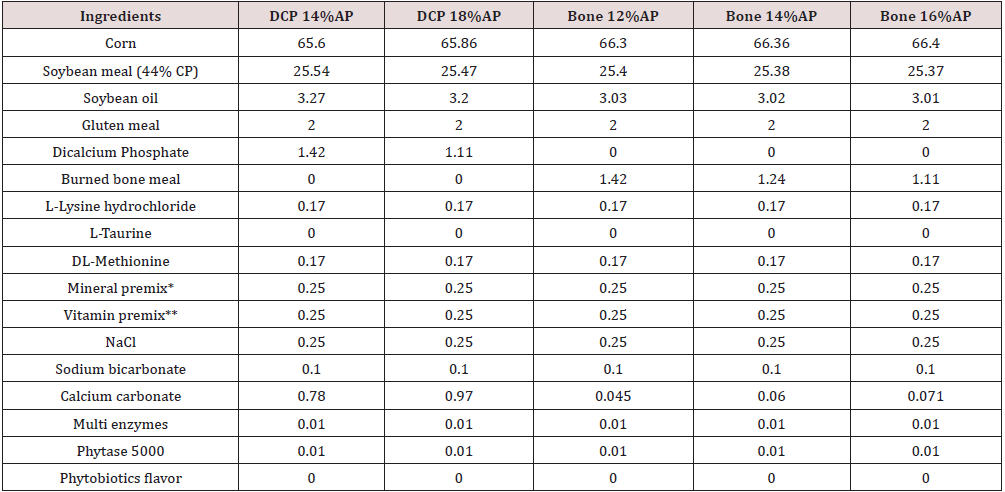
The experiment was conducted during 2016 in a poultry research center facility located in the Islamic Azad University, Qaemshahr Branch, Qaemshahr, Iran. The trial lasted 42 d and pens, with dimensions of 1.2×1.5 m and 1 m height, were randomly allocated to five dietary treatments with each having four replicates of 15 birds. Before the experiment, the poultry rearing unit was thoroughly cleaned and rinsed using pressurized water. The hall was gasified 24 h before starting the experiment. A total of 300 1 d-old male chickens (Ross-308), from a commercial hatchery, were selected and divided into 5 trial groups (3 replicates of 4 chickens). The average body weight (BW) of broilers was 42 g. The study was conducted in a completely randomized design. Chickens were vaccinated, and to reduce the stress caused by vaccination, 24 h before and after vaccination, a multi-electrolyte solution was added in drinking water. The lighting program for the broilers is illustrated in Table 1. The three-stage diet is tailored to the proposed pattern for the Ross 308 strain (including 0-10, 11-24, and 25-42 days). The experimental diets included different phosphate sources (organic and inorganic), varying in the amount of P and Ca. The feed ingredients and nutrient analysis of the basal diets are presented in Tables 2-4.
Table 1: Lighting programs for broiler.

This lightening program is adopted from the Ross Broiler Pocket Guide-Aviagen (2014)
Table 2: Feed ingredients and nutrient analysis of the basal diet, 1-10 day of age (%, unless mentioned).
Abbreviations: DCP = di-calcium phosphate. AP = available P. ME = metabolizable energy.
*Supplied per Kg of mixture: 1,081 mg trans-retinol; 20 mg cholecalciferol; 4 mg α-tocopherol acetate; 800 mg menadione; 720 mg
thiamine; 2,640 mg riboflavin; 4,000 mg niacin; 12,000 mg calcium pantothenate acid; 1,200 mg pyridoxine; 400 mg folic acid; 6 mg
cyanocobalamin; 40 mg biotin; 100,000 mg choline; 40,000 mg antioxidant.
** Supplied per Kg of mixture: 39,680 mg manganese; 20,000 mg iron; 33,880 mg zinc; 4,000 mg copper; 400 mg iodine; 80 mg
selenium; 1 mg excipient.
Table 3: Feed ingredients and nutrient analysis of the basal diet, 11-24 day of age (%, unless mentioned).
Abbreviations: DCP = di-calcium phosphate. AP = available P. ME = metabolizable energy.
*Supplied per Kg of mixture: 1,081 mg trans-retinol; 20 mg cholecalciferol; 4 mg α-tocopherol acetate; 800 mg menadione; 720 mg
thiamine; 2,640 mg riboflavin; 4,000 mg niacin; 12,000 mg calcium pantothenate acid; 1,200 mg pyridoxine; 400 mg folic acid; 6 mg
cyanocobalamin; 40 mg biotin; 100,000 mg choline; 40,000 mg antioxidant.
** Supplied per Kg of mixture: 39,680 mg manganese; 20,000 mg iron; 33,880 mg zinc; 4,000 mg copper; 400 mg iodine; 80 mg
selenium; 1 mg excipient.
Table 4: Feed ingredients and nutrient analysis of the basal diet, 25-42 day of age (%, unless mentioned).
Abbreviations: DCP = di-calcium phosphate. AP = available P. ME = metabolizable energy.
*Supplied per Kg of mixture: 1,081 mg trans-retinol; 20 mg cholecalciferol; 4 mg α-tocopherol acetate; 800 mg menadione; 720 mg
thiamine; 2,640 mg riboflavin; 4,000 mg niacin; 12,000 mg calcium pantothenate acid; 1,200 mg pyridoxine; 400 mg folic acid; 6 mg
cyanocobalamin; 40 mg biotin; 100,000 mg choline; 40,000 mg antioxidant.
** Supplied per Kg of mixture: 39,680 mg manganese; 20,000 mg iron; 33,880 mg zinc; 4,000 mg copper; 400 mg iodine; 80 mg
selenium; 1 mg excipient.
Sampling and measurements
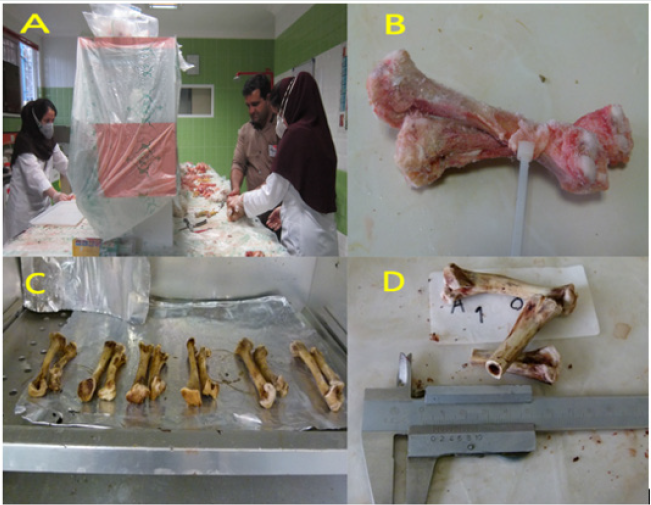
The initial weight of each bird was taken before being allotted into treatments and also at the end of the experiment. The birds were given a known kg of feed in the morning and the left-overs were weighed in the evening and recorded. The feed conversion ratio was measured weekly, as an index of feed utilization for each treatment group and calculated as the ratio of feed intake to weight gain. The blood samples were collected during different stages of the study to measure Ca and P content using the method of PerkinElmer Corporation [11]. At the end of the study, the birds were killed via cervical dislocation, and the abdominal fat, livers, and gizzards and other internal organs were separated for weighing. The gizzard was weighed after opening and removal of feed residues, and expressed as a percentage of total body weight (grams per 100 g). The carcasses were submitted to cuts to measure the weight of carcass components as affected by the treatments. After slaughter, right tibias were taken from birds and the soft tissues were removed. Then, the samples were dried at 100°C for 24 h. To assess the bone characteristics of broilers, measurements were made of bone weights, bone length, diaphysis diameter, internal wall thickness, external wall thickness, and medullary canal diameter (Figure 1).
Figure 1: Measuring the bone characteristics of broilers.
A. After slaughter, the bones were taken from birds; B. The soft tissues were removed from the bones; C. The samples were
dried in ovens at 100°C; D. The analysis of tibia and femur.
Statistical Analysis
This experiment was conducted in a completely randomized design with 300 male chickens (Ross-308) allocated to five treatments and three replicates. The data analysis was performed using the General Linear Models (GLM) procedures of SAS software (SAS, Version 9.1). The model for data analysis was as follows: Yij = μ + ti + εij, where Yij is the observation, μ is the general mean, ti is the treatment effect and εij is the experimental error. The means were compared by Duncan’s Multiple Range Test at the 5% probability level.
Results and Discussion
The feed intake, growth performance and feed conversion responses of broiler chickens to different levels and sources of Ca and P are presented in Tables 5-7. The values show that the effect of diets on feed intake was significant. Although the results show some inconsistency during different stages of the study, by the end of the test period (42 days), the highest and lowest feed intake belonged to chickens fed diets 1 (included DCP, 14% available P and 23% Ca) and 4 (included burned bone meal, 14% available P and 32% Ca). As shown, the treatments significantly improved weight gain and feed conversion ratio in starter, grower, and total periods of experiment. According to the results, at the end of 7 and 10 days, the highest live weight (152.6 and 228 g) was observed in chickens fed with diet 3 (included burned bone meal, 12% available P and 32% Ca), and the lowest live weight (143 and 210 g) belonged to the chickens fed with control diet. At the end of the test period (42 days), the highest and lowest feed intake belonged to chickens fed diets 1 (included DCP, 14% available P and 23% Ca) and 4 (included burned bone meal, 14% available P and 32% Ca). Khattak et al. [12] mentioned that the effect of P varies depending upon the source and formula. However, the results of the current study reveal that chickens fed with the ratio including 23% Ca and 14% P from the DCP source had the best performance in terms of growth, feed conversion ratio and had also the highest feed intake. The highest performance in the chickens fed with ratio include DCP (inorganic source) could be justified by relatively higher biological availability of P in DCP for broilers [13,14], while the effectiveness of a lower amount of P on growth performance may be because of the fact the P could improve growth rate in a specific range and its effect can have interference with other micromineral absorption processes [15].
Table 5: Feed intake measurement during different stages of the study (g).

Means within each column with no common superscript differ significantly at P < 0.05.
Table 6: Growth rate measurement during different stages of the study (g).

Means within each column with no common superscript differ significantly at P < 0.05
Table 7: Feed conversion ratio measurement during different stages of the study.

Means within each column with no common superscript differ significantly at P < 0.05
Due to the importance of P inclusion in poultry diets, it could be a good practice to lower-supplement this mineral in the diet [15]. The results show a higher performance in chickens while fed with a lower amount of Ca. This could be because Ca decreases the amount of P in a suitable form for absorption through the formation of precipitates of orthophosphate in the digestive system and insoluble complexes with the phytate molecule [6, 16]. In fact, calcium may increase the intestinal pH and reduce mineral solubility and availability, as reported by Shafey & McDonald [17]. The weight of carcass components, some internal and non-edible organs are presented in Tables 8,9. The treatments have a significant effect on some traits such as leg, drumstick, drum no bone, and viscera. This may be due to the fact that the bird’s performance can have a multitude of responses to its diet [1]. Nevertheless, the results were mostly consistent with the feed intake, growth rate, and feed conversion ratio values. The best performance belonged to chickens fed diets 1 (included DCP, 14% available P and 23% Ca). In fact, there is a positive relationship between the growth of the animal body in whole and its carcass parts [18, 19]. At the end of days 10, 24 and 42, the concentration of Ca and P in the blood (mg/ dl) was determined, and the results are presented in Table 10, 11. The results were not consistent during different stages of the study. Hurwitz & Bar [20], working with 3.72 and 3.79% Ca levels, and Clunies et al. [21], with 2.5, 3.5, and 4.5% Ca, reported that total Ca retention by the bird increased with dietary Ca levels. On the other hand, Kimberg et al. [22] stated that Ca transport in the digestive tract increased when low Ca levels (2.8%) were fed. Nevertheless, at the end of the 42 days of the study, chickens fed with the ratio including 23% Ca and 14% P from the DCP source (treatment 1) had the highest amount of Ca in the blood, which reveals the effectiveness of the treatment 1. Yet, the effect of P on the P of the blood was insignificant. With regards to the bone characteristics, statistical surveys show that there is no significant difference between some measured indicators, while the treatments had significant effects on bone length, bone weight, diaphysis diameter, medullary canal diameter, and internal wall thickness. Previous researches have shown that about 80% of bone mass is determined genetically, while about 20% can be related to external factors in which diet is one of the most important factors [23-25].
Table 8: Relative weight of carcass components as affected by the different treatments (% of live body weight).

Means within each column with no common superscript differ significantly at P < 0.05.
Table 9: Relative weight of some internal and non edible organs as affected by the different treatments (% of live body weight).

Means within each column with no common superscript differ significantly at P < 0.05.
Table 10: Blood parameters measurement during different stages of the study.

Means within each column with no common superscript differ significantly at P < 0.05.
Table 11: The analysis of tibia and femur.

Means within each column with no common superscript differ significantly at P < 0.05.
In the current study, all these measured factors had significantly higher values (p<0.001) for chickens fed with the ratio including 23% Ca and 18% P from the DCP source which had the highest amount of Ca and P from an inorganic source, and proved to be more effective than its organic counterpart. Birds seem to respond to a decrease in Ca and P dietary content by increasing the expression of mRNA encoding Ca transporters [26], and phosphorus transporters [25,27] in the small intestine, leading to poor bone mineralization. Therefore, impairing animal welfare or increasing processing losses in some cases [28]. The result revealed that the best growth performance was observed for chickens fed with ration including DCP (inorganic source) and an average amount of P (14% available P), while the bone characteristics responded more positively to a higher amount of P. This could be due to that fact that bone mineralization depends to a greater extent on dietary concentrations of P compared with body weight, feed conversion ratios and other related factors [1, 29, 30]. Thus, the concentration of P required to maximize bone structure and function is higher than those required for growth performance.
Conclusion
The results of this study indicate that the source of P used in broiler chickens can affect performance and bone characteristics of broilers, and it is possible to achieve the best outcome with a lower supplement of Ca and P in the diet. Chickens fed with ration including inorganic phosphate sources with 14% available P had the best growth performance, while the bone characteristics responded more positively to a slightly higher amount of P. Therefore, attention to the source and amount of this mineral in the diet is important.
References
- Gautier AE, Walk CL, Dilger RN (2017) Influence of dietary calcium concentrations and the calcium-to-non-phytate phosphorus ratio on growth performance, bone characteristics, and digestibility in broilers. Poultry Science 96(8): 2795-2803.
- AOAC (Association of Official Analytical Chemists). 2005. Official Methods of Analysis of the Association of Analytical Chemists International (18thedn). City.
- Miles RD, Henry PR (1997)Deflurinated phosphates may provide advantages. Feedstuffs 6: 12-15.
- Rostagno HS (2017) Brazilian tables for poultry and swine. Composition of feedstuffs and nutritional requirements, (4thedn). Federal University of Viç
- Petersen GI, Pedersen C, Lindemann MD, Stein HH (2011) Relative bioavailability of phosphorus in inorganic phosphorus sources fed to growing pigs. Journal of Animal Science89(2): 460-466.
- Hamdi M, SolàOriol D, Franco-RossellóR, Aligué-Alemany R, Pérez JF (2017) Comparison of how different feed phosphates affect performance, bone mineralization and phosphorus retention in broilers. Spanish Journal of Agricultural Research15(3): 1-10.
- Bessi W (2006) Welfare of broilers: A review. World’s Poultry Science Journal62(3): 455-466.
- Suttle NF (2010) Mineral nutrition of Livestock, (4thedn). CAB International, Oxfordshire, UK.
- Fallah H, Karimi A, Sadeghi GH, Behroozi-Khazaei N (2018) The effects of calcium source and concentration on performance, bone mineralisation and serum traits in male broiler chickens from 1 to 21 days of age. Animal Production Science59(6): 1090-1097.
- Ammerman CB (1995) Methods for estimation of mineral bioavailability. In: Bioavailability of Nutrients for Animals: Amino Acids, Minerals and Vitamins. Ammerman, CB, DH Baker and AJ Lewis (Eds.). Academic Press, New York, USA, Pp: 83-94.
- PerkinElmer Corporation (1996) Anatomic absorption spectroscopy analytical methods. Norwalk.
- Khattak F, Shahzad MA, Pasha TN, Saleem G (2016) Comparative evaluation of commercially available supplementary sources of inorganic phosphorus in broiler feed. The Journal of Animal & Plant Sciences 26(6): 1576-1581.
- Garcia AR, Batal AB, Dale NM (2006) Biological availability of phosphorous sources in prestarter and starter diets for broiler chicks. Journal of Applied Poultry Research 15: 518-524.
- Simpson CJ & Wise A (1990) Binding of zinc and calcium to inositol phosphates (phytate) in vitro. British Journal of Nutrition 64(1): 225-232.
- Driver J, Pesti G, Bakalli R, Edwards H (2005) Calcium requirements of the modern broiler chicken as influenced by dietary protein and age. Poultry Science 84(10): 1629-1639.
- Wise A (1983) Dietary factors determining the biological activities of phytate. Nutrition Abstracts and Reviews 53: 791-806.
- Shafey TM, McDonald MW (1991) The effects of dietary calcium, phosphorus and protein on the performance and nutrient utilization of broiler chickens. Poultry Science 70: 548-553.
- Michalczuk M, Zdanowska-Sąsiadek, Damaziak K, Niemiec J (2017) Influence of indoor and outdoor systems on meat quality of slow-growing chickens. CyTA – Journal of Food 15(1): 15-20.
- Banday MT, Risam KS (2001) Growth performance and carcass characteristics of broiler chicken fed with probiotics. Indian Journal of Poultry Science 36(3): 252-255.
- Hurwitz S, Bar A (1967) Calcium metabolism of hens secreting heavy or light eggshells. Poultry Science 46(6): 1522-1527.
- Clunies M, Parks D, Leeson S (1992) Calcium and phosphorus metabolism and eggshell thickness in laying hens producing thick or thin shells. Poultry Science 71(3): 490-498.
- Kimberg DV, Schachter D, Schenker H (1961) Active transport of calcium by intestine: Effect of dietary calcium. American Journal Physiology 200: 1256-1262.
- Eastell R, Lambert H (2002) Diet and healthy bones. Calcified Tissue International 70(5): 400-404.
- Colet S, Garcia RG, Almeida Paz ICL, Caldara FR, Borille R, et al. (2015) Bone characteristics of broilers supplemented with vitamin D. Brazilian Journal of Poultry Science 17(3): 325-332.
- Valable A, Narcy A, Duclos M, Pomar C, Page G, et al. (2018) Effects of dietary calcium and phosphorus deficiency and subsequent recovery on broiler chicken growth performance and bone characteristics. Animal 12(8): 1555-1563.
- Bar A (2009) Calcium transport in strongly calcifying laying birds: mechanisms and regulation. Comp BiochemPhysiolA Mol IntegrPhysiol 152(4): 447-469.
- Ashwell CM, Angel R (2010) Nutritional genomics: a practical approach by early life conditioning with dietary phosphorus. RevistaBrasileira de Zootecnia 39: 268-278.
- Applegate TD, Angel R (2008) Phosphorus requirements for poultry. Fact sheet for natural resources conservation service feed management 592 Practice Standard, Education Project, USDA CIG project, West Lafayette, IN, USA.
- Adedokun SA, Sands JS, Adeola O (2004) Determining the equivalent phosphorus released by an Escherichia coli-derived phytase in broiler chicks. Canadian Journal of Animal Science 84(3): 437-444.
- Olukosi OA, Fru-Nji F (2014) The interplay of dietary nutrient specification and varying calcium to total phosphorus ratio on efficacy of a bacterial phytase: 1. Growth performance and tibia mineralization. Poultry Science 93(12): 3037-3043.

Top Editors
-

Mark E Smith
Bio chemistry
University of Texas Medical Branch, USA -

Lawrence A Presley
Department of Criminal Justice
Liberty University, USA -

Thomas W Miller
Department of Psychiatry
University of Kentucky, USA -

Gjumrakch Aliev
Department of Medicine
Gally International Biomedical Research & Consulting LLC, USA -

Christopher Bryant
Department of Urbanisation and Agricultural
Montreal university, USA -

Robert William Frare
Oral & Maxillofacial Pathology
New York University, USA -

Rudolph Modesto Navari
Gastroenterology and Hepatology
University of Alabama, UK -

Andrew Hague
Department of Medicine
Universities of Bradford, UK -

George Gregory Buttigieg
Maltese College of Obstetrics and Gynaecology, Europe -

Chen-Hsiung Yeh
Oncology
Circulogene Theranostics, England -
.png)
Emilio Bucio-Carrillo
Radiation Chemistry
National University of Mexico, USA -
.jpg)
Casey J Grenier
Analytical Chemistry
Wentworth Institute of Technology, USA -
Hany Atalah
Minimally Invasive Surgery
Mercer University school of Medicine, USA -

Abu-Hussein Muhamad
Pediatric Dentistry
University of Athens , Greece

The annual scholar awards from Lupine Publishers honor a selected number Read More...


