Lupine Publishers Group
Lupine Publishers
Menu
ISSN: 2637-4676
Research Article(ISSN: 2637-4676) 
Intervarietal Hybridization and Genetic Diversity of Rice by Molecular Markers Volume 3 - Issue 4
Diploma Debbarma and VK Khanna*
- Central Agricultural University, India
Received: June 22, 2018; Published: July 05, 2018
Corresponding author: VK Khanna, School of Crop Improvement, College of Post-Graduate Studies, Central Agricultural University, Barapani, Umiam-793103, Meghalaya, India
DOI: 10.32474/CIACR.2018.03.000167
Abstract
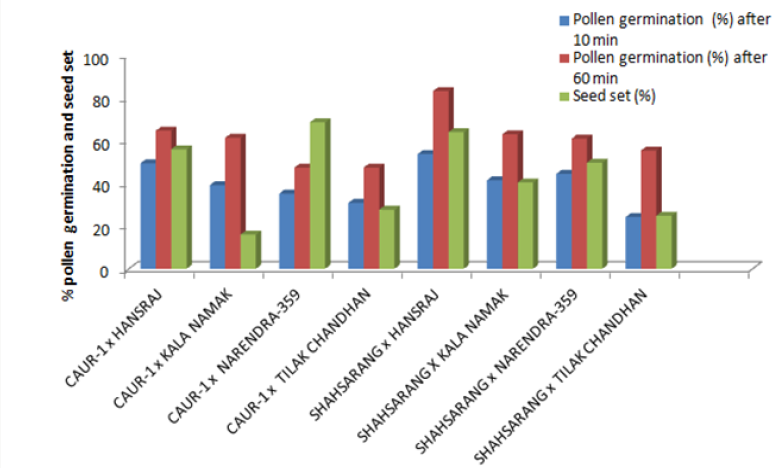
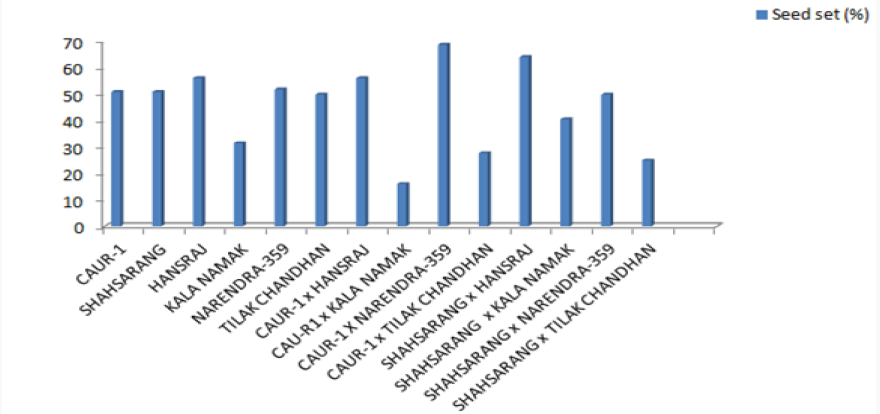
Cross ability of various accessions of Oryza sativa L. on the basis of pollen development and seed set was studied along with genetic diversity by RAPD and SSR markers. The variety Kalanamak had maximum number of fertile pollen (82.25%) whereas the variety Narendra-359 had the least number (61.03%). The cross of CAU R-1 with Hansraj (83.67%) gave the highest germination % after 1 hour. The cross of CAU R-1 with Narendra-359 gave the maximum seed set (68.96%). The pollen tube growth at 1 hour after pollination had a positive correlation with seed set. In general, selfing showed more pollen germination and pollen tube growth as compared to inter-varietal crosses with respect to seed set. Fourteen RAPD and eight SSR primers were used to assess the genetic diversity of 17 rice varieties. A total of 78 RAPD and 16 SSR amp icons were generated. The value of Jacaard’s similarity coefficient for RAPDs ranged from 0.284 to 0.766 with an average value of 0.526 whereas for SSRs it ranged from 0.071 to 1 with an average value of 0.396. The UPGMA cluster analysis grouped the 17 rice varieties in four clusters in case of RAPDs and three clusters in case of SSRs. The results of principal component analysis were comparable to the cluster analysis. In the Principal Component Analysis (PCA), for RAPD the first three components explained 65.86% of the total variation, with 53.21% explained by the first component and 7.23% by the second component, whereas for SSR the first three components explained 68.98% of the total variation, with 41.27% explained by the first component and 17.71% by the second component. The correlation coefficient and the significance of the correlation of the matrices based on RAPD and SSR data tested by the Mantel test showed that non-significant correlation (r=0.45) existed between both matrices.
Keywords: Crossability; Indica rice; pollen tube; Fruit set; RAPD; SSR
Introduction
Hybridization is one of the most commonly used breeding methods for improvement, mainly of open pollinated and often cross pollinated crops. The genetic improvement through hybridization and seed selection has been the main objective in the breeding programmes in rice. Inter-Varietal crosses have been used almost exclusively in the development of varieties by hybridization. The process of pollination and pollen germination leading to fertilization determines seed setting, and these processes are negatively affected by high temperature stress coinciding with a thesis [1]. Shi Qiang [2] reported that the rice pollen grain starts to germinate at 2min after pollination and the pollen tube penetrated stigma into style in 5-10 minutes, 30 minutes later the end of pollen tube reached the bottom of ovary, and only some pollen tubes arrived at embryo sac at 40 minutes after pollination. Variation in pollen tube growth rates in the pistil is frequently cited as a phenotypic manifestation of differences in gametophytic quality, leading to differences in the reproductive success among male gametes [3,4]. Jaitly, Khanna [5] reported that inadequate pollination, low % pollen germination and to some extent slow pollen tube growth and pollen tube abnormalities affect crossability in inter varietal crosses and the backcrosses in Oryza sativa accessions.
RAPD marker was first described by Williams, et al. (1990). Usually decamer primers are used to amplify the homologous sites of the target genomes. Polymorphisms are detected as presence or absence of bands. These markers have been used widely in many species because of their applications without prior sequence information. However, RAPD is very sensitive to reaction conditions and dominant in nature. Simple sequence repeat is an important tool for genetic variation identification of germplasm [6,7]. SSR markers have some merits such a quickness, simplicity, rich polymorphism and stability, thus being widely applied in genetic diversity analysis, construction of fingerprints [8,7], genetic purity test (Peng, et al. (2003)) and analysis of germplasm diversity [7,9,10] and utilization of heterosis, especially in identification of species with closer genetic relationship. Kibria et al. [11] studied molecular marker based genetic diversity analysis in aromatic rice genotypes by both SSR and RAPD markers through Marker Assisted Selection (MAS). They found that SSR markers are more effective in getting higher genetic diversity; however OPA 02 and 67 AB10G7 (RAPD) primers gave 100% polymorphism.
Materials and Methods
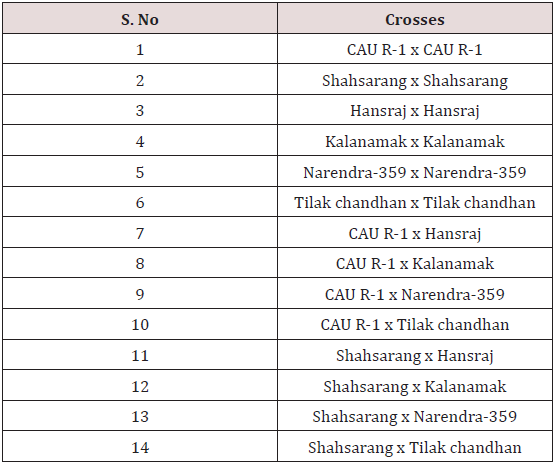
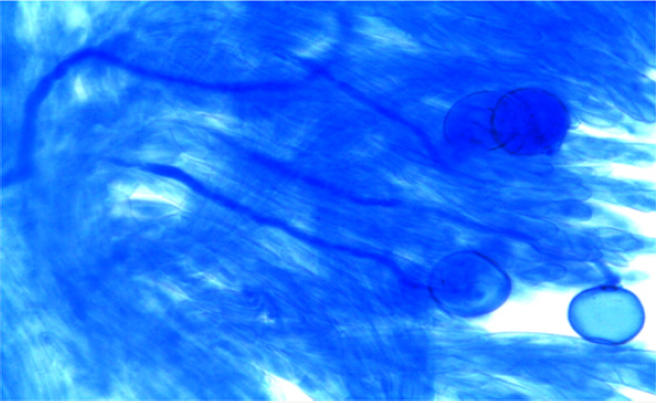
The experimental material used in the present study comprised of seventeen cultivated indica varieties of Oryza sativa L.viz. Pant dhan-10, Pant dhan-11, Pant dhan-12, Pant dhan-14, Pant dhan- 16, Pant dhan-17, Pant dhan-18, Pant dhan-19, Hansraj, Tilak chandhan, Kalanamak, KRH-2, CAUR-1, Shahsarang, Narendra-359, Basmati-370, Govind (Table 1). CAU R-1 and, Shahsarang were taken as female while Hansraj, Kalanamak, Narendra-359 and Tilak chandhan were taken as male. Emasculation was done in the morning and evening hours in a few selected florets from randomly selected plants. For each cross 15 panicles were randomly chosen from plants. Pollinations were performed from February to April and care was taken to avoid any damage to the stigma or ovaries. Spikelets from the top of the main axis of panicles, the primary rachis, as well as those belonging to the secondary and tertiary ones were detached, taking care that at least 35-45 florets from well defined portions of the panicle were retained; the florets were emasculated when the anthers were still pale green. The next day when the stigmas were feathery and receptive the pistils were hand pollinated with pollen from dehiscing anthers of the male parent. Eight to ten spikelets were taken at random from seven parental varieties and kept in vials containing 70% ethanol. The anthers from spikelets were squashed in a drop of 2% acetocarmine and observed under the microscope. The pollen grains which absorbed stain were classified fertile and those that did not absorb stain were classified sterile. The size of the pollen grain was measured with the help of a micrometer. In order to observe pollen germination on the stigma, pollen tube development in the style and entry of tubes into ovules, the spikelets were detached after 10 minutes and 60 minutes following hand pollination and fixed in 1:3 glacial acetic acid alcohols for 24 hours for further use. For further studies the spikelets were rinsed in distilled water and pistils were separated from the spikelets after which they were kept in a drop of 1N HCl for 10-15 minutes. They were again rinsed in distilled water and stained in cotton blue [12]. The pistils were then rinsed in distilled water and mounted in pure lactic acid. The pollen grains and pollen tubes stained deep blue.
Genomic DNA from cucumber leaves was isolated using CTAB method of Doyle, Doyle [13]. Young actively growing leaves of 15- 20 days old plants were collected and used for DNA extraction. The quantification of DNA were done by staining DNA with ethidium bromide after electrophoresis in 0.8% agarose gel at 80V for 1 hour in TBE buffer (0.04M Tris borate, 0.001M EDTA, pH 8.0) using known DNA concentration standards. One per cent agarose gel was prepared by dissolving appropriate amount of agarose in 1 X TBE buffer for RAPD markers while 2% agarose was prepared for SSR markers. EtBr was added to a final concentration of 2μl/ ml and mixed well. The melted agarose was poured into a gel mould and the gel was mounted in an electrophoresis. A pre run of 15 minutes at 50 volts was given to the gel. The gel loading dye was mixed with DNA samples in 1:1 ratio and loaded in the gel with a micropipette. Electrophoresis was done at 90V for 1-2hrs. The gel was visualized and photographed in a Gel Documentation system. Molecular weights of bands were estimated by using 1Kb ladder for RAPD and 100bp for SSR. The homology of bands was based on distance of migration in the gel. RAPD and SSR amplicons obtained from each entry were resolved as multiple and a single band on the agarose system, respectively and the data set were used to calculate pair wise similarity coefficients following Jaccard [14]. The similarity matrices constructed were subjected to cluster analysis by unweighted pair group method of arithmetic average (UPGMA) analysis to generate dendrogram. These computations were performed using NTSYS-PC ver. 2.02 j, Exeter Software [15]. Mantel’s correlation test was performed by calculating correlations between Jaccard’s similarity coefficients and cophenetic values for each pair of comparisons [16]. The raw data matrix was used to calculate correlations between variables. The correlation matrix was subjected to “Eigen” vectors analyses, following which the principle components were extracted using the “Projection” module in NTSYS-PC. The first three most important PCA were used to construct a three dimensional plot of the accessions.
Result and Discussion
Pollen fertility
Pollen fertility was recorded in all the six parents. The fertile pollens picked up the acetocarmine stain and were stained red.
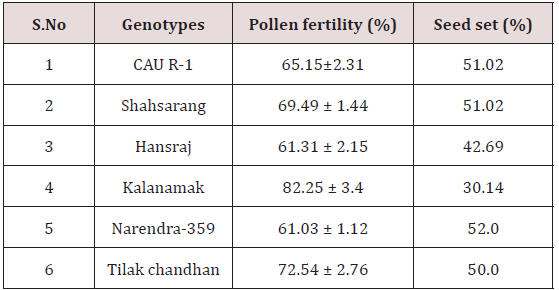
The variety Kalanamak had the maximum number of fertile pollen (82.25%) whereas the variety Narendra-359 had the least number (61.03%) (Table 2).
Pollen grain size
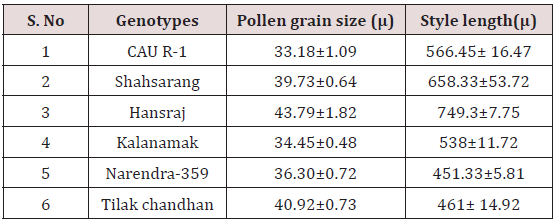
The size of the pollen grain did not show much difference among the parents. The diameter of the pollen grain size ranged from 34-44μ. Among the parents (Table 3) the pollen grains of Hansraj (43.79μ) were the largest and those of CAU R-1 were the smallest (33.18μ).
Pollen germination
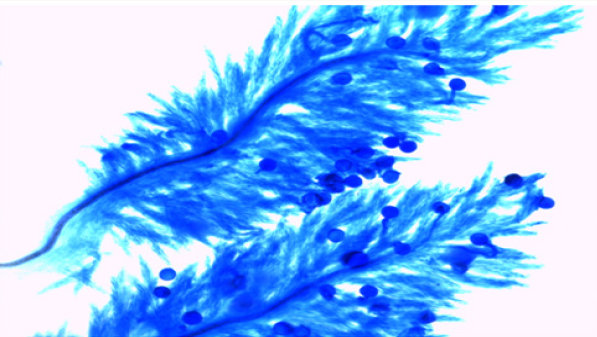
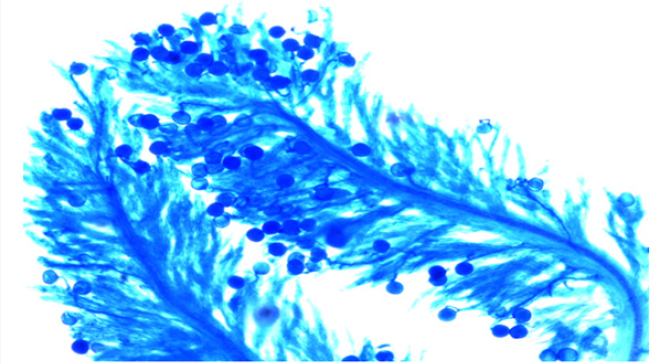
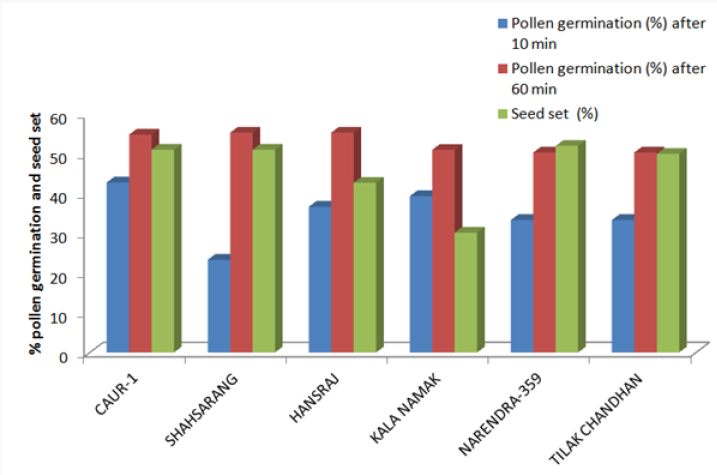
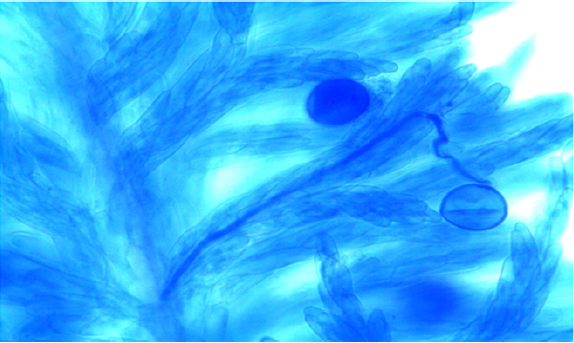
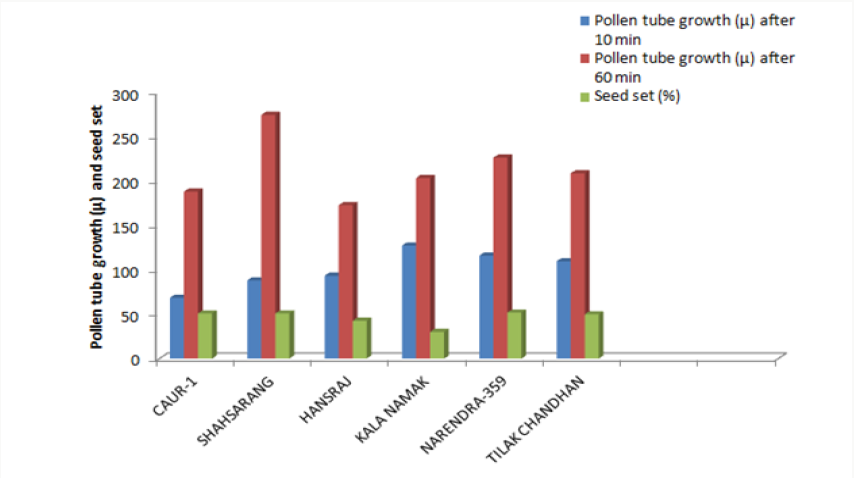
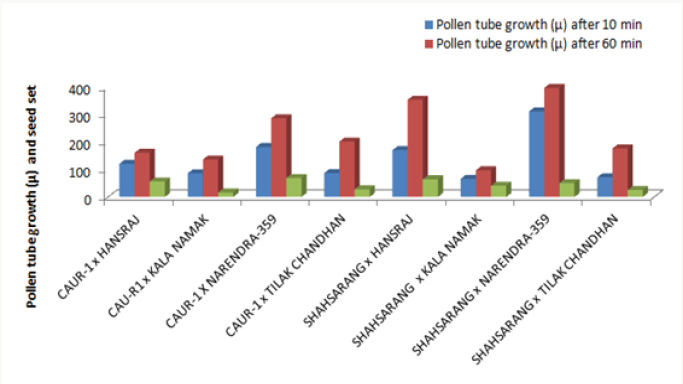
The onset of pollen germination did not show much variability among the parents. The least pollen germination percentage among parents after 10 min. was recorded in Shahsarang (23.33%) and the highest was in CAU R-1 (42.78%) whereas after 60 min of pollination Shahsarang has the highest pollen germination (55.67%) and Narendra-359 has the lowest (43.67%). Among the crosses, after 10min Shahsarang x Tilak chandhan has the lowest germination percentage (24.33%) and Shahsarang x Hansraj (54%) and has the highest. After 60 min. CAU R-1 x Tilak chandhan (47.67%) has the lowest and again Shahsarang x Hansraj (83.67%) has the highest germination percentage (Figures 1-9).
Correlation
The correlation studies were done for the pre fertilization factors in the inter varietal crosses performed for the seed set. A positive correlation of seed set with pollen tube growth after 60 min was established. A positive correlation with pollen germination was established which was nonsignificant at 5% level of significance (Table 4).
RAPD Analysis
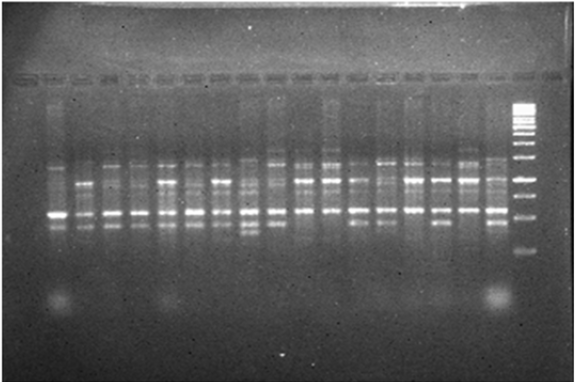
All the 17 cultivars were subjected to PCR amplifications using 14 RAPD primers. A total of 78 amplification products were scored in the 17 cultivars with different primers, which exhibited an overall 92% polymorphism (Table 5). The average numbers of amplification products formed were 5.57 with a maximum of 8 (OPB 1; OPD-06; OPF 14) and a minimum of 2 (OPK 10). The size of the amplification products varied in case of each primer and the range was 0.10 kb to 1.85kb. In general, the extent of polymorphism found was high. Eight out of 14 primers showed 100% polymorphism. Three primers (OPB 1; OPD-06; OPF14) were found to be most polymorphic whereas OPK 04 was the least polymorphic primer (Table 5). The data obtained from RAPD analysis were subjected to UPGMA analysis to find out the relationship between the cultivars analyzed. The value of Jacaard’s similarity coefficient ranged from 0.284 to 0.766 with the average value of 0.526 (Figure 10).
Table 5: Sequence, Total no. of amplification product (n), Total no of polymorphic products (P), percentage of polymorphism (% P) of RAPD markers.
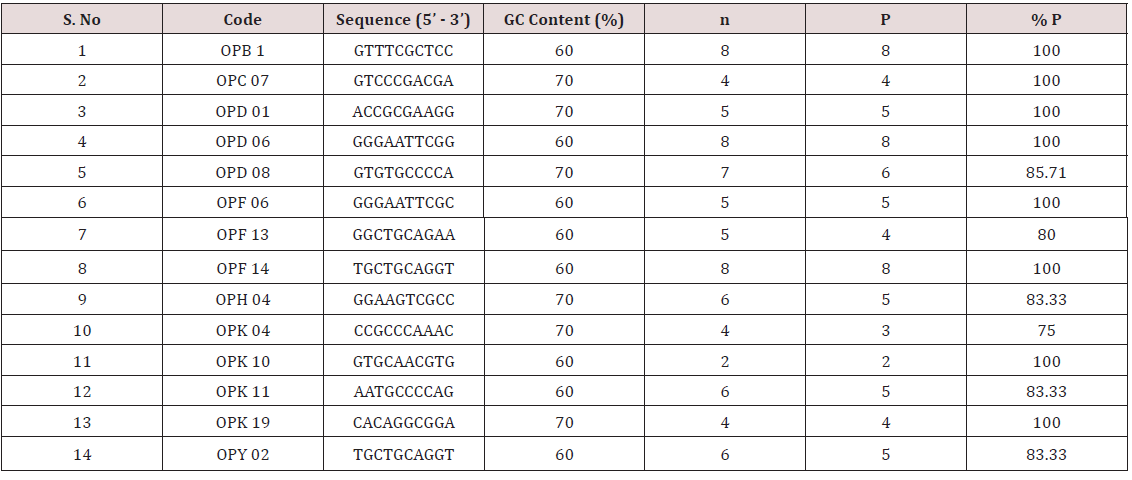
Figure 11: Phenogram generated using UPGMA analysis showing relationship between 17 cultivars of rice using RAPD markers.

Figure 11 shows the clustering pattern obtained from the UPGMA analyses of the data. Overall, four distinct clusters were formed. Three cultivars (Pant dhan 10, Pant dhan 14 and Govind) grouped in cluster IV and appear to be the most distinct from all others. Basmati 370 and Narendra 359 were present in cluster I. Cluster II comprises of 11 cultivars. Cultivars within cluster II are further grouped in three sub- clusters. The first sub cluster comprises of two cultivars, Tilak chandan and Kalanamak and both of these are landraces. Pant dhan 12, Pant dhan 16 and Pant dhan 18 forms a different sub cluster in cluster II. CAU R 1 and Shahsarang from North-east region and four other cultivars are present in another sub cluster. Cluster III comprised of a single cultivar i.e. Pant dhan 11. The Goodness-of-Fit of the UPGMA dendrogram generated with RAPD data were tested by 2-Way Mantel test [16]. High support for clustering patterns was observed for the cluster with Matrix correlation (r) as 0.82.
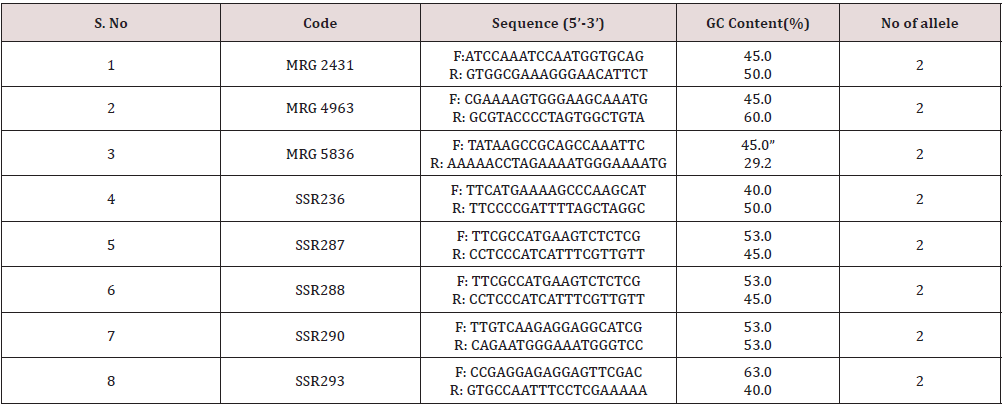
In the Principal Component Analysis (PCA) (Figure 12), the first three components explained 65.86% of the total variation, with 53.21% explained by the first component and 7.23% by the second component. In the three-dimensional plot the grouping pattern of Kalanamak, Tilak chandan and Narendra 359 were different as compared to the UPGMA cluster analysis. For SSR analyses, out of 8 primer pairs used for the genetic diversity analysis, 8 were found to be polymorphic. The polymorphic primers generated a total of 16 alleles. All 8 primers had two alleles (Table 6). The data obtained from SSR analysis were subjected to UPGMA analysis to find out the relationship between the cultivars analyzed. The value of Jacaard’s similarity coefficient ranged from 0.071 to 1 with the average value of 0.396 (Figure 13).
Figure 12: Phenogram generated using UPGMA analysis showing relationship between 17 cultivars of rice using RAPD markers.
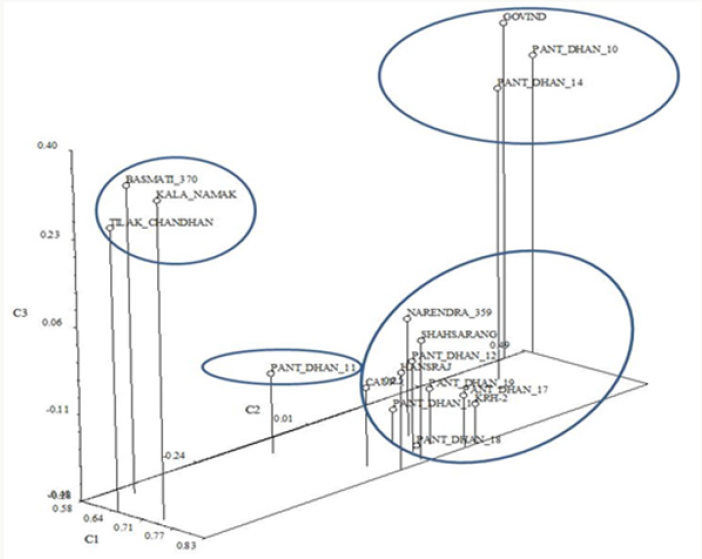
Figure 13: Phenogram generated using UPGMA analysis showing relationship between 17 cultivars of rice using RAPD markers.
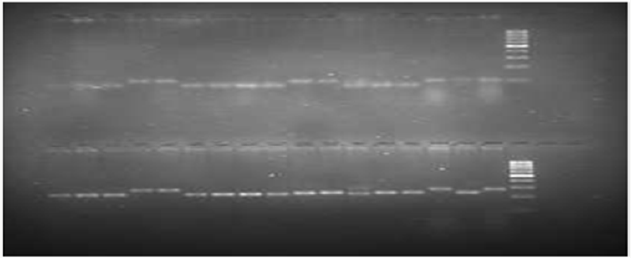
Figure 14: Phenogram generated using UPGMA analysis showing relationship between 17 cultivars of rice using SSR markers.
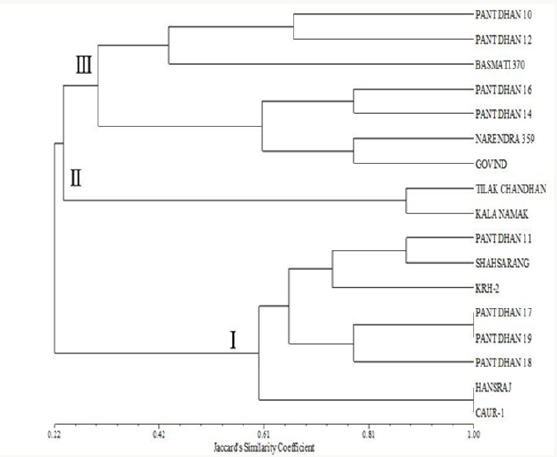
Figure 14 shows the clustering pattern obtained from the UPGMA analyses of the data. Overall, three distinct clusters were formed. Two cultivars (Tilak Chandan and Kalanamak) grouped in cluster II. Cluster I comprises of 8 cultivars. Cultivars within cluster I are further grouped in three sub clusters. The first sub cluster comprises of two cultivars, Hansraj and CAU R1. Pant dhan 17, Pant dhan 18 and Pant dhan 19 forms a different sub cluster. KRH-2, Pant dhan 11 and Shahsarang were present in another sub cluster. Cluster III comprised of 7 cultivars. Cultivars within cluster III are further grouped in two sub clusters. The first sub cluster comprises of three cultivars, Basmati 370, Pant dhan 10 and Pant dhan 12. Pant dhan 16, Pant dhan 14, Narendra 359 and Govind were present in another subcluster.
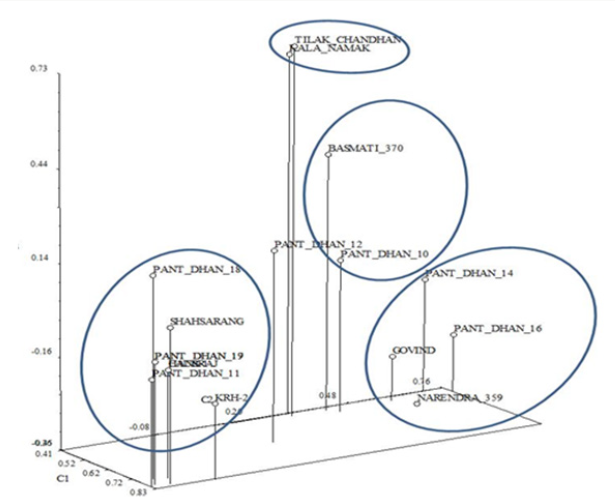
The Goodness-of-Fit of the UPGMA dendrogram generated with RAPD and SSR data were tested by 2-Way Mantel test [16]. High support for clustering patterns was observed for the cluster with Matrix correlation (r) as 0.92. In the Principal Component Analysis (PCA) (Figure 15), the first three components explained 68.98% of the total variation, with 41.27% explained by the first component and 17.71% by the second component. In general, the three dimensional plot grouping pattern, except for Pant dhan 12, was comparable to the UPGMA cluster analysis. The correlation coefficient and the significance of the correlation of the matrices based on RAPD and SSR data tested by the Mantel test showed that non-significant correlation (r=0.45) existed between both matrices.
Figure 15: Three-Dimensional plot of first three principal components extracted by Principal Component Analysis of 16 SSR amplification products from the SSR analysis of 17 rice cultivars.
References
- Satake T, Yoshida S (1978) High temperature induced sterility in indica rice at flowering. Japanese Journal of Crop Science 47(1): 6-10.
- Shi Qiang C, Zhong W, Man Xi L, Zhao Wei X, Hui Hui W (2008) Pollen grain germination and pollen tube growth in pistil of Rice. Rice Science 15(2): 125-130.
- Ottaviano E, Sari Gorla M, Mulcahy DL (1980) Pollen tube growth rates in Zea mays: Implications for genetic improvement of crops. Science 210(4468): 437-438.
- Singh M, Khanna VK (1988) Effect of gamma radiations on the crossability of wheat, Triticale and rye on meiosis, pollen grain germination and pollen tube growth. Cytologia 53: 123-130.
- Jaitly A, Khanna VK (1995) Pollen germination, pollen tube growth and seed set in inter varietal and backcrosses of F1 in Oryza sativa. B Sharma (Eds.); Genetic Research and Education: Current Trends and the Next Fifty Years. Ind Soc of Gen & Pl Breeding N Delhi, India, pp. 814-821.
- Powel W, Morgante M, Andre C, Hanafey M, Vogel J, et al. (1996) Comparison of RFLP, RAPD, AFLP and SSR markers for germplasm analysis. Mol Breed 2: 225-238.
- Ma H, Yin Y, Guo ZF, Cheng LJ, Zhang L, et al. (2011) Establishment of DNA fingerprinting of Liaojing series of japonica rice. Middle-East Journal of Scientific research 8(2): 384-392.
- Xiao XY, Wang YP, Zhang JY, Li SG, Rong TZ (2006) SSR marker based genetic diversity fingerprinting of hybrid rice in Sichuan, China. Chin J Rice Sci 20: 1-7.
- Zhou HF, Xie ZW, Ge S (2003) Microsatellite analysis of genetic diversity and population genetic structure of a wild rice (Oryza rufipogon Griff) in China. Theor Appl Genet 107(2): 332-339.
- Jin L, Lu Y, Xiao P, Sun M, Corke H, et al. (2010) Genetic diversity and population structure of a diverse set of rice germplasm for association mapping. Theor Appl Genet 121(3): 475-487.
- Kibria K, Nur F, Begum SN, Islam MM, Paul SK, et al. (2009) Molecular marker based genetic diversity analysis in aromatic rice genotypes using SSR and RAPD markers. Int J Sustain Crop Prod 4(1): 23-34.
- D’Souza L (1972) Staining pollen tubes in styles of cereal with cotton blue: Fixation by ethanol-lactic acid for enhanced differentiation. Stain Tech 47(2): 107-108.
- Doyle JJ, Doyle JL (1990) Isolation of plant DNA from fresh tissues. Focus 12: 13-15.
- Jaccard P (1908) Nouvelles researches surla distribution florale. Bull Soc Vaudoise Sci Natl 44(163): 223-270.
- Rolf FJ (1993) NTSYS-PC, Numerical Taxonomy and Multivariate Analysis system. Exeter Software, New York, USA.
- Mantel N (1967) The detection of disease clustering and a generalized regression approach. Cancer Res 27(2): 209-220.

Top Editors
-

Mark E Smith
Bio chemistry
University of Texas Medical Branch, USA -

Lawrence A Presley
Department of Criminal Justice
Liberty University, USA -

Thomas W Miller
Department of Psychiatry
University of Kentucky, USA -

Gjumrakch Aliev
Department of Medicine
Gally International Biomedical Research & Consulting LLC, USA -

Christopher Bryant
Department of Urbanisation and Agricultural
Montreal university, USA -

Robert William Frare
Oral & Maxillofacial Pathology
New York University, USA -

Rudolph Modesto Navari
Gastroenterology and Hepatology
University of Alabama, UK -

Andrew Hague
Department of Medicine
Universities of Bradford, UK -

George Gregory Buttigieg
Maltese College of Obstetrics and Gynaecology, Europe -

Chen-Hsiung Yeh
Oncology
Circulogene Theranostics, England -
.png)
Emilio Bucio-Carrillo
Radiation Chemistry
National University of Mexico, USA -
.jpg)
Casey J Grenier
Analytical Chemistry
Wentworth Institute of Technology, USA -
Hany Atalah
Minimally Invasive Surgery
Mercer University school of Medicine, USA -

Abu-Hussein Muhamad
Pediatric Dentistry
University of Athens , Greece

The annual scholar awards from Lupine Publishers honor a selected number Read More...


