Lupine Publishers Group
Lupine Publishers
Menu
ISSN: 2637-4676
Research Article(ISSN: 2637-4676) 
FT-NIR Method to Identified Sugar Content in Honey Volume 9 - Issue 3
Mustafa A Al-Shamali*, Barak Al-Azmi and Fatima A Ali
- Petroleum Research Center, Kuwait Institute for Scientific Research, Kuwait
Received: April 12, 2021; Published: April 23, 2021
Corresponding author: Mustafa A Al-Shamali, Petroleum Research Center, Kuwait Institute for Scientific Research, Kuwait
DOI: 10.32474/CIACR.2021.09.000315
Abstract
A Fourier transformer near-infrared (FT-NIR) method has been created for analyzing the number of sugars (glucose, fructose, and sucrose) in honey that needs less sample preparation and is much faster than the conventional HPLC or FT-IR(Mid) technique. For this new method, the sample weight is not a critical parameter anymore. The method requires just as much sample as is needed to fill the 8mm sample vial. The FT-NIR model for predicting sugar in honey was developed from 55 syrup samples that contained glucose, fructose, and sucrose mixtures in different percentages as well as 8 honey samples. The amount of sugar in the 8 honey samples was determined by HPLC. The quality of the prediction model was checked by cross-validation. For the set of reference samples (55 syrups and 8 kinds of honey) the model has a high data correlation constant (R2) and low Root Mean Square Error of Cross-Validation (RMSECV <1). With time, the model can be updated each time the sugar content in a new honey sample is independently (other than FT-NIR prediction) measured. Our studies on several honey samples with unknown sugar content have shown that FT-NIR is very suitable for screening of honey and the obtained results were within the limit of the international standard results for sugar in honey (fructose≤60%, glucose≤45% for blossom Honey). The FT-NIR prediction has a very high reproducibility since fewer human errors caused by sample preparation can happen.
Introduction
Honey contains a lot of substances that good for human health. Honey has been used as food, food additive, medicine, and medicine additive from BC until these days life [1-5]. Honey contains many kinds of sugars such as Glucose, Fructose, and Sucrose. Sometimes it could contain other sugar-like maltose. Usually, sugar content is registered on the food label. The importance of food label for different kind of people such people who live on a certain diet or people who need to have certain diet because their illness, encourage scientist to develop methods that can measure the quantity of a different kind of substance in the food such as (different sugar percents in honey). Food label usually a result of many experiment which need chemical solvent to extract the molecule of interest from the honey. Some solvent consider harmful to the nature.
In this paper, a method for analyzing Glucose, Fructose, and Sucrose in Honey by FT-NIR (sample compartment) is introduced. The method will use water as a solvent for method producing, no solvent needed for testing the sample after the method was established. For this method, 55 standers syrups contain Glucose, Fructose, Sucrose with 8 Honey standers are used to create the calibration curve for the model. The model results are compared with the HPLC [6] result and it shows a good agreement. The partial least square numerical method was used to create the calibration curve [7].
Theoretical and background
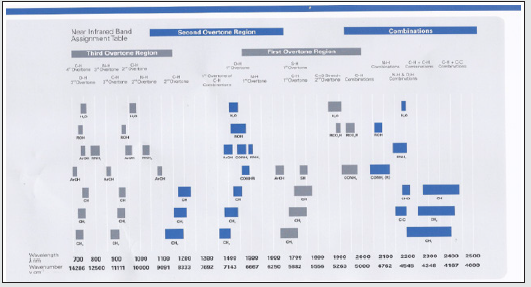
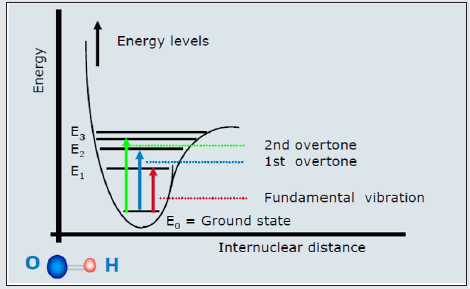
The NIR radiation energy excites the electrons from the ground state to the higher energy excited state known as the overtone excited state. The NIR excites the electron to the level above the MIR (Fundamental) as in (Figure 1).
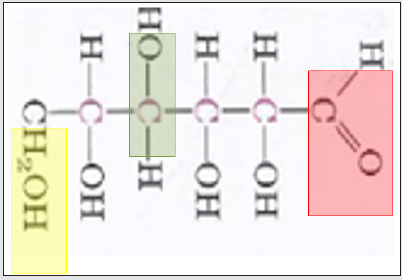
NIR overtone region is used to identify the molecule of interest such as Glucose or other sugars. In sugars like Glucose, the overtones of COH, CH2O, and CH will be used in (Figures 2,3), and the same will done for other sugars. The fundamental vibration will not be used here because is related to MIR regions as in Figure 1.
After the sugars spectra are collected, then it will be analyzed by the OPUS Quant TM software that uses partial least square (PLS) to create the calibration curve that is required to develop the NIR new method.
The method or the model in the NIR needs to have a good data correlation constant (R2), small root mean square error, and good rank value (5 to 15). The model after it created, it needs to be tested with the honey sample that their concentration of sugar content is known. The test sample is used to check the accuracy and precession of the model. The method is approved when the test sample shows the same concentration on the FT-NIR7.
Figure 1: FT-MIR is the Fundamental vibration. The 1st and 2nd overtones excitation are For FT-NIRl.
Equipment
FT-NIR MPA from BRUKER
Experimental
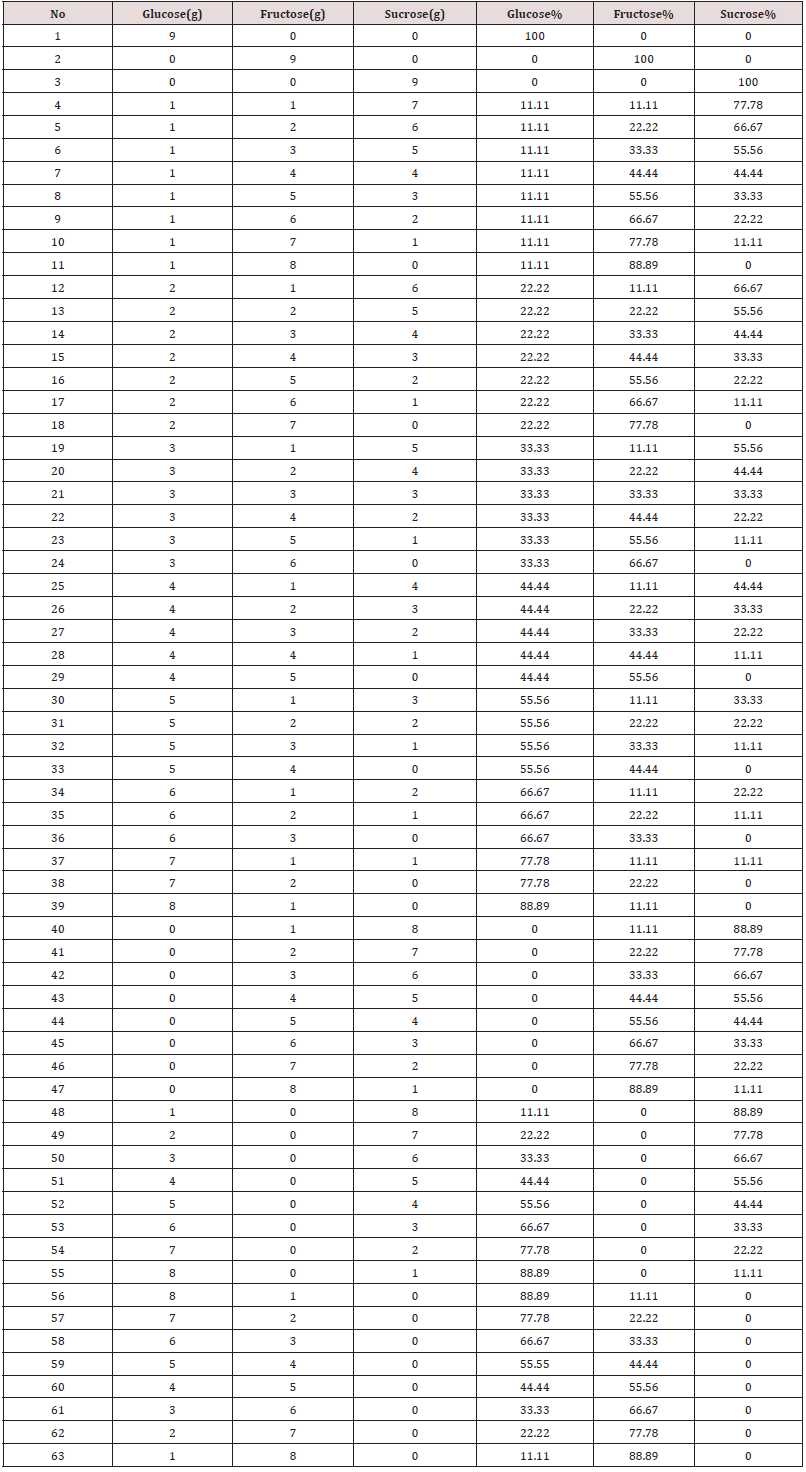
A mixture of standers sugar (Glucose, Fructose, and Sucrose) is weighted and prepared as shown in Table 1. The final weight of the sugar mixture is 9g. The sugars mixture was poured into a 4 cm diameter test tube which was placed in a hot bath (boiling water). 3ml of distillate water was added to the sugar mixture. The mixture was stirred with a glass rod until all the sugar was dissolved completely in the water to form a syrup. The syrup was cooled to room temperature for NIR measurement.
The standards mixture and the 8 Honey samples with known concentration were measured by using the BRUKER MBA NIR Instrument. NIR glass cylindrical 8 mm vial is filled with either a prepared syrup or honey. The filled vial is placed in the sample compartment and then the measurement is controlled by the OPUS and OPUS Lab software. Distilled water is used as a background for all honey and sugar standers and samples.
Result and Discussion
Figure 4: The calibration curve for the Fructose has 0.998 R2 the data are very close to slope line. First derivative applied on the original spectra to produce the a good correlated data.

Figure 5: Root mean square error of cross-validation RMSECV of fructose versus the Data rank for fructose. Blue dot for suitable RMSECV and Rank. The method was selected at lowest root mean square error cross validation.
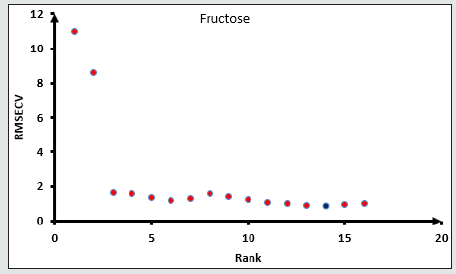
Figure 6: The calibration curve for the Glucose has 0.9989 R2 the data are very close to slope line. Multiplicative Scattering correction applied on the original spectra to produce the a good correlated data.
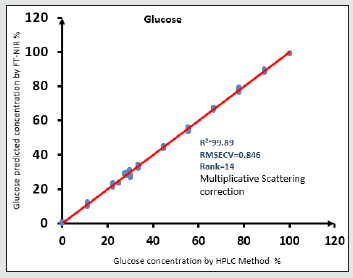
Figure 7: Root mean square error of cross-validation RMSECV of glucose versus the Data rank for glucose. Blue dot for suitable RMSECV and Rank. The method was selected at lowest root mean square error cross validation.
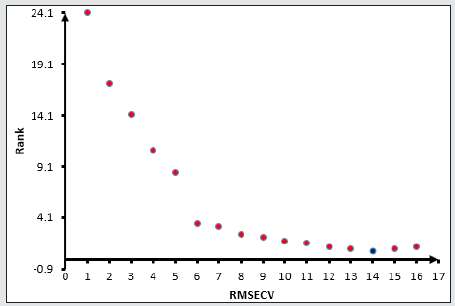
Figure 8: The calibration curve for the sucrose has 0.9992 R2 the data are very close to slope line. First derivative pluse straight line subtraction applied on the original spectra to produce the a good correlated data.
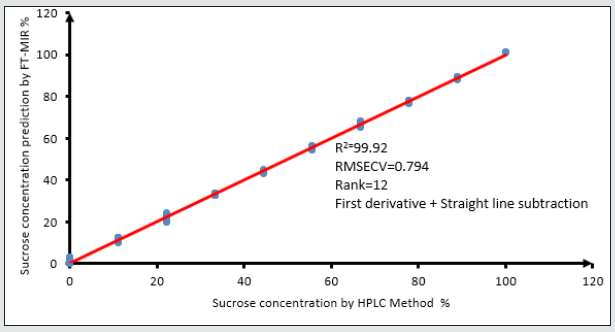
Figure 9: Root mean square error of cross-validation RMSECV of sucrose versus the Data rank for sucrose. Blue dot for suitable RMSECV and Rank. The method was selected at lowest root mean square error cross validation.
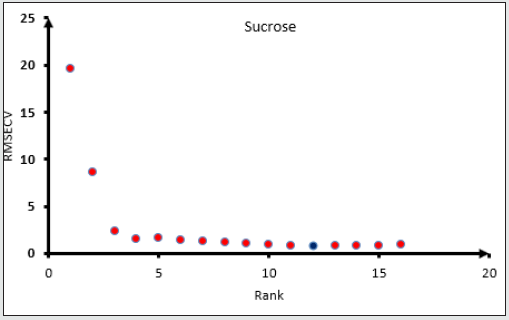
All the spectra of the honey and mixture standards ware entered in the OPUS Quant software with their known concentration for Partial Least Square (PLS) analysis. The model for each sugar will be chosen according to the lower root mean square error of crossvalidation and the maximum data correlation factors. The model then will be tested against a known concentration sample. When the model shows a good performance with known samples, the model will be chosen. The higher rank of the data did not lead to the right method however the rank will be chosen according to the lowest RMSECV as the first Factor, higher R2 as a second factor, and passing the known sample test as the final factor that needs to be checked (Figures 4,5) show the procedures of choosing the right model for fructose and Glucose Figures 6,7 and sucrose Figures 8,9. The blue point in each graph shows the method of choice at lowest RMSECV. The graphs are drawn after data optimization is done on the database of each sugar.
After the optimization is done for the three kinds of sugars, the model results fulfill the following validation criteria: I- first for fructose the correlation coefficient (R2)=99.88, root mean square error of cross-validation (RMSECV)=0.875, equation rank (R)=14, the bias of data set=0.0351 as shown in fig.4. Optimization selective spectral regions for fructose are : 11644.7 - 99433.7 cm-1; 8242.7-7023.8 cm-1; 6549.4-5299.7 cm-1.
II- glucose R2)=99.89, RMSECV=0.846, R=14, bias of data set=0.0222 as shown in Figure 8. Optimization selective spectral regions for glucose are : 12493.2 – 10792.2 cm-1; 9099-7023.8 cm-1.
Finally, for sucrose R2=99.92, RMSECV=0.794, R=12, bias of data set=0.00825 as shown in fig 8. Optimization selective spectral regions for sucrose are : 12493.2 – 11640.8 cm-1; 10796.1-8242.7 cm-1; 6549.4-5299.7 cm-1.
The model is tested against commercial honey samples that are not part of the model and it shows a good match with the FTNIR model with some small difference as in Table 2.
Conclusion
A NIR method is established for the analysis of sugars content in honey samples. NIR is faster and time consumable and has less cost than convenient HPLC method with high accuracy. NIR model can be updated each time a new honey sample arrives, and data independently measured are available. Reduce the dependency on the Honey sample to create a method on NIR. NIR produces direct results so no further calculation is needed. NIR can determine the concentration of three types of sugar in one experiment. The method did not depend on any harmful solvent and it is naturally friendly.
References
- Stefan Bogdanov. Honey in medicine. bee-haxagon.net
- Rahul Agrawal, Fernando Gomez-Pinilla (2012) Metabolic syndrome' in the brain: deficiency in omega-3 fatty acid exacerbates dysfunctions in insulin receptor signalling and cognition. The Journal of Physiology 590(10): 2485-2499.
- Kimber L Stanhope, Jean-Marc Schwarz, Nancy L Keim, Steven C Griffen, Andrew A Bremer, et al. (2009) Consuming fructose-sweetened, not glucose-sweetened, beverages increases visceral adiposity and lipids and decreases insulin sensitivity in overweight/obese humans. J Clin Invest 119(5): 1322-1334.
- MM Cavia, MA Fernandez-Muino, E Gomez-Alonso, MJ Montes-Perez, JF Huidobro, et al. (2002) Evolution of Fructose and Glucose in Honey over 0ne year: Influence of induced granulation. Food Chemistry 78(2): 157-161.
- Marathaki E, Pollard MA, Curzon ME (1995) The effect of sucrose in medicines on plaque pH. Int J Paediatr Dent 5(4): 231-235.
- S Ouchemoukha, P Schweitzerb, M BachirBeya, H Djoudad-Kadjia, H Louailechec (2010) HPLC sugar profiles of Algerian honeys. Food Chemistry 121(2): 561-568.
- Jörg-Peter Conzen Multivariate Calibration. Bruker optik GmbH.

Top Editors
-

Mark E Smith
Bio chemistry
University of Texas Medical Branch, USA -

Lawrence A Presley
Department of Criminal Justice
Liberty University, USA -

Thomas W Miller
Department of Psychiatry
University of Kentucky, USA -

Gjumrakch Aliev
Department of Medicine
Gally International Biomedical Research & Consulting LLC, USA -

Christopher Bryant
Department of Urbanisation and Agricultural
Montreal university, USA -

Robert William Frare
Oral & Maxillofacial Pathology
New York University, USA -

Rudolph Modesto Navari
Gastroenterology and Hepatology
University of Alabama, UK -

Andrew Hague
Department of Medicine
Universities of Bradford, UK -

George Gregory Buttigieg
Maltese College of Obstetrics and Gynaecology, Europe -

Chen-Hsiung Yeh
Oncology
Circulogene Theranostics, England -
.png)
Emilio Bucio-Carrillo
Radiation Chemistry
National University of Mexico, USA -
.jpg)
Casey J Grenier
Analytical Chemistry
Wentworth Institute of Technology, USA -
Hany Atalah
Minimally Invasive Surgery
Mercer University school of Medicine, USA -

Abu-Hussein Muhamad
Pediatric Dentistry
University of Athens , Greece

The annual scholar awards from Lupine Publishers honor a selected number Read More...


