Lupine Publishers Group
Lupine Publishers
Menu
ISSN: 2637-4676
Research Article(ISSN: 2637-4676) 
Attitude And the Level of Consumer Information Towards the Safety of Agricultural Products (Vegetables and Fruits) / A Case Study Volume 10 - Issue 4
Safwan Abou Assaf* and Maya Al Abdala
- Socio Economic Directorate, Swaida Research Center, General Commission for Scientific Agricultural Research (GCSAR), Damascus, Syria
Received: April 10, 2023; Published: April 19, 2023
Corresponding author: Socio Economic Directorate, Swaida Research Center, General Commission for Scientific Agricultural Research (GCSAR), Damascus, Syria
DOI: 10.32474/CIACR.2023.10.000344
Abstract
The study aimed to determine the attitudes of consumers, their level of the information and the classification factors that influence towards the safety of agricultural products (Vegetables and Fruits) at the purchasing decision through a case study of workers at the Agricultural Scientific Research Center in the Swaida Governorate/Syria during 2021-2022. The data has been collected from a simple random sample of 170 observations. The classification factors have identified: Age categories, Gender, marital status, educational qualification and place of residence. The results showed that the education level has a statistically significant effect at the level of 0.01 on the overall mean of the attitudes of consumers towards the safety of the agricultural products, which was estimated at 2.2 according to the three-point Likert scale. The overall mean of the information level towards the safety of agricultural products was estimated about 2.73 according to the four-point Likert scale, and it differed significantly at the level of 0.01 with the effect of each of the second age category, gender and the place of residence. The largest percentage of the source of information about food safety is the Internet, at about 73.5%. 41% of the respondents indicated to the encouragement of home cultivation and irrigation with clean water, and stay away from using waste water to irrigate agricultural products with a percentage of 41% as well.
Keywords: Agricultural product safety; consumer Attitude; consumer information level; Likert scale
Introduction
Poor nutrition and the consumer’s lack of knowledge of the source of food cause many human diseases, On the other hand, the economic situation and other factors affect the consumer’s ability to buy food in quantity and quality [1]. Climate changes can harm food safety due to the increase in diseases and pests transmitted by agricultural products, and the rise in prices has a negative impact on the diversity of food and choices in front of the consumer due to its negative impact on purchasing power [2]. In a report of [3], it showed that food safety is part of food security and is essential to protect consumers from disease risks, that may be introduced at different stages of the food value chain starting right from production and all the way to retail and food preparation. There is a lot of previous research that studied the safety of food and agricultural products, and applied different analytical methodologies, where [4] showed in a reference study of about seventy scientific articles and books about consumer behavior towards product safety, and concluded that concerns have emerged in recent decades due to some Agricultural and industrial practices such as pesticides, fertilizers, irrigation and preservatives, which have led to changing consumers’ reactions and awareness in different behaviors. The study of [5] showed that the media are the most preferred for obtaining information about food safety, such as television and the Internet. Therefore, the study recommended intensifying educational programs on food safety to target groups that have lower degrees of awareness about the safety of food products. The finding of [6] showed the most important and significant factors that influenced on consumers’ WTP (Willingness-To-Pay) towards food products with “No Added MSG” labeling (flavor enhancer) are gender (female), household size, household income, family member with children below the age of 12, price levels and education level (university).In a study of [7] about food safety knowledge and practices of 270 women working in six faculties and institutions at Alexandria University, it showed insufficient knowledge and practices related to safety among all job categories, and the average score of the total safety knowledge of the sample was 67.4, And the most important factors that greatly affected the degree of knowledge are: the type of work, the place of shopping, exposure to previous diseases, and therefore the need to implement education programs about food safety frequently. The purpose of [8] was to identify health awareness level and sources of health information of Arab club players in Volleyball from a sample of 90 players, and processed the data by applying analysis of variance and the (Sidak Test) for multi-comparisons. The results showed that the response rate (awareness Health) was high, reaching 81%, and there were significant differences between the test items, and there were no significant differences for some variables, such as academic qualifications.
Research Problem and Importance
The increase of the population, the consider the demand for agricultural products to meet the requirements of food security, and the fluctuations in prices and high production costs, in addition to the lack of strict control and effective follow-up and with a goal for fast profits, all of this led to the application of some agricultural practices that do not consider the health of the consumer, we can mention some of them: Irrigation with waste water in its raw form, heavy chemical fertilization, whose effects appear largely in agricultural products, especially vegetables and fruits, as residual and accumulated traces of chemicals or heavy elements. Therefore, the importance of the research lies in estimating the amount of information and consumer attitudes towards the safety of agricultural products (Vegetables and Fruits) when making a purchase decision, where vegetables and fruits are the most consumed agricultural products and are linked to public health which is one of the basic issues.
Research Objectives
1) Estimating the attitudes of consumer toward the safety of fruit and vegetable products, and the influencing classification factors.
2) Determining the Level of Consumer information about vegetable and fruit products at the purchasing decision and the most important influencing factors.
3) Identifying the most important sources of consumer information about food safety, and the most important suggestions for obtaining clean and healthy agricultural products.
Research Materials and Methods
1) Data and study population: The study was conducted on a simple random sample as a case study for employees in the Agricultural Scientific Research Center in Swaida city/Syria during 2021-2022, and the sample size was (170) observations that representing 56% of the study population which amounted (304) employees. The data was collected through a questionnaire designed for the purpose of the study and was analyzed using the program (IBM SPSS Statistics 28).
Statistical Analysis Methods
1) Descriptive statistical analysis: such as frequencies, averages, percentages, and figures.
2) The three-point Likert scale [9] to estimate the attitudes of consumers towards the Safety of Agricultural Products, through five items of the scale were relied upon out of eight depending on Cronbach’s alpha coefficient and validity 0.70 and 0.84.
3) The four-point Likert scale [9] to estimate the Level of Consumer information, through twelve items of the scale depending on Cronbach’s alpha coefficient and validity 0.75 and 0.87.
4) Hotelling’s T-Squared test [10] to find out if there are significant differences between the weighted averages of items of the scale.
5) Sidak test [11] and [12] for pairwise comparisons between weighted averages.
6) One way analysis of variance method (One Way ANOVA) and the Least Significant Difference (LSD) test to determine the most important classification variables that significantly effect on the overall mean of the Attitudes and the level of the information towards the safety of agricultural products.
8. The Study Variables
1) Classification factors: age categories, gender, marital status, educational qualification and place of residence.
2) The dependent variable: the Overall mean of the Attitudes and the level of the information towards the safety of agricultural products.
Results and Discussion
First: Characterization of the classification variables
1) Age Categories
The age of the studied sample ranged between 22-59 years old, and the average was 42 years old. The sample was divided into three categories (up to 38 years old, from 39 to 45 years old, and over 45 years old). One Way ANOVA showed a statistically significant difference between the means within age categories at the 1% level (Table 1).
2) Nominal Variables
a. Gender: The percentage of females was 58.2%, while the males was 41.8% (Figure 1).
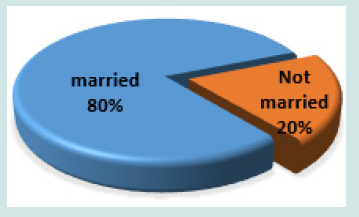
b. Marital status: The percentage of married people is 80%, and the remaining 20% (single, divorced, or widowed), Figure 2.
c. Educational Qualification: The sample members were distributed within different levels, as 41.2% of them completed only the principal education (9 years of education) who represented the largest percentage, followed by those who graduated from intermediate institutes (14 years of education) and they constituted 23% of the sample, followed by university graduates with a percentage of 15.3%. Then those who completed only secondary school with a percentage of 12.4%. Then the rest, 5.9% PhD and 2.9% masters. Figure 3.
d. Place of Residence: About 49.4% of the sample live in the city, then 38.8% live in the countryside, and the rest, about 11.8%, live in the outskirts, Figure 4.
Second: Consumer Attitudes towards the safety of fruit and vegetable products
Measuring the Attitude
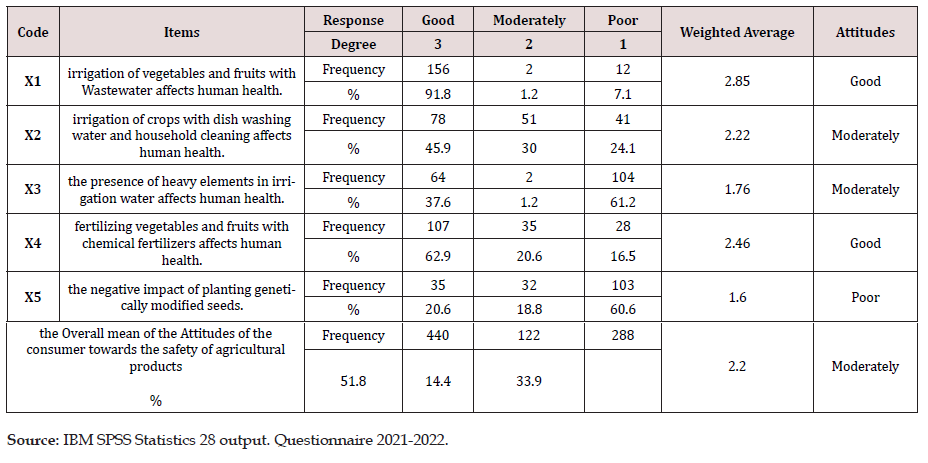
A three-point Likert scale was used, the attitude ranged between (good, moderately, poor) and three grades were given (3, 2, and 1), respectively. The Attitude level was classified based on the estimated weighted average as follows: (1-1.66) the Attitude is poor, and if it is between (1.67-2.33) the Attitude is moderately, and if it is between (2.34-3) then the Attitude is good, considering the distance is (2÷3 = 0.66). Table 2 shows that consumers’ Attitude towards the negative impact of planting genetically modified seeds is poor. The Attitudes towards: (irrigation of crops with dish washing water and household cleaning affects human health), (the presence of heavy elements in irrigation water affects human health) are Moderately. The Attitudes towards: (irrigation of vegetables and fruits with Wastewater affects human health), (fertilizing vegetables and fruits with chemical fertilizers affects human health) are good. The Overall mean of the Attitudes = Moderately.
Significance Test
Table 3 shows the results of applying the (Hotelling’s T-Squared) test, and there are statistically significant differences at 0.001 between the items of the consumer’s Attitudes scale towards the safety of agricultural products. In order to determine the items that are statistically significant in the differences, the Sidak test was applied for pairwise comparisons between the weighted averages. Table 4 shows the presence of statistical significance for all items except the third and fifth, and the highest average response to item (X1), then (X4).
Factors Affecting on the Overall Mean of the Attitudes
One way ANOVA test was applied to find out whether the Overall mean of the Attitudes of the consumer towards the safety of agricultural products differs according to the classification factors: age categories, gender, marital status, educational qualification and place of residence. The results showed that only the educational qualification had a significant effect at the 0.01 level, as shown in Table 5. By applying the Least Difference (LSD) test shown in Table 6, it was found that holders of doctorate and master’s degrees raise their degree of response towards the safety of agricultural products significantly higher than the rest of the education levels, and from the second column of the average response, it is clear that the value of the average response degree increases as the level of education increases.
Table 5: The results of the One-way ANOVA test on the Overall mean of the Attitudes of the consumer according to the Classification factors.

Table 6:Results of the Least Significant Difference (LSD) test for response averages according to the education level factor.

Third: Consumer Information Before Buying Agricultural Products
The Source of Vegetables and Fruits
89.4% of the consumer sample get directly what they need of vegetables and fruits from the markets (wholesale and retail markets), 10.6% from home production, 2.9% from farms directly.
Product Quality Indicators
These indicators were numerous, as 24.4% of the respondents linked product quality with price, so the higher of the product price is the better quality. While it was found that the morphological characteristics of the product such as smell, texture, color, and size were the indicators that determine the quality of the product for 44.3%, 44.7%, 45%, and 44.1% of the sample, and the judgment on the quality of the product from the perspective of the seller did not exceed 12.4% Of the sample.
Sterilizers
The sterilization of vegetables and fruits before consumption is a behavior followed by the majority of the sample, but there was a difference in the quality of the materials used in sterilization. Where about 68.8% and 42.4% of them use the natural materials such as vinegar and salt. And 10.6% use chemicals, while about 28.5% of the respondents who prefer to use only water without any extras.
Changes to the Product After Purchase
A large percentage of consumers, about 61.8%, noticed changes to the products shortly after purchasing them, which may be either morphological changes related to color, size, texture, wilting, smell, or taste, with a percentage of 41%, 35.2%, 23.8%, 18.1%, and 12.4%., 3.6%, respectively. Or biological changes associated with the appearance of mold and insect infestations, which constituted 21.9% and 1.9% of the sample.
The Effect of Pesticides on the Honey Quality
62.4% of the respondents confirm that the grazing of bees in fields which are controlled with chemical pesticides effects negatively on the quality of honey, the nutritional components and the morphological characteristics. Where about 51.9% of the respondents believed that the effect is mainly on the taste of honey. While 27.4% believe that the effect is limited to negative effects directly on bees. Figure 5 shows consumers’ view of the negative effect of pesticides on honey.
Fourth: Estimating the Level of Consumer Information Before Purchasing Agricultural Products
Composition of the Scale
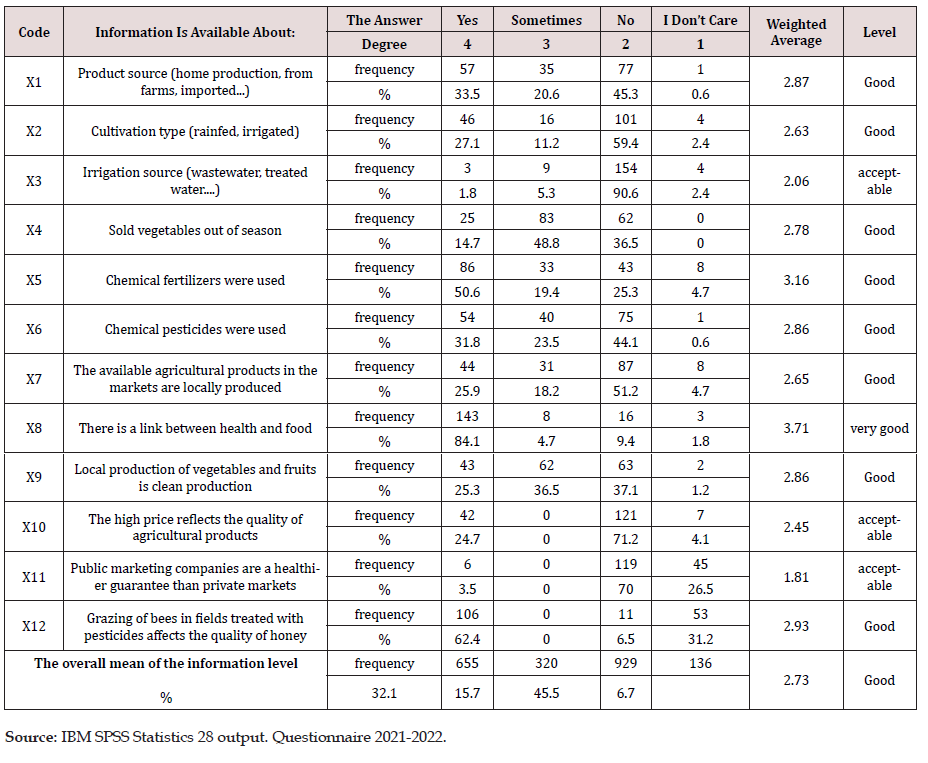
12 indirect questions were asked to the target sample related to information about agricultural products before the purchase decision. A four-point Likert scale was applied, The answers ranged between (yes, sometimes, no, I don’t care) and four degrees were given (4,3,2,1) respectively, and the levels of information were classified according to the scores after calculating the weighted average value as follows: if it is from 1-1.75, then the level of information is poor, and if it is between 1.76-2.51, then the level is acceptable, if it is from 2.52–3.27 the level is good and greater than 3.28, the level will be very good, considering the distance is (3÷4 = 0.75). The results showed that the overall mean of consumer information level about agricultural products is good, and no poor level was recorded for any of the items. Table 7 shows that only 25% of the scale items recorded an acceptable level, namely: Irrigation source (wastewater, treated water....), The high price reflects the quality of agricultural products and public marketing companies are a healthier guarantee than private markets. Only one item scored very good level which is: There is a link between health and food and the rest of the scale’s items recorded as a good level about 67% of the items.
Table 7:The level of consumer information about agricultural products when making a purchase decision.

Significance Test
Table 8 shows that there are statistically significant differences at 0.001 between the items of the consumer’s information levels scale about the agricultural products by applying the (Hotelling’s T-Squared) test. The Sidak test was applied for pairwise comparisons between the weighted averages in order to find out which of the items that are statistically significant in the differences. The results show that the weighted average of information level No. (11) which expresses (public marketing companies are a healthier guarantee than private markets) is significantly different at the level 0.01 from the rest of the weighted averages except for item No. (3) which expresses the level of consumer information about Irrigation source (wastewater, treated water....) where both were acceptable level. Table 9 shows the rest of the differences between the weighted averages and their statistical significance.
Factors Affecting on the Overall Mean of The Information Levels
The results of the application of the on-way ANOVA test to find out Whether the Overall mean of the information level of the consumer when purchasing agricultural products differs according to the aforementioned classification factors, it was found that there are statistically significant differences at the level of 0.01 attributed to each of the age categories, gender and place of residence shown in Table 10.
Table 10:The results of the One-way ANOVA test on the Overall mean of the information level according to the Classification factors.

Table 11:The results of the Least Significant Difference (LSD) test for the overall mean of information according to age, gender and place of residence.

The results of applying the Least Significant Difference (LSD) test shown in Table 11:
a. The overall mean of information for males is significantly higher at the level of 0.01 than for females.
b. The overall mean of information in the second age category is significantly higher at the 0.01 level than that of the first age category.
c. The overall mean of information of the consumer in the countryside is significantly higher at the level of 0.01 than that of the consumer in the city.
Fifth: The Most Important Sources of Consumer Information
It was found that the largest percentage of individuals’ information about food safety was sourced from the Internet, which amounted to about 73.5%, This is normal and justified due to the ease of access and the huge and varied information, in addition to other sources such as television, reading books and lectures by 34.7%, 16.5%, 7.1 %, respectively, as illustrated in Figure 6.
Sixth: Suggested Recommendations for Obtaining Clean and Healthy Agricultural Products
Despite of the difference in the attitudes of the researched sample and the multiplicity of their sources of information about the safety of food and agricultural products, from their point of view there are many procedures by which healthy agricultural products can be obtained, as:
a. Encouraging home cultivation by 41%, because of its role in achieving partial self-sufficiency and the possibility of obtaining products completely free of pesticides or chemical fertilizers.
b. Irrigate with clean water and avoiding the use of wastewater by 41%
c. Monitoring crop control operations and adhering to specific programs and avoiding randomness by 19 %.
d. Rationalization in the use of mineral fertilizers by 15%.
e. The use of Natural fertilizers by 7%.
In addition to several other suggestions and procedures shown in Figure 7.
Conclusion
The overall mean of the consumers’ Attitude towards the safety of fruit and vegetable products is Moderately degree, One way ANOVA test showed that the educational qualification factor had a significant effect at the 0.01 level on the overall mean and it was found that holders of doctorate and master’s degrees raise their degree of response towards the safety of agricultural products significantly higher than the rest of the education levels, which is in agreement with Al-Qadomi [8] and Radam [6]. The overall mean of consumer information level about agricultural products is a good level, and the Factors affecting significantly are the age categories, gender and place of residence at the level of 0.01, and it was found the internet is the principal source of the information about 73% of the sample, in addition to other sources such as television, reading books and lectures by 34.7%, 16.5%, 7.1 %, respectively all results agree with AL-Mokadad [5].
References
- Aweida E (2012) Basics of human nutrition. Obeikan Library fourth edition pp. 605.
- FAO (2018) The state of food commodity markets - agricultural trade, climate change and food security. Rome License CC BY-NC-SA 3.0 IGO pp. 110.
- ESCWA (2019) Adopting Good Agriculture Practices (GAPs) for Enhanced Food Safety in the Arab Region. Economic and Social Commission for Western Asia pp. 25.
- Fontes MA, Giraud Héraud E, Alexandra SP (2013) Consumers’ behaviour towards food safety: A litterature review. hal-00912476 pp. 28.
- AL Mokadad F, AL Janadi O, AL Rifa`ee A (2014) Scaling of consumer awareness toward food safety and affecting factors. Damascus University Journal for The Agricultural Sciences 30(2): 257-270.
- Radam A, Mohd RY, Than SP, Jinap S (2010) Consumers’ Perceptions: Attitudes and Willingness to Pay towards Food Products with “No Added Msg” Labeling, International Journal of Marketing Studies 2(1): 235-247.
- Fawzi M, Mona ES (2009) Food Safety Knowledge and Practices among Women Working in Alexandria University, Egypt. Journal of Egypt Public Health Association 84(1-2): 95-117.
- Al Qadomi AN (2005) Health Awareness Level and Sources of Health Information of Arab Clubs Players in Volleyball. Journal of Educational and Psychological Sciences 6(1): 224-263.
- Likert R (1932) A Techniqiun for The Measturement of Attitudes. New York University, USA.
- Hotelling H (1931) The generalization of Student's ratio. Annals of Mathematical Statistics 2 (3): 360-378.
- Abdi H (2007) Bonferroni and Sidák Corrections for Multiple Comparisons. Encyclopedia of Measurement and Statistics pp. 103-107.
- Sheskin DJ (2000) Handbook of Parametric and Nonparametric Statistical Procedures, second edition pp. 972.

Top Editors
-

Mark E Smith
Bio chemistry
University of Texas Medical Branch, USA -

Lawrence A Presley
Department of Criminal Justice
Liberty University, USA -

Thomas W Miller
Department of Psychiatry
University of Kentucky, USA -

Gjumrakch Aliev
Department of Medicine
Gally International Biomedical Research & Consulting LLC, USA -

Christopher Bryant
Department of Urbanisation and Agricultural
Montreal university, USA -

Robert William Frare
Oral & Maxillofacial Pathology
New York University, USA -

Rudolph Modesto Navari
Gastroenterology and Hepatology
University of Alabama, UK -

Andrew Hague
Department of Medicine
Universities of Bradford, UK -

George Gregory Buttigieg
Maltese College of Obstetrics and Gynaecology, Europe -

Chen-Hsiung Yeh
Oncology
Circulogene Theranostics, England -
.png)
Emilio Bucio-Carrillo
Radiation Chemistry
National University of Mexico, USA -
.jpg)
Casey J Grenier
Analytical Chemistry
Wentworth Institute of Technology, USA -
Hany Atalah
Minimally Invasive Surgery
Mercer University school of Medicine, USA -

Abu-Hussein Muhamad
Pediatric Dentistry
University of Athens , Greece

The annual scholar awards from Lupine Publishers honor a selected number Read More...


