Lupine Publishers Group
Lupine Publishers
Research Article(ISSN: 2644-1306) 
Airway Clearance Index, Gas Exchange and Pulmonary Functions in Obstructed and Restricted Pulmonary Diseases Patients Volume 1 - Issue 3
Al-Said A Haffor*
- Department of Physiology, Dar Aluloom University,Kingdom of Saudi Arabia
Received: June 20, 2019 Published: July 16, 2019
*Corresponding author: Al-Said A Haffor, College of Medicine, Dar Aluloom University, Riyadh, Kingdom of Saudi Arabia
DOI: 10.32474/TRSD.2019.01.000114
Abstract
Background: The lungs clearance index (LCI) is used to assess the efficiency of ventilation distribution homogeneity among the bronchial tree.
Purpose: The purpose of this study was to compare LCI with the standard pulmonary functions tests (PFT) as well as some selected gas exchange measures in three groups; healthy individuals, chronic obstructive pulmonary (COPD) and chronic restrictive pulmonary diseases (CRPD).
Methods: LCI was determined from the slope of phase-III of the nitrogen washout curve during single breath (SBN2W). PFT and gas exchange measures were determined using metabolic cart, Vmax29.
Results: One Way analysis (ANOVA) showed significant (p<0.05) main effects of group membership (Healthy vs. COPD Vs. RLD) on LCI and PFT forced breathing measures (FEV1, FVC, FEV1/FVC ratio). In addition, there was a significant main effect of group membership on gas exchange (VO2(max)). Bonferroni multiple comparisons showed that significantly (p<0.05) higher mean differences for LCI among groups, being highest for COPD, as compared with healthy and RLD. Multiple regression analysis showed significant (p<0.05) coefficients of determinations (r2) and regression coefficient (b) of LCI on FEV1 and FEV1/FVC ratio.
Conclusion: LCI, as determined by SBN2W, is a valid test to differentiate between COPD and RLD.
Keywords: Lung clearance index; LCI; FEV1; COPD; RLD
Introduction
Obstructive lung diseases (COPD) such as chronic bronchitis,
bronchiectasis and bronchiolitis; are clinical conditions that are
characterized by irreversible obstruction in the small airways Hogg
[1]; Pellegrino et al. [2] Verbank et al. [3] and Verbanck et al. [4]
and that elevates residual volume, anatomic VD/VT ratio and the
subsequently hyperventilation of the lungs. On the other hands,
however, restricted lung diseases (RLD) such as pneumonia, adult
respiratory distress syndrome (ARDS), tuberculosis, sarcoidosis,
pulmonary fibrosis and pleural effusion; are characterized by
irreversible reduced total lung capacity, residual volume plus
vital capacity Aron et al. [5]; Barreiro et al. [6]; Miller et al.,[7] and
that increases the physiologic VD/VT ratio and the subsequent
mismatch of ventilation to perfusion (VA/Q) and gas mixing in the
lungs Hansen et al. [8]; ATS Guideline [9]; Swanney et al. [10]; GOLD
Guideline [11]; Vesbo et al. [12].
Although FEV1 and FEV1/FVC ratio had been standardized to
differentiate between COPD and RLD, however FEV1 is relatively
insensitive to monitor progression of treatment follow up Beydon,
et al. [13], diagnose early stages of COPD and CRD and difficult to
perform on some elderly and children patients Verank et al. [3]; Swanney et al. [10]; Amin et al. [14]; keen et al. [15]. Furthermore,
FEV1 may not directly assess neither the homogeneity of gases in
the bronchial tree nor the insufficiency of the lungs’ parenchyma in
gas mixing. Besides its easiness to perform lungs clearance index
(LCI) test is specific to assess efficacy of ventilation distribution
homogeneity among the bronchial tree. Until now, there exist
no differential data regarding the assessment of LCI of COPD, as
compared with, RLD. Thus, there is a need to know whether LCI
correlates with already well proven clinical outcome parameters
in terms of FEV1 and FEV1/FVC ratio, for COPD as compared with
RLD patients.
Furthermore, oxygen consumption (VO2) is a gas exchange
measure that relies on the homogeneity of gases in the bronchial
tree and gas mixing in the lungs’ parenchyma. Until now, there
exist no data to correlate gas exchange measure, maximal oxygen
consumption (VO2) and LCI with already well proven clinical
outcome (FEV1 FEV1/FVC ratio) to discriminate between COPD
and CRD elderly patients. The aim of the present study was to
investigate whether LCI and VO2max measurements are suitable
tests to differentiate between COPD and RLD clinical conditions.
The secondary aim was to validate the LCI finding with the already
well proven and standardized clinical outcomes, FEV1 and FEV1/
FVC ratio.
Methods
Study Design and Subjects
A retrospective study design was undertaken for the study. Thirty patient’s records, 15 chronic pulmonary obstructed disease (COPD) and 15 restricted pulmonary lungs diseased (CRPD) were, selected and reviewed from patients’ pool who visited Pulmonary clinics at LAC+USC Medical Center, LA, CA, USA. The criteria for selection were BMI 25+ 3, absence of comorbidity of cardiovascular diseases and absence of respiratory infection and the need of oxygen. A matched with BMI control group no smoker and never smoked individuals were chosen to serve as control match group. All patients signed an informed consent that was approved by Institutional Review Board (IRB) of LAC+USC Medical Center.
Pulmonary Function and Single Breath Test tests (SNB)
Pulmonary function tests (PFT) consisted of three repeated tests were performed, 15 min a part, to assess short-term repeatability between tests. All PFT test were conducted using Vmax-29 (Senor Medics, Yorba Linda, CA USA) that generated an automated full PFT report, with reference values of all lungs’ mechanics and gas exchange measures in accordance to the American Thoracic Society (ATS) guideline. For single breath N2 washout was performed on flowmeter (Valadine Engineer, Huston USA) which measured molar mass and tidal flow. N2 measured directly using mass spectrometer (Perkin Elma-11. Dallas, USA). The slope of Phase-III (S-III) analysis was conducted by the same technician in order to minimize intraindividual errors. Tidal SBW tests were selected if tidal volumes were sufficiently large, i.e. phase-III of the washout curves reflected at least 50% of expired tidal volume Husemann et al. [16]. The slope of phase-III (S-III) was calculated automatically by linear fit program, between 65 and 95% of expired volume from tidal tests as described previously Horsley et al. [17,18], and between 25 and 75% of expired volume from the vital capacity N2-SBW Singer [19]; Houltz et al. [20,21] S-III was normalized with tidal volume to account for physiological differences in breaths within and between subjects Fuch et al. [22]; Robinson et. al. [23,24].
Statistical Analysis
Mean group differences for the dependent variables were evaluated using Univariate ANOVA to reveal the main effect of each group on the dependent variables. Bonferroni pairwise multiple comparisons were used to compare differences between each means pairs. Multiple linear regression (MLR) was utilized to validate the regression models of LCI on FEV1 and FEV1/FVC ratio. All statistical analysis was conducted using SPSS program (Ver. 16).
Results
Part I: Descriptive Findings
a) Gas Exchange Measures and Lungs Clearance Index: The mean of oxygen uptake at rest (VO2rest), during symptom limited maximal exercise (VO2max) and lung clearance Index (LCI) of the normal healthy control (C), chronic obstructive pulmonary diseases (COPD) and chronic restrictive pulmonary diseases (RLD) were presented in Table 1A. The mean of oxygen uptake at maximal symptom limited exercise (VO2max) of normal healthy was higher than the clinical groups (COPD & RLD). The corresponding observed mean of lungs’ clearance index (LCI) of obstructive pulmonary diseases (COPD) was higher than the mean of restrictive pulmonary diseases (RLD) and the normal healthy control (C), respectively (Table 1A).
b) Lungs’ Mechanics Measures (PFT), Spirometry:
The descriptive measures of the forced expiratory vital capacity at one second (FEV1), forced vital capacity (FVC), and the ratio of FEVC1 to FVC (FEVC1/FVC ratio) of the normal healthy control (C), chronic obstructive pulmonary diseases (COPD) and chronic restrictive pulmonary diseases (RLD) were presented in Table 1B. It was noted that the means of the lungs’ mechanic measures (LCI) of the normal heathy control group were higher, as compared to, the clinical groups (COPD & RLD). However, there was no noticeable difference in the ratio of FEVC1 to FVC (FEVC1/FVC) of restrictive pulmonary diseases (RLD), as compared to, normal healthy control (C).
Part-II: Inferential Findings
Gas Exchange Measures and Lungs Clearance Index
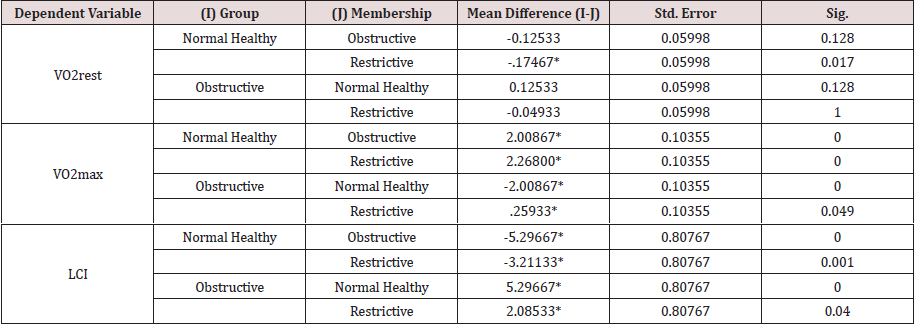
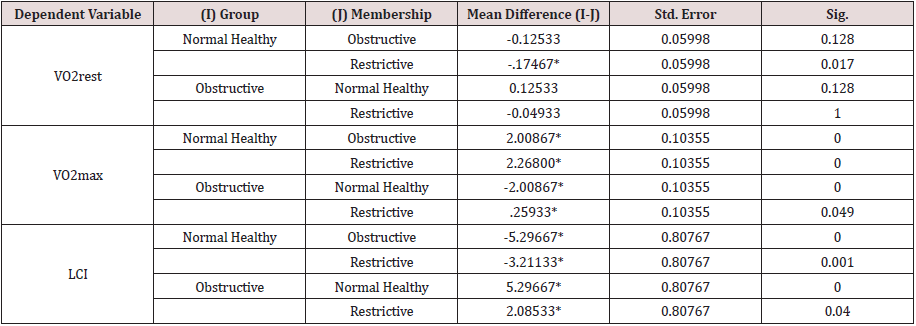
The results of One-Way Analysis of Variance ANOVA (Table 2.1A) showed significant (p<0.05) F ratio (p<0.05) for gas exchange measures (VO2rest and VO2max) and lung clearance index (LCI) which means that the differences in the obtained means and the overall potential observations are significantly (p<0.05) different. That is the main effects of the clinical conditions (COPD and RLD) on VO2max, VO2rest and LCI, caused poor ventilation distribution among the bronchial tree and the lungs’ parenchyma, hence negatively impacted gas exchange measures, VO2max, VO2rest. and further impacted N2 mixing, hence elevated LCI.
Table 2.1A: One-Way Analysis of Variance ANOVA for VO2rest, VO2max and LCI.
*The mean difference is significant at the 0.05 level.

Bonferroni pairwise multiple comparisons (Table 2.2A) showed that the means of LCI in the clinical groups (COPD & RLD) were significantly (p<0.05) higher than the control group (C) and also the difference between the two clinical groups were significant (p<0.05), being higher in the COPD, as compared with, RLD group. On the contrary, the means of VO2max in the clinical groups (COPD and RLD) were significantly (p<0.05) lower than the control group (C) and also the difference between the two clinical groups were significant (p<0.05), being higher in the COPD, as compared with RLD group. These findings justify that VO2 and LCI are appropriate indices that can be used to differentiate among COPD and CRPD clinical conditions.
Lungs’ Mechanics Measures (PFT), Spirometry
The results of One-Way Analysis of Variance ANOVA (Table 2.1B) showed significant (p<0.05) F ratio (p<0.05) for the lungs mechanics measures (FEV1, FVC & FEV1/FVC) which means that the differences in the obtained means of lungs mechanics measurers and the overall potential observations are significantly (p<0.05) different. Thus, there was significant (p<0.05) main effects of the clinical conditions (COPD and RLD) on FEV1, FVC and FEV1/FVC ratio, reflecting higher load of respiratory impedance, elevated anatomic VD/VT ratio, physiologic VD/VT ratio and ventilation to perfusion mismatch. Bonferroni pairwise means difference (Table 2.2B) showed that FVC was significantly (p<0.05) higher in the control, as compared with, COPD and RLD. Mean FEV1 of the control group was significantly (p>0.05) higher than the means of FEV1 of the two clinical groups (COPD and RLD). However pairwise means difference of the ratio of FEV1/FVC in the control and RLD was not significantly (p>0.05) different Table 2.2B).
PART-III Validation of LCI:
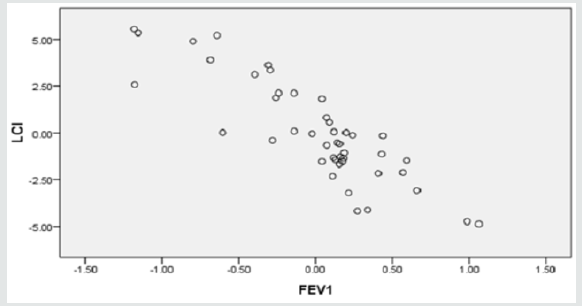
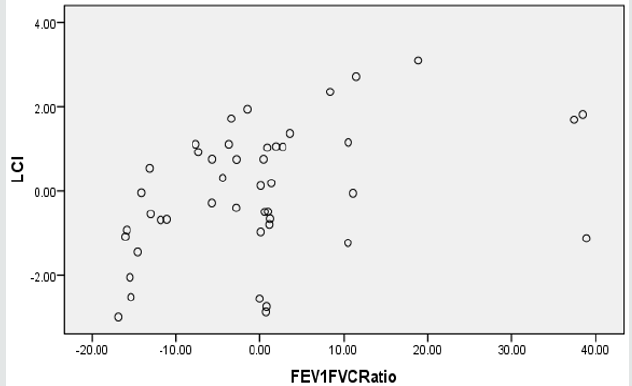
Two regression models were generated, using SPSS stepwise multiple linear regression subroutine, to validate LCI. The predictor for model-1 was FEV1 alone whereas, the predictors for model-2 were FEV1 and FEV1/FVC ratio (Table 3A). Although both models were significant (p<0.05), yet adding FEV1/FVC ratio in the model didn’t improve the predictability, hence FEV1 alone is more powerful predictor for LCI. Clearly FVC reflect the lungs capacity and that somewhat had resulted in slim distortion of the second regression model. Figures 1a & 1b display the scatter plot of the linear associations of the two regression models, model-1 and model-2, respectively. The multicollinearity parameters of the predictor variables (FEV1 and FEV1/FVC ratio) were not significant (p<0.05), as evident by low variability of inflation factor (VIF below 5), significant (p<.05) zero order correlation (r-zero) and the small value of standard errors of beta (Table 3B).
Table 3A: Regression of LCI on FEV1 and FEV1/FVC Ratio.
a. Predictors: (Constant), FEV1;
b. Predictors: (Constant), FEV1, FEV1FVCRatio
c. Dependent Variable: LCI

Discussion
The major findings of the present study showed that the means of LCI in the clinical groups (COPD & RLD) were significantly (p<0.05) higher than the control group (C) and also the difference between the two clinical groups were significant (p<0.05), being higher in the COPD, as compared with RLD group. Practically an obstructive defect is indicated by low FEV1/FVC, below 70 percent, based on GOLD criteria and/or below the fifth percentile of lower limit of normal (LLN) based on ATS criteria ATS guideline [25]; Beydon et al. [13]; Bhatt and Wood [26]. Remodeling of airways tree inducted by COPD diseases and related lungs’ parenchymal changes inducted by RLD had influenced N2 homogeneity mixing. Compared to the classical tests, FEV1, we found that LCI test was easy for patients to perform, highly repeatable within trials and detected differences among the clinical groups, COPD and RLD, sensitive to differentiate COPD from RLD. Some of those findings were noted previously Kieninger et al. [19]; Subbaro et al. [27]. Because only tidal breathing is required without forced respiratory maneuver, LCI is suitable to use in children and elderly in whom respiratory effort related procedures are difficult to perform. The LCI test can therefore be successfully performed in all ages, hence is an exciting development in the field of the lungs’ physiology assessments.
It was previously reported that LCI reflect slim improvement of ventilatory capacity after bronchodilator inhalation in children with advanced cystic fibrosis lung disease Lum et al. [10]; Amin et al. [28], Vesbo et al., [12]. Kramer and associates followed up 142 cohort children (age 6 – 18 years) with cystic in whom 4 subsequent annual evaluation of PFT, FRC and LCI (using N2 washout) were conducted. Their results demonstrated that LCI was the earliest measurement to deteriorate and was elevated in more than half of those with FEV1 within the normal range. In their previous investigation, the same authors reported that LCI continued to increase accompanied with the rise in pulmonary hyperinflation and trapped gas volume, beyond the age of 12 years, whereas FEV1 Z-scores was not changed Kramer et al. [29]. In their subsequent work, they reported elevated LCI in patients with allergic bronchopulmonary aspergillosis (ABPA), and that the slope of longitudinal progression of LCI was greatest in those chronically infected with P. aerugi- nosa Kramer et el. [30]. Interestingly, it was reported that LCI was the most sensitive differentiating factor between subgroups, based on chronic and intermittent P. aeruginosa colonization of the lower airway Kramer et el. [30].
The findings that higher VO2rest for the clinical groups can be explained by the increased work of breathing, mainly due to elevated O2 consumption by the respiratory muscles, also known as muscle wasting. Obviously, hyperinflation of COPD shortens the diaphragm, moving it to a biomechanical disadvantageous portion of its length-tension curve. Moreover, the zone of apposition is reduced, and this impairs the optimal inspiratory action of the muscle resulting in greater load, elevated work of breathing Miller et al. [31]; Keen et al. [32]; Jones et al. [12]. The findings of the present study showed that means of VO2max in the clinical groups (COPD and RLD) were significantly (p<0.05) lower than the control group (C) and also the difference between the two clinical groups were significant (p<0.05), being higher in the COPD, as compared with RLD group. These findings justify that VO2max and LCI are appropriate indices that can be used to differentiate among COPD and RLD clinical conditions. Clearly, bronchoconstriction elevates air flow resistance in the bronchial tree and decrease in the physiological dead space to tidal volume ratio (VD/VT).
Furthermore, bronchoconstriction results in increasing CO2 load on the lungs and lower respiratory drive. Both COPD and RLD patients increases their total minute ventilation (VE) via increasing breathing frequency, in attempt, to maintain efficient carbon dioxide output because of their reduced alveolar ventilation. The findings that VO2max of the clinical groups were lower in the clinical groups, as compared with control, implying that both diseases severely impacted gas exchange reserve and reduced physical working capacity. Several physiological mechanisms that underlie reduced VO2max that includes, but not limited to; 1) increased the work of breathing, hence respiratory muscle fatigue, 2) impaired efficiency of pulmonary gas exchange and 3) Mismatching of ventilation to perfusion which inhibits cardiovascular and muscular systems to keep up with increasing exercise intensity. It was reported previously COPD and RLD patients their pulmonary artery wedge pressure rises sharply on exercise and their cardiac output fail to keep up with an adequate increase with increasing exercise load resulting in functional impairment of the pulmonary and cardiovascular systems Güder et al. [33,34].
In restrictive lung diseases (RLD), modulation of the lungs’ parenchyma contributes to reduced gas transfer, which may be marked clinically by reduced VO2max and desaturation during maximal exercise. Corris and associates reported a fall of 18 – 40 percent in VO2max following lobectomy and pneumonectomy Corris et al. [35]. In addition, both COPD and RLD conditions are systemic diseases that impact other organs such as cardiovascular and muscular system, high proportion of glycolytic type II fibers, decreased muscle mass, decreased capillary density, and reduced number of aerobic enzymes. Clearly all these systemic factors induct negative changes on the maximal rate of oxygen uptake [36- 39].
Conclusion
Based on the results of the present study and other studies [40, 41], it can be concluded that LCI, as determined by SBN2W, is a valid test to differentiate between normal healthy, COPD and RLD.
References
- Hogg JC, Chu F, Utokaparch S(2004) The nature of small-airway obstruction in chronic obstructive pulmonary disease NEnglJ Med 350(26): 2645-2653.
- Pellegrino R, Viegi G, Brusasco V,Crapo RO, Burgos F, et al. (2005) Interpretative strategies for lung function tests. Europium Respiration Journal 26(5): 948-968.
- Verbanck S, Schuermans D, Vincken W (2007) Small airways ventilation heterogeneity and hyperinflation in COPD: response to tiotropium bromide. International journal of chronic obstructive pulmonary disease 2(4): 625-634.
- Verbanck S, Thompson BR, Schuermans D,Kalsi H, Biddiscombe M, et al. (2012) Ventilation heterogeneity in the acinar and conductive zones of the normal ageing lung. Thorax 67(9): 789-795.
- Aaron SD, Dales RE, Cardinal P (1999) How accurate is spirometry at predicting restrictive pulmonary impairment? Chest115(3):869-873.
- Barreiro TJ, Perillo I (2004) An approach to interpreting spirometry. Am Fam Physician. 69(5): 1107-1114.
- Miller MR, Hankinson J, Brusasco V, , Burgos F, Casaburi R , et al. (2005) Standardization of spirometry. European Respir Journal 26(2): 319-338.
- Hansen JE, Sun XG, Wasserman K (2007) Spirometric criteria for airway obstruction: use percentage of FEV1/FVC ratio below the fifth percen-tile, not < 70%. Chest 131(2): 349-355.
- (1991) American Thoracic Society Lung function testing: selection of reference values and interpretative strategies Am Rev Respir Dis 144(5): 1202-1218.
- Swanney MP, Ruppel G, Enright PL,Pedersen OF, Crapo RO, et al. (2008) Using the lower limit of normal for the FEV1/FVC ratio reduces the misclassification of airway obstruc- toon. Thorax 63(12): 1046-1051.
- (2009) Global Initiative for Chronic Obstructive Lung Disease (GOLD) 2008Global strategy for diagnosis, management, and prevention of COPD.
- Vesbo J, Hurd SS, Agustí AG,Jones PW, Vogelmeier C, et al. (2013) Global strategy for the diagnosis, management, and prevention of chronic obstructive pulmonary dis- ease: GOLD executive summary. American Journal of Respiration Critical Care Med 187(4): 347-365.
- Beydon N, Davis SD, Lombardi E (2007) An official American Thoracic Society/European Respiratory Society statement: pulmonary function testing in preschool children. Am J Respir Crit Care Med175:1304-1345.
- Amin R, Subbarao P, Jabar A (2010) Hypertonic saline improves the LCI in pediatric patients with CF with normal lung function Thorax 65: 379-383.
- Keen C, Olin AC, Wennergren G,Gustafsson P (2011) Small airway function, exhaled NO and airway hyper-responsiveness in paediatric asthma. Respir Med 105(10): 1476-1484.
- Husemann K, Berg N, Engel J, Port J, Joppek C, et al. (2014) Double tracer gas single-breath washout: reproducibility in healthy subjects and COPD. Eur Respir Journal 44(5): 1210-1222.
- Horsley AR, Macleod KA, Robson AG(2008) Effects of cystic fibrosis lung disease on gas mixing indices derived from alveolar slope analysis. Respiratory physiology & neurobiology 162(3): 197-203.
- Horsley AR, Gustafsson PM, Macleod KA (2008) Lung clearance index is a sensitive, repeatable and practical measure of airways disease in adults with cystic fibrosis. Thorax 63(2): 135-140.
- Kieninger E, Singer F, Fuchs O, Abbas C, Frey U, et al. (2011)Long-term course of lung clearance index between infancy and school-age in cystic fibrosis subjects. Journal Cyst Fibros 10(6): 487-490.
- Singer F, Stern G, Thamrin C,Abbas C, Casaulta C, et al. (2013) A new double-tracer gas single-breath washout to assess early cystic fibrosis lung disease. Europium Respiration Journal 41(2): 339-345.
- Singer F, Houltz B, Latzin P, Robinson P, Gustafsson P (2012) A realistic validation study of a new nitrogen multiple-breath washout system. PLoS One 7(4): e36083.
- Fuchs SI, Buess C, Lum S, et al. (2006) Multiple breath washout with a sidestream ultrasonic flow sensor and mass spectrometry: a comparative study. Pediatr Pulmonol 41(12): 1218-1225.
- Robinson PD, Latzin P, Verbanck S,Hall GL, Horsley A, et al. (2013) Consensus statement for inert gas washout measurement using multiple- and single- breath tests. Europium Respiration Journal 41(3): 507-522.
- Robinson PD, Goldman MD, Gustafsson PM (2009) Inert gas washout: theoretical background and clinical utility in respiratory disease. Respiration 78(3): 339-355.
- Burgel PR (2011) The role of small airways in obstructive airway diseases European respiratory review: an official journal of the European Respiratory Society 20(119): 23-33.
- Bhatt NY1, Wood KL (2008) What defines abnormal lung function in older adults with chronic obstructive pulmonary disease? Drugs Aging 25(9): 717-728.
- Subbarao P, Stanojevic S, Brown M,Jensen R, Rosenfeld M, et al. (2013) Lung clearance index as an outcome measure for clinical trials in young children with cystic fibrosis. A pilot study using inhaled hypertonic saline. American Journal Respiration Critical Care Med 188(4): 456-460.
- Amin R, Subbarao P, Lou W (2011) The effect of dornase alfa on ventilation Inhomogeneity in patients with cystic fibrosis Eur Respir J 37 (1): 806-812.
- Kraemer R, Blum A, Schibler A, Ammann RA, Gallati S (2005) Venti-lation inhomogeneities in relation to standard lung function in patients with cystic fibrosis. American Journal Respiration Crit Care Med 171(4): 371-378.
- Kraemer R, Delosea N, BallinariP, Gallati S, Crameri R (2006) Effect of allergic bronchopulmonary aspergillosis on lung function in children with cystic fibrosis. American Journal Respiration Crit Care Med 174(11): 1211-1220.
- Miller MR, Quanjer PH, Swanney MP, Ruppel R, Enright PL, et al. (2011) Interpreting lung function data using 80% predicted and fixed thresholds misclassifies more than 20% of patients. Chest 139(1): 52-59.
- Jones P, Miravitlles M, Van Der Molen T (2012) Beyond FEV(1) in COPD: a review of patient-reported outcomes and their measurement. International journal of chronic obstructive pulmonary disease 7: 697-709.
- G, Brenner S, Störk S, Hoes A, Rutten FH (2014) Chronic obstructive pulmonary disease in heart failure: accurate diagnosis and treatment Eur J Heart Fail 16(12): 1273-1282.
- Güder G, Brenner S, Angermann CE (2012) GOLD or lower limit of nor- mal definition? A comparison with expert-based diagnosis of chronic obstructive pulmonary disease in a prospective cohort-study Respir Res 13(1): 13.
- Corris PA, DA Ellis, T Hawkins, GJ Gibson (1987) Use of radionuclide scanning in the preoperative estimation ofpulmonary function after pneumonectomy Thorax 42(4): 285-291.
- Horsley A (2009) Lung clearance index in the assessment of airways disease Respir Med 103(6): 793-799.
- Horsley AR, Macleod KA, Robson AG (2008) Effects of cystic fibrosis lung disease on gas mixing indices derived from alveolar slope analysis. Respir Physiol Neurobiol 162(3): 197-203.
- Houltz BG, KLindblad, A Singer, FNielsen, KGustafsson et.al. N2 (2012) washout ventilation inhomogeineity indices in a reference population ages 7-70years. European Respiratory Journal 40(56):694s.
- Lum S, Gustafsson P, Ljungberg H, Hulskamp G, Bush A, et al. (2007) Early detection of cystic fibrosis lung disease: multiple-breath washout versus raised volume tests. Thorax62(4): 341-347.
- Singer F, Kieninger E, Abbas C, Yammine S, Fuchs O, et al. (2012) Practicability of nitrogen multiplebreath washout measurements in a pediatric cystic fibrosis outpatient setting. Pediatr Pulmonol 2012 48(8): 739-746.
- Stromberg NO, Gustafsson PM (2000) Ventilation inhomogeneity assessed by nitrogen washout and ventilation-perfusion mismatch by capnography in stable and induced airway obstruction. Pediatr Pulmonol 29(2): 94-102.


