Lupine Publishers Group
Lupine Publishers
Menu
ISSN: 2638-6003
Research Article(ISSN: 2638-6003) 
Evaluation of Patellofemoral Pain Syndrome Using a Smartphone-Based Sonographic Measuring System Volume 1 - Issue 5
Viola Bantle1,2*, Andreas Alk1,3, Tobias Martin1,3, Rui Wang1,4 and Josef Kozak1,3
- 1Aesculap AG, Tuttlingen, Germany
- 2Universität Stuttgart, Germany
- 3AGH University of Science and Technology, Krakow, Poland
- 4Karlsruher Institut für Technologie, Germany
Received: July 30, 2018; Published: August 07, 2018
Corresponding author: Viola Bantle, Aesculap AG, Tuttlingen, Universität Stuttgart, Germany
DOI: 10.32474/OSMOAJ.2018.01.000121
Abstract
For evaluation of patellofemoral pain syndrome (PFPS) the mediolateral distance between tibial tuberosity and trochlea groove (TT-TG) is considered the gold standard. In this paper the measurement of TT-TG using tomographic or radiological section images is replaced by a smartphone-based sonographic measuring system. Sonography offers not only imaging but also a measuring method to allow with the so- called Triple Landmark application for measuring TT-TG with a smartphone as mobile localizer. In addition, diagnosis is supported by acquisition of two more parameters: the mediolateral distance between inter condylar notch and tibial tuberosity (TT-IN) as well as the offset from trochlea groove to intercondylar notch (IN- TG). The system provides three guideline values to be an adequate replacement for the conventional measurement of TT-TG. Following a feasibility study of the application, TT-TG in range of 13.1 ± 4.2 mm (male)/14.8 ± 3.4 mm (female) was measured. Findings correspond to postulated values of the gold standard. TT-IN is 14.4 ± 4.1mm (male)/ 13.6 ± 4.0 mm (female). In both cases, a significant sex-specific difference is not remarkable. Furthermore, scattering of TT-IN within the five repeated measurements on a subject is higher than scattering of TT-TG.
Keywords: Tibial Tuberosity-Trochlea Groove Distance; Navigated Ultrasound; Smart Devices; Patellofem- Oral Pain Syndrome; Knee Joint
Introduction
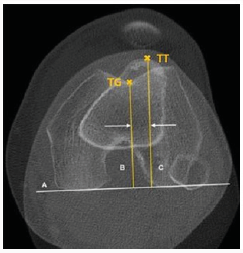
TThe mediolateral distance of tibial tuberosity and trochlea groove (TT-TG) is considered the gold standard for patellofemoral pain syndrome (PFPS) to determine lateral shift of tibia and femur [1]. Goutallier et al. [2] described TT-TG for the first time in radiological images. In 1994, a study by Déjour et al. [3] has shown a normal TT- TG range of 12.7 ± 3.4 mm using superimposed tomographic slice images. More than 20 mm are considered pathological. Tomographic image data of tibial tuberosity and trochlea groove are captured and superimposed in transverse plane (Figure 1) [4].
For calculation, two auxiliary lines were con- structed in the superimposition which are perpendicular to the tangent of posterior femur condyles (Figure 1). While one line starts at the lowest point of the trochlea (Figure 1), the other one runs through tibial tuberosity (Figure 1). The distance between the parallel lines describes TT-TG. Apart from radiation exposure in X-rays and expenditure of time for MRI, both procedures are expensive and elaborate. Therefore, there is a need to replace evaluation of TT-TG by another method. A measuring system based on navigated ultrasound is described which detects bony land- marks and sets them in relation. Implementation of navigated ultrasound as measuring method and imaging in one opens innovative possibilities to re-interpret value of TT-TG and improve its evaluation regarding PFPS.
Materials and Methods
This study was based on an application using navigated ultrasound to capture anatomical parameters. An imageless navigation system using a smart device localizer was applied. By using a smartphone flashlight, coordinates of passive retroreflective markers were detected and put in relation to a 3D coordinate system.
Components
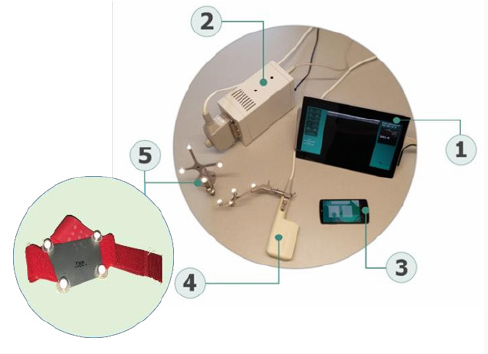
Figure 2 represents the system components for data acquisition and processing. The system includes
a) Tablet Microsoft Surface Pro 4.
b) Ultrasound device Echo Blaster 128 (Tele med, Vilnius, Lithuania).
c) iPhone 6 (Apple Inc., USA).
d) Ultrasound probe (Tele med, Vilnius, Lithuania) and adapter with passive marker (Aesculap AG, Tuttlingen).
e) Passive marker as reference (Aesculap AG, Tuttlingen).
Ultrasound device and tablet relate to an USB cable. Images are visualized and processed by the Microsoft Surface Pro 4. For data transfer, tablet and smartphone communicate wirelessly via WLAN.
Tracking
Daniol et al. [5] describe the function of smart mobile localizer. Markers were equipped with passive spheres which reflect the flash light sent by the smartphone camera. As a reference one marker was attached to the tibia with tape to ensure a fix position. The geometry of the markers and the arrangement of the spheres are unique and for the localizer unit clearly distinguishable from each other. According to the principle of imageless navigation the smartphone detects the passive markers and identifies their coordinates [6]. Position and orientation of the ultrasound probe are transferred to the tablet in relation to the reference co- ordinate system. The offset from probe to ultra- sound image is determined.
Landmarks
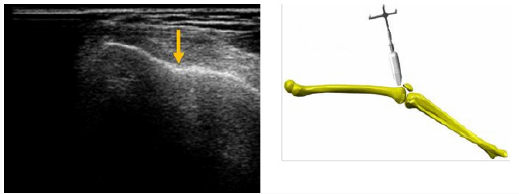
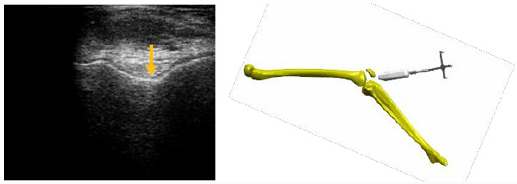
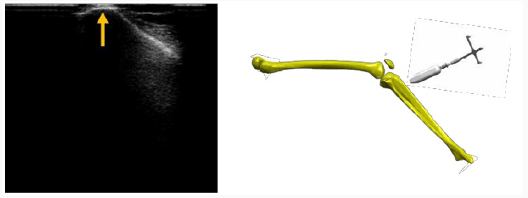
Trochlea groove, intercondylar notch and tibial tuberosity were detected from cranial to caudal. The subject was sitting in 60 degrees of knee flexion. The probe was first placed transversely above the patella and tilted from caudal to cranial until the depth reaches its maximum. The deepest point of the echogenic structure is the trochlea groove (Figure 3). Next, the probe was positioned directly under the patella. The intercondylar notch becomes visible (Figure 4). This distinctive landmark is the deepest point of femoral articulation surface. Transversally, the tibial tuberosity was localized at the proximal tibia. The high point of this land- mark is in evidence (Figure 5).
Triple Landmark Application
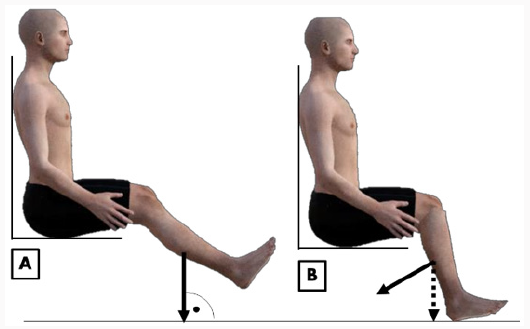
Landmarks were captured and manually marked with a crosshair on the tablet. A projection plane is the equivalence to the superimposition of tomographic measuring method of TT-TG. A plane was built based on two gravitational vectors. By using gravity, the vectors are independent of individual bone structures. On the knee joint to be examined the reference was attached to the tibia. The leg was lifted in a seated position whereby the movement is originated from the knee joint until extension up to 20 degrees is reached (Figure 6A). The first recording was performed and a gravitational vector to the reference (Figure 6A), arrow was generated. The leg was subsequently put down in 60 degrees of knee flexion for the measurement (Figure 6B). The three land- marks were detected and defined. When recording the tibial tuberosity, the system also generates another gravitational vector originating from the reference marker (Figure 6B), doted arrow. The gravitational vectors span a sagital plane which is moved to one of the landmarks. The plane is set in relation to another landmark to measure the mediolateral distance of two landmarks. In this way the application captures the distances from trochlea groove to tibial tuberosity (TT- TG), trochlea groove to intercondylar notch (IN- TG) and tibial tuberosity to intercondylar notch (TT-IN).
Feasibility study
Triple Landmark application was tested on 20 subjects, half of them are female. Misalignment and pain around the kneecap were documented in advance. The average BMI was 23.7 (male)/ 22.1 (female). The mean age was 30.3 years (male)/ 27.5 years (female). The ex- amination was executed five times per subject on the right knee. Subsequently, average and standard deviation were calculated. It needs to be investigated whether TT-TG differs from gold standard and from the guideline values published by Déjour et al. [3]. TT-IN is evaluated related to offer a reasonable value that has potential to re- place TT-TG. IN-TG is in interest to estimate lateral offset of patella tracking from the entry in femoral sulcus (trochlea groove) up to intercondylar notch. In addition, the scattering within the five re- peated measurements on a subject was calculated. It provides a benchmark for validating the system and the accuracy of defining the land- marks.
Result
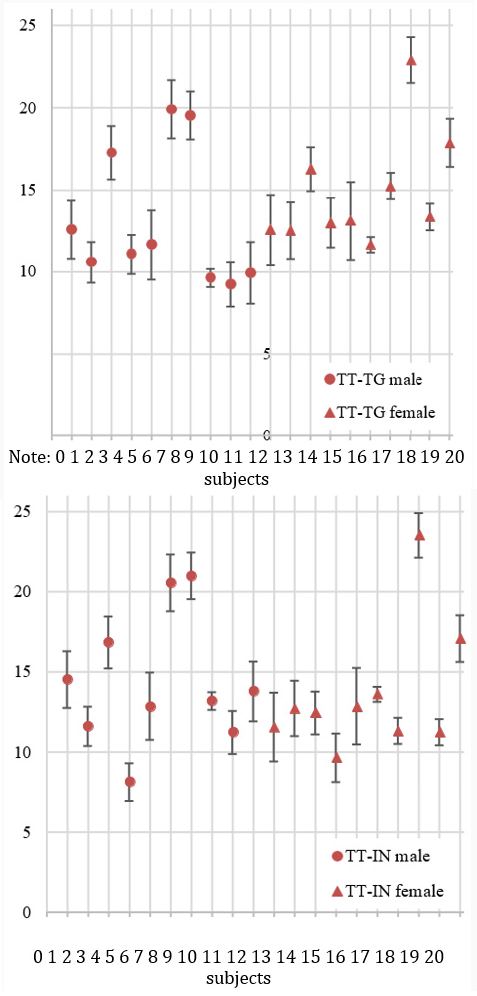
Triple Landmark Application has calculated values of TT-TG, TT-IN and IN-TG (Table 1). Mean values are presented as a function of sex. While TT-TG and TT-IN were shown by the application, the third distance did not offer a reasonable value. Therefore, IN-TG is presented as the difference between TT-TG and TT-IN. Positive values of TT-TG and TT-IN say that tibial tuberosity is lateral to the femoral landmark. A positive IN-TG means that TT-TG exceeds TTIN. Consequently, trochlea groove is more medial than intercondylar notch. A statistical analysis was performed with hypothesis that TT-TG shows no significant difference between males and females. The statement was confirmed, so results of the test groups do not show sex-specific differences (p = 0.35). The same applies to TT-IN (p = 0.68). The diagrams shown in Figure 7 compare TT-TG (up) and TT- IN (down). Values are shown on the vertical axis in milli metres. It was verified whether these distances differ significantly. The range of TT-TG is comparable with TT-IN (p > 0.47). Within the five repeated measurements on one subject, the calculated values spread on average for TT-TG ± 1.5 mm (male)/1.4 mm (female). It is remarkable that the scattering of TT-IN is higher (± 2.4 mm (male)/2 mm (female)).
Discussion
The presented measuring system offers a low error rate due to utilize gravity for the Triple Land- mark Application. The measured data is comparable with the results of Déjour et al. [3]. In comparison to the standard deviation of their publication, a smaller value is achieved with navigated ultrasound. For TT-TG, values in the range of 13.1 ± 4.2 mm (male)/ 14.8 ± 3.4 mm (female) are shown. This study shows promising results. However, the test group was too small for reliable conclusions and therefore needs to be ex- tended. This application takes the factor of tibiofemoral rotation into account, whereas in case of using superimposed tomographic slice images only the transverse shift is considered. Sonographic detection of bony landmarks requires a high user experience because of the subjects’ specific anatomy. The distinctive structure of intercondylar notch simplifies the examination instead of using the trochlea groove. Trochlea dysplasia is not rarely a reason for PFPS that complicates detection of the groove (e.g. flat geometry). Regarding the system validation, it should be noted that the scattering of TT-IN within the five repeated measurements on a subject is higher than the scattering of TT-TG. Even though the difference is not huge, unexpectedly trochlea groove seems to be better definable than inter- condylar notch. A recommendation is to use TT- IN when dysplasia prevents detection of trochlea groove.
The measuring system based on navigated ultra- sound is simple, mobile and cost-effective. Furthermore, the low space consumption enables a fast and preoperative diagnostic tool by the integration of smart devices. In comparison to X- rays, MRI or CT, the patient is not exposed to radiation and claustrophobia. One disadvantage is the influence of leg rotation on the measuring accuracy when putting the leg down. Different degrees of knee flexion change measured data as well in this case. The influencing factors are in- validated by a marking on the floor that ensures no leg rotation and 60 degrees knee flexion. Nevertheless, a knee motion device to prevent unintended flexion and leg rotation during the examination could enhance measuring accuracy and reproducibility. For future works, the inclusion of augmented reality glasses could improve the user experience and ease the measurement. Thereby only a single user is enough to manually guide the probe and to localize the passive markers.
This study has shown that the smartphone-based sonographic measuring system has the potential to replace tomographic imaging to measure TT- TG. Major advantage is that ultrasound provides imaging and measuring method in one. By capturing the distance between intercondylar notch and tibial tuberosity in case of the patellofemoral pain syndrome, a new guideline value is presented to support the decision whether a surgical intervention is necessary or not.
References
- S Ostermeier, C Becher Einfluss des Tubero- sitastransfers auf das patellofemorale Gelenk (de), Arthroskopie 23(3): 208-214.
- D Goutallier, J Bernageau, B Lecudonnec (1978) Mesure de l’écart tubérosité tibiale antérieure-gorge de la trochlée (T.A.-G.T.). Technique. Résul- tats. Intérêt, Revue de chirurgie orthopedique et reparatrice de l’appareil moteur 64(5): 423-428.
- H Dejour, G Walch, L Nove-Josserand, C Guier (1994) Factors of patellar instability: an anatomic ra- diographic study (eng), Knee surgery, sports traumatology, arthroscopy: official journal of the ESSKA 2(1): 19-26.
- S Waldt, E J Rummeny (2012) Bildgebung der patel- lofemoralen Instabilität, Der Radiologe 52(11): 1003-1011.
- M Danioł, T Martin, J Kozak (2015) Development, calibration, validation and comparison of mobile medical localizers based on smartphones Apple iPh- one 5S and Samsung Galaxy S4, Przegląd Elektro- techniczny 91(5): 53-56.
- T Martin, J Bassey-Neef, A Alk, F Derma, J Kozak (2016) A smart device based measuring system for pelvic tilt computation in hip arthroplasty, Przegląd Elektrotechniczny 92(3).

Top Editors
-

Mark E Smith
Bio chemistry
University of Texas Medical Branch, USA -

Lawrence A Presley
Department of Criminal Justice
Liberty University, USA -

Thomas W Miller
Department of Psychiatry
University of Kentucky, USA -

Gjumrakch Aliev
Department of Medicine
Gally International Biomedical Research & Consulting LLC, USA -

Christopher Bryant
Department of Urbanisation and Agricultural
Montreal university, USA -

Robert William Frare
Oral & Maxillofacial Pathology
New York University, USA -

Rudolph Modesto Navari
Gastroenterology and Hepatology
University of Alabama, UK -

Andrew Hague
Department of Medicine
Universities of Bradford, UK -

George Gregory Buttigieg
Maltese College of Obstetrics and Gynaecology, Europe -

Chen-Hsiung Yeh
Oncology
Circulogene Theranostics, England -
.png)
Emilio Bucio-Carrillo
Radiation Chemistry
National University of Mexico, USA -
.jpg)
Casey J Grenier
Analytical Chemistry
Wentworth Institute of Technology, USA -
Hany Atalah
Minimally Invasive Surgery
Mercer University school of Medicine, USA -

Abu-Hussein Muhamad
Pediatric Dentistry
University of Athens , Greece

The annual scholar awards from Lupine Publishers honor a selected number Read More...


