Lupine Publishers Group
Lupine Publishers
Menu
ISSN: 2637-6628
Research Article(ISSN: 2637-6628) 
Antiaging, Cognition and Anti-Inflammatory Potential of the Biofield Energy Treatment in Vitamin D3 Deficiency Diet (VDD) Induced Sprague Dawley Rats Volume 3 - Issue 4
Mahendra Kumar Trivedi1, Alice Branton1, Dahryn Trivedi1, Gopal Nayak1 and Snehasis Jana2*
- 1Trivedi Global, Inc, Henderson, Nevada, USA
- 2Trivedi Science Research Laboratory Pvt. Ltd, India
Received: December 18, 2019; Published: January 08, 2020
Corresponding author: Snehasis Jana, Trivedi Science Research Laboratory Pvt. Ltd, India
DOI: 10.32474/OJNBD.2020.03.000169
Abstract
A proprietary formulation was designed that consist of minerals (zinc, magnesium, iron, calcium, selenium, and copper), vitamins (pyridoxine HCl, cyanocobalamin, ascorbic acid, alpha tocopherol, and cholecalciferol), Panax ginsengextract, β-carotene, and cannabidiol isolate. The present study was aimed to evaluate the impact of Consciousness Energy Healing Treatment (the Trivedi Effect®) on a novel test formulation in male Sprague Dawley (SD) rats, fed with vitamin D3 deficiency diet (VDD) for antiaging/cognitive and anti-inflammatory activities. The test formulation was divided into two parts. One part was denoted as the untreated test formulation without any Biofield Energy Treatment, while the other part was defined as the Biofield Energy Treated sample, which received the Biofield Energy Healing Treatment by renowned Biofield Energy Healer, Mr. Mahendra Kumar Trivedi. The level of Klotho protein (anti-aging biomarker) in cerebro-spinal fluids (CSF) was significantly increased by 44.2%, 92.0%, 44.2%, and 43.1% in the Biofield Energy Treatment per se to animals from day -15 (G6), Biofield Energy Treated test formulation from day -15 (G7), Biofield Energy Treatment per seplus Biofield Energy Treated test formulation from day -15 (G8), and Biofield Energy Treatment per seanimals plus untreated test formulation (G9) groups, respectively as compared to the disease control group (G2). The level of β-endorphin in CSF (cognition, pain and inflammation biomarker) was significantly increased by 418.4%, 1155.7% (p≤0.01), 890.4% (p≤0.01), 351%, and 566.7% in the G5, G6, G7, G8, and G9 groups, respectively as compared to the G4. Moreover, serotonin level in CSF was increased by 94.8%, and 63.4% in the G6 and G9 groups, respectively as compared to the G4. The level of 1, 25 (OH)2D3 in CSF was significantly increased by 61.8%, 33.4%, 61.5%, 64.5%, and 30.6% in the G5, G6, G7, G8, and G9 groups, respectively as compared to the VDD induced group (G2). Further, the level of c-reactive protein (CRP, inflammation biomarker) in serum was reduced by 21.2%, 23.1%, 19.8%, 22.4%, and 23.1% in the G5, G6, G7, G8, and G9 groups, respectively as compared to the G2 group. Altogether, results suggested that the Biofield Treated test formulation and Biofield Energy Treatment per se significantly increased antiaging, cognitive, and anti-inflammatory biomarkers that could be helpful in various aging/psychiatric or inflammatory disorders. Thus, the results showed a significant slowdown of disease progression and all other disease-related complications/symptoms in the preventive Biofield Energy Treatment group per seand the Biofield Energy Treated Test formulation groups (viz. G6, G7, G8, and G9) as compared to the disease control group.
Keywords: Biofield Treatment;antiaging; The Trivedi Effect®;klotho;β-endorphin;serotonin; Vitamin D3 deficiency diet;calcitriol
Introduction
Deficiency of vitamin D3 is directly linked to various health problems like osteoporosis, cognitive decline, cardiovascular disease, depression, diabetes, hypertension, and cancer [1,2]. Vitamin D is very essential for bone health in adults and children. Its sufficient concentration prevents osteomalacia, muscle weakness, and protect fractures. The processes by which intake of vitamin D3 like synthesis through skin via UV-rays and absorption from foods become less efficient with age [3]. Hence, hypovitaminosis of vitamin D3 is more prevalence worldwide [4]. Based on this situation authors constructed the current research work to evaluate the impact of Consciousness Energy Healing Treatment on aging after induction of Vitamin D3Deficiency Diet (VDD) in Sprague Dawley rats. The newly formulated test formulation, which is a combination of multiple minerals (iron, copper, zinc, magnesium, calcium, and selenium), vitamins (ascorbic acid, cholecalciferol, pyridoxine HCl, alpha tocopherol, and cyanocobalamin), panax ginseng extract, and cannabidiol isolate. Each component of this test formulation commonly used as nutraceutical supplement [5-8]. Biofield Therapy (or Healing Modalities) is one of the approach of Complementary and Alternative Medicine (CAM) therapies now considering as the first-line model of treatment against several disorders. Based on the obtained data from National Health Interview Survey (NHIS) 2012, reported that most of the Americans used the dietary supplement as complementary health approaches than conventional medicine therapy. Besides, The National Center of Complementary and Integrative Health (NCCIH) has recognized and accepted Biofield Energy Healing as a CAM health care approach in addition to other therapies, medicines and practices such as Tai Chi, Qi Gong, Ayurvedic medicine, Rolfing structural integration, deep breathing, yoga, natural products, chiropractic/osteopathic manipulation, massage, meditation, relaxation techniques, aromatherapy, acupuncture, progressive relaxation, hypnotherapy, healing touch, mindfulness, special diets, naturopathy, homeopathy, guided imagery, acupressure, traditional Chinese herbs and medicines, pilates, movement therapy, Reiki, essential oils, cranial sacral therapy and applied prayer.
Human Biofield Energy has subtle energy that can work effectively [9]. CAM therapies have been practiced worldwide with reported clinical benefits in different health disease profiles [10]. This energy can be harnessed and transmitted by individuals into living and non-living things via the process of Biofield Energy Healing. Biofield Energy Treatment (the Trivedi Effect®) has been published in numerous peer-reviewed science journals with significant outcomes in many scientific fields such as cancer research [11, 12], microbiology and biotechnology [13-15], pharmaceutical science [16-19], agricultural science [20-22], materials science [23-25], dietary supplement [26,27], skin health [28,29], human health and wellness. The planned to evaluate the impact of the Biofield Energy Healing Treatment (the Trivedi Effect®) on the test formulation for antioxidant action concerning lipid peroxidation, antioxidant activity using standard assays.
Materials and Methods
Chemicals and reagents
Calcitriol, pyridoxine hydrochloride (vitamin B6), beta carotene (retinol, Provit A), zinc chloride, and magnesium (II) gluconate were purchased from TCI, Japan. Copper chloride, calcium chloride, cyanocobalamin (vitamin B12), cholecalciferol (vitamin D3), sodium carboxymethyl cellulose (Na-CMC), vitamin E (Alpha-Tocopherol), and iron (II) sulfate were procured from Sigma-Aldrich, USA. Sodium selenate and ascorbic acid were obtained from Alfa Aesar, India. Panax ginsengextract and cannabidiol isolate were obtained from Panacea Phytoextracts, India and Standard Hemp Company, USA, respectively. Other chemicals used in this experiment were analytical grade procured from India.
Experimental animals
Randomly breed male Sprague Dawley (SD) rats with body weight ranges from 200 to 300 gm were used in this study. The animals were purchased from M/s. Vivo Bio Tech, Hyderabad, India. Animals were randomly divided into nine groups based on their body weights consist of 6 animals of each group. They were kept individually in sterilized polypropylene cages with stainless steel top grill having provision for holding pellet feed and drinking water bottle fitted with stainless steel sipper tube. The animals were maintained as per standard protocol throughout the experiment.
Consciousness energy healing strategies
The test formulation was divided into two parts. One part of each ingredient was considered as the untreated test formulation, where no Biofield Energy Treatment was provided. Another part of each ingredient was received Biofield Energy Treatment by Mr. Mahendra Kumar Trivedi (the Trivedi Effect®) under laboratory conditions for ~3 minutes in the research laboratory, Dabur Research Foundation, New Delhi, India. Besides, three group of animals were also received Biofield Energy Treatment under laboratory conditions for ~3 minutes. The energy transmission was done without touching the samples or animals. Similarly, the control samples were subjected to “sham” healer under the same laboratory conditions for ~3 minutes for comparison purposes. The “sham” healer did not have any knowledge about the Biofield Energy Treatment. After that, the Biofield Energy Treated and untreated test formulations were kept in the similar sealed condition and used as per the study plan. The Biofield Energy Treated animals were also be taken back to experimental room for further proceedings.
Experimental procedure
Seven days after acclimatization, animals were randomized and grouped based on body weight. All the animals except G1 were fed with Vitamin D3 deficient diet (VDD) from day -12 to till the end of the experiment. To induce CYP24A1 expression, to accelerate the catabolism of endogenous vitamin D3, the rats (Group G2 to G6) were receive intraperitoneal injections of 40 ng of 19-nor-1,25- dihydroxyvitamin D2 (Paricalcitol) on days -12, -10, -8, -6, -4, -2, day 1, 3 and 5. Group G1 to G5 animals were dosed with respective formulations from Day 1 to till the end of the experiment. However, Group G6 were not be dosed. Animals (50% of the animals from each group) were kept for overnight fasting on Day 56 (Tentative). However, remaining 50% animals were dosed with respective formulations and were kept for fasting on Day 57 (Tentative) next day animals were bled and serum was separated for the estimation of C-reactive protein (CRP). After bleeding, cerebrospinal fluid (CSF) were collected by standard in-house method using stereotaxic instrument for the estimation of KLOTHO, Beta-Endorphin, Serotonin, and 1, 25 (OH)2 D3 by ELISA method.
Estimation of klotho protein, beta-Endorphin, serotonin and 1, 25 (Oh)2 D3 In cerebrospinal fluids (CSF)
The Klotho protein expression was determined using Rat Klotho ELISA Kit in rat’s CSF in according to the manufacturer’s instructions [30].
Assessment of Serum C-reactive protein (CRP)
Serum C-reactive protein were estimated using standard ELISA assay followed by manufacturer instructions. Serum was collected from all the animals after completion of the experiment was examined for level of CRP. The detailed test procedure of the identification of serum C-reactive protein were performed using manufactured instructions as per individual ELISA kit. The CRP level was tested using CUSABIO, ELISA Assay Kit as per manufacturer instructions.
Statistical analysis
The data were expressed as mean ± Standard Error of Mean (SEM) and subjected to statistical analysis using Sigma Plot (Version 11.0). For multiple comparison One-way analysis of variance (ANOVA) followed by post-hoc analysis by Dunnett’s test and for between two groups comparison Student’s t-test was performed. The p≤0.05 was considered as statistically significant.
Results and Discussion
Estimation of klotho protein in Cerebrospinal fluids (CSF)
Figure 1: The effect of the test formulation on the level of Klotho protein in cerebrospinal fluids (CSF) in male Sprague Dawley rats. G: Group; G1: Normal control (0.5% CMC); G2: Disease control (VDD: Vitamin D3 deficient diet + 0.5% CMC); G3: Reference item (VDD + Calcitriol); G4: (VDD + untreated test formulation); G5: (VDD + Biofield Energy Treated test formulation); G6: (VDD + Biofield Energy Treatment per se to animals from day -15; G7: (VDD + Biofield Energy Treated test formulation from day -15); G8: (VDD + Biofield Energy Treatment per se plus Biofield Energy Treated test formulation from day -15), and G9: (VDD + Biofield Energy Treatment per se animals plus untreated test formulation). Values are expressed as mean ± SEM, n=6 in each group.
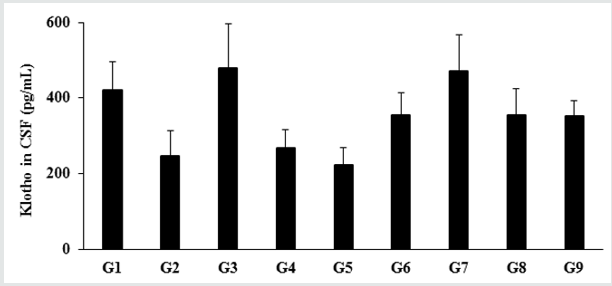
The impact of the test formulation on the expression of Klotho protein in Cerebrospinal Fluids (CSF) is shown in Figure 1. The level of Klotho protein in the normal control (G1) group was 419.71 ± 75.81 pg/mL and it was decreased by 41.52% in the disease control (G2) group (245.43 ± 69.12 pg/mL) induced by vitamin D3 Deficiency Diet (VDD). The positive control (calcitriol) showed 95.46% increase the level of Klotho protein expression as compared to the G2 group. Further, expression of Klotho protein was significantly increased by 9.31%, 44.24%, 91.97%, 44.24%, and 43.07% in the untreated test formulation (G4), Biofield Energy Treatment per se to animals from day -15 (G6), Biofield Energy Treated test formulation from day -15 (G7), Biofield Energy Treatment per se plus Biofield Energy Treated test formulation from day -15 (G8), and Biofield Energy Treatment per se animals plus untreated test formulation (G9) groups, respectively as compared to the G2 group. Further, the level of Klotho protein was significantly increased by 31.95%, 75.61%, 31.95%, and 30.88% in the G6, G7, G8, and G9 groups, respectively as compared to the untreated test formulation group (G4). Klotho protein acts as an anti-aging biomarker. Klotho gene is recognized as a putative aging-suppressor gene, has a great interest and provides more useful information of the aging process. Data obtained from one experiment in mice reported that the overexpression of the Klotho gene extends the lifespan, and mutations to the klotho gene which shorten the lifespan [31,32].
Assessment of CSF biomarker - β-endorphin
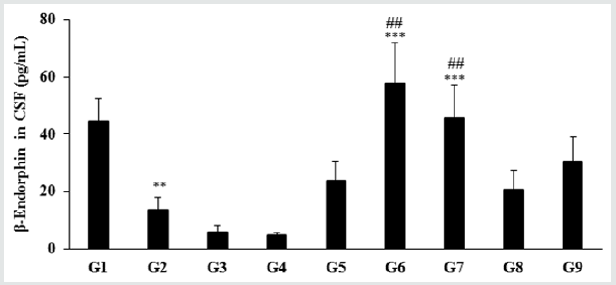
The level of β-endorphin in the normal control group (G1) was 44.48 ± 7.87 pg/mL and it was significantly (p≤0.01) decreased by 69.51% in the disease control (G2) group (13.56 ± 4.36 pg/mL) induced by vitamin D3 Deficiency Diet (VDD). Besides, secretion of β-endorphin was significantly increased by 75.59%, 325.37% (p≤0.001), 235.47% (p≤0.001), 52.80%, and 125.88% in the Biofield Energy Treated test formulation (G4), Biofield Energy Treatment per se to animals from day -15 (G6), Biofield Energy Treated test formulation from day -15 (G7), Biofield Energy Treatment per se plus Biofield Energy Treated test formulation from day -15 (G8), and Biofield Energy Treatment per se animals plus untreated test formulation (G9) groups, respectively as compared to the G2 group. Further, the level of β-endorphin was significantly increased by 418.74%, 1156.64% (p≤0.01), 891.07% (p≤0.01), 351.42%, and 567.32% in the G5, G6, G7, G8, and G9 groups, respectively as compared to the untreated test formulation group (G4). β-endorphin is an endogenous opioid neuropeptide and peptide hormone, considered as cognition, pain and inflammatory biomarker Figure 2. It is produced in certain neurons within the central nervous system and peripheral nervous system to relieve pain when bound to their mu-opioid receptors [33].
Figure 2: The effect of the test formulation on the level of β-endorphin in cerebrospinal fluids (CSF) in male Sprague Dawley rats. G: Group; G1: Normal control (0.5% CMC); G2: Disease control (VDD: Vitamin D3 deficient diet + 0.5% CMC); G3: Reference item (VDD + Calcitriol); G4: (VDD + untreated test formulation); G5: (VDD + Biofield Energy Treated test formulation); G6: (VDD + Biofield Energy Treatment per se to animals from day -15; G7: (VDD + Biofield Energy Treated test formulation from day -15); G8: (VDD + Biofield Energy Treatment per se plus Biofield Energy Treated test formulation from day -15), and G9: (VDD + Biofield Energy Treatment per se animals plus untreated test formulation). Values are expressed as mean ± SEM, n=6 in each group. ***p≤0.001 vs. G2, ##p≤0.01 vs. G4, and **p≤0.01 vs. G1.
Estimation of 5-hydroxy tryptamine (Serotonin) in CSF
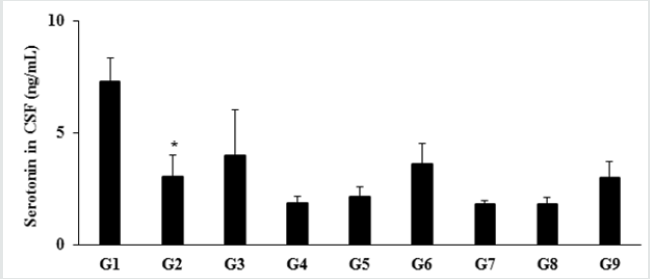
The level of serotonin or 5-hydroxy tryptamine (5-HT) in the normal control group (G1) was 7.29 ± 1.03 ng/mL and it was significantly (p≤0.05) decreased by 58.02% in the disease control (G2) group (3.06 ± 0.93 ng/mL) induced by vitamin D3 Deficiency Diet (VDD). Besides, secretion was increased by 29.41% and 17.32% in the positive control (G3) and Biofield Energy Treatment per se to animals from day -15 (G6) groups, respectively as compared to the G2 group. Further, the level of serotonin was increased by 16.30%, 95.11% and 63.59% in the G5, G6, and G9 groups, respectively as compared to the untreated test formulation group (G4). Serotonin (5-HT) in neuron and neurotransmitter loss leads to aging. The incomplete neurodegenerative processes and serotonergic neurotransmission also leads to aging process [34]. In this experiment, the Biofield Energy Treated test formulation had significantly improve the level of serotonin, which might reduce aging process Figure 3.
Figure 3: Effect of the test formulation on the level of serotonin in cerebrospinal fluids (CSF) in male Sprague Dawley rats. G: Group; G1: Normal control (0.5% CMC); G2: Disease control (VDD: Vitamin D3 deficient diet + 0.5% CMC); G3: Reference item (VDD + Calcitriol); G4: (VDD + untreated test formulation); G5: (VDD + Biofield Energy Treated test formulation); G6: (VDD + Biofield Energy Treatment per se to animals from day -15; G7: (VDD + Biofield Energy Treated test formulation from day -15); G8: (VDD + Biofield Energy Treatment per se plus Biofield Energy Treated test formulation from day -15), and G9: (VDD + Biofield Energy Treatment per se animals plus untreated test formulation). Values are expressed as mean ± SEM, n=6 in each group. *p≤0.05 vs. G1.
Evaluation of 1, 25 (OH)2 D3 in CSF
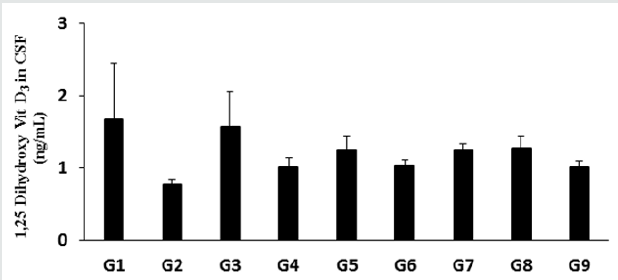
The level of 1, 25 (OH)2 D3 in the normal control group (G1) was 1.67 ± 0.78 ng/mL and it was significantly decreased by 53.89% in the disease control (G2) group (0.77 ± 0.07 ng/mL) induced by vitamin D3 Deficiency Diet (VDD) is shown in Figure 4. The positive control group (G3) had significantly increased the level of 1, 25 (OH)2 D3 by 105.19% compared to the G2 group. Besides, the level of 1, 25 (OH)2 D3 was significantly increased by 31.17%, 62.34%, 33.77%, 62.34%, 64.94%, and 31.17% in the Biofield Energy Treated test formulation (G4), Biofield Energy Treated test formulation (G5), Biofield Energy Treatment per se to animals from day -15 (G6), Biofield Energy Treated test formulation from day -15 (G7), Biofield Energy Treatment per se plus Biofield Energy Treated test formulation from day -15 (G8), and Biofield Energy Treatment per se animals plus untreated test formulation (G9) groups, respectively compared to the G2 group. Further, the level of 1, 25 (OH)2 D3was also significantly increased by 23.76%, 23.76%, and 25.74% in the G5, G7, and G8 groups, respectively.
Figure 4: The effect of the test formulation on the level of 1, 25 (OH)2 D3 in cerebrospinal fluids (CSF) in male Sprague Dawley rats. G: Group; G1: Normal control (0.5% CMC); G2: Disease control (VDD: Vitamin D3 deficient diet + 0.5% CMC); G3: Reference item (VDD + Calcitriol); G4: (VDD + untreated test formulation); G5: (VDD + Biofield Energy Treated test formulation); G6: (VDD + Biofield Energy Treatment per se to animals from day -15; G7: (VDD + Biofield Energy Treated test formulation from day -15); G8: (VDD + Biofield Energy Treatment per se plus Biofield Energy Treated test formulation from day -15), and G9: (VDD + Biofield Energy Treatment per se animals plus untreated test formulation). Values are expressed as mean ± SEM, n=6 in each group.
Effect of the test formulation on serum CRP level
Figure 5: The effect of the Test formulation on change in serum CRP level in vitamin D3 deficiency diet-induced Sprague Dawley rats. G: Group; G1: Normal control (0.5% CMC); G2: Disease control (VDD: Vitamin D3 deficient diet + 0.5% CMC); G3: Reference item (VDD + Calcitriol); G4: (VDD + untreated test formulation); G5: (VDD + Biofield Energy Treated test formulation); G6: (VDD + Biofield Energy Treatment per se to animals from day -15; G7: (VDD + Biofield Energy Treated test formulation from day -15); G8: (VDD + Biofield Energy Treatment per se plus Biofield Energy Treated test formulation from day -15), and G9: (VDD + Biofield Energy Treatment per se animals plus untreated test formulation). Values are expressed as mean ± SEM, n=6 in each group. ***p≤0.001 vs. G1 and G2.
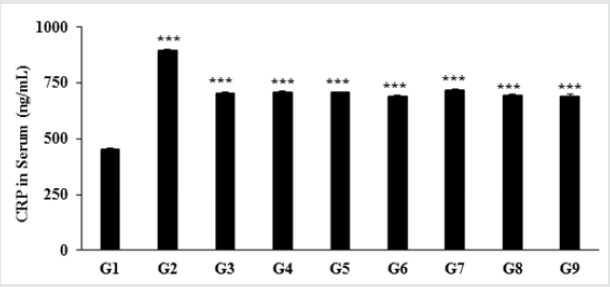
The effect of the novel test formulation on the level of serum c-reactive protein (CRP) is presented in Figure 1. The serum CRP level in the disease control (vitamin D3 deficiency) group was 895.29 ± 6.02 ng/mL, which was found to be 98.06% higher than that of the normal control (G1) group 452.04 ± 3.80 ng/mL. However, calcitriol group (G3) showed reduced serum CRP level (704.59 ± 6.81 ng/ mL) by 21.30% as compared with the G2 group. The experimental groups such as untreated test formulation to the untreated animals (G4) showed reduced CRP level (708.06 ± 6.37 ng/mL) by 20.91% as compared with the G2 group. Similarly, Biofield Energy Treated test formulation to the untreated animals (G5) reduced the serum CRP level (705.79 ± 4.38 ng/mL) by 21.17% as compared to the G2 group. Biofield Energy Treatment per se to the animals (G6) reduced the CRP level (688.59 ± 6.46 ng/mL) by 23.09% lower as compared to the G2 group. In addition, 15 days pre-treatment of Biofield Energy Treated test formulation (G7) reduced the CRP level (718.14 ± 2.95 ng/mL) by 19.79% as compared to the G2. Another group, 15 days pre-treatment of Biofield Energy Treated test formulation to the Biofield Energy Treated animals (G8) reduced the CRP level (694.41 ± 5.89 ng/mL) by 22.44% as compared to the G2. Similarly, the untreated test formulation to the Biofield Energy Treated animals (G9) reduced the CRP level (688.61 ± 13.29 ng/ mL) by 23.09% as compared to the G2 group. CRP is one of the major inflammatory biomarkers (highly sensitive protein) for inflammatory disorders [35,36]. Thus, Biofield Energy Treatment per se and the test formulation significantly reduced the serum CRP, which significantly improve the inflammatory conditions Figure 5.
In this research plan, four groups were considered as preventive maintenance groups. These groups were G6 (Biofield Energy Treatment per se to animals at -15 days), G7 (Biofield Energy Treated test formulation from day -15), G8 (Biofield Energy Treatment per se to animals along with Biofield Treated test formulation from day -15), and G9 (Biofield treatment per se at -15 days to animals with untreated test formulation). The results showed a significant slowdown of disease progression and all other disease-related symptoms/complications and also reduced the chances of disease susceptibility in these groups. Specifically, group G6 (preventive Biofield Energy Treatment group per se at -15 days) showed the best results as a preventive treatment group compared to the other groups. Based on the overall data, it suggests that the Biofield Energy Healing Therapy was found to be most effective and beneficial to prevent and protect from the occurrence of any type of disease in the rat model. The data indicated that this therapy could act as a preventive maintenance therapy to prevent the occurrence of disease, slow down the disease progression when disease-related complications are present which will ultimately improve the overall health and quality of life.
Conclusion
Results of the study revealed that the level of Klotho protein (anti-aging biomarker) in cerebro-spinal fluids were significantly increased by 44.2%, 92.0%, 44.2%, and 43.1% in the Biofield Energy Treatment per se to animals from day -15 (G6), Biofield Energy Treated test formulation from day -15 (G7), Biofield Energy Treatment per se plus Biofield Energy Treated test formulation from day -15 (G8), and Biofield Energy Treatment per se animals plus untreated test formulation (G9) groups, respectively as compared to the disease control group (G2). Moreover, the level of β-endorphin (cognition, pain and inflammation biomarker) was significantly increased by 418.4%, 1155.7% (p≤0.01), 890.4% (p≤0.01), 351%, and 566.7% in the G5, G6, G7, G8, and G9 groups, respectively as compared to the G4 group. Moreover, serotonin level was increased by 94.8%, and 63.4% in the G6 and G9 groups, respectively as compared to the G4. Further, 1, 25 (OH)2 D3 was significantly increased by 61.8%, 33.4%, 61.5%, 64.5%, and 30.6% in the G5, G6, G7, G8, and G9 groups, respectively as compared to the VDD induced group (G2). The level of c-reactive protein (CRP, inflammation biomarker) was reduced by 21.2%, 23.1%, 19.8%, 22.4%, and 23.1% in the G5, G6, G7, G8, and G9 groups, respectively as compared to the G2 group. The current findings conclude that the Trivedi Effect®-Biofield Energy Healing Treatment has significantly enhanced the antiaging, cognitive, and anti-inflammatory biomarkers level that could be helpful in various aging/psychiatric or inflammatory disorders. which can also be used to improve the overall health. Biofield Energy Healing Treatment (The Trivedi Effect®) per se showed the best results with respect to different beneficial efficacy and biomarker parameters in the preventive maintenance group, G6, as compared to the other preventive maintenance groups (G7, G8, and G9) in the rat model study.
The Biofield Energy Healing Treatment also helped to slow down the disease progression and disease-related complications impacting the overall animals’ health. These data suggested that Biofield Energy Treatment per se and Biofield Energy Treated Test formulation in combination would be the best treatment strategy to prevent and protect from the occurrence of any type of disease. Therefore, the Biofield Energy Healing Treatment (the Trivedi Effect®) per se might be effective in healthy humans when used as a preventive maintenance therapy to sustain good health, to boost overall health, promote healthy aging and increase quality of life. In the presence of disease, the Biofield Energy therapy might reduce the severity of any acute/chronic disease (such as auto-immune related and inflammatory disorders) and / or slow the disease progression. Thus, the Biofield Energy Treated test formulation may act as an effective anti-inflammatory and immunomodulatory product for various autoimmune disorders such as Addison Disease, Systemic Fibromyalgia, Lupus Erythematosus, Hashimoto Thyroiditis, Celiac Disease (gluten-sensitive enteropathy), Multiple Sclerosis, Dermatomyositis, Graves’ Disease, Pernicious Anemia, Aplastic Anemia, Type 1 Diabetes, Myasthenia Gravis, Crohn’s Disease, Vasculitis, Scleroderma, Rheumatoid Arthritis, Psoriasis, Reactive Arthritis, Sjogren Syndrome, Chronic Fatigue Syndrome, Vitiligo, and Alopecia Areata, as well as inflammatory disorders such as Irritable Bowel Syndrome (IBS), Asthma, Ulcerative Colitis, Parkinson’s Disease, Alzheimer’s Disease, Dermatitis, Atherosclerosis, Hepatitis, and Diverticulitis. Further, the Biofield Energy Healing Treated test formulation can also be used in the prevention of immune-mediated tissue damage in cases of organ transplants like kidney transplants, heart transplants, and liver transplants, and in the improvement of overall health and quality of life.
Acknowledgements
The authors are grateful to Dabur Research Foundation, Trivedi Science, Trivedi Global, Inc., and Trivedi Master Wellness for their support throughout the work.
References
- Meehan M, Penckofer S (2014) The role of vitamin D in the aging adult. J Aging Gerontol 2(2): 60-71.
- Holick MF (2007) Vitamin D deficiency. N Engl J Med 357: 266-281.
- Boucher BJ (2012) The problems of vitamin D insufficiency in older people. Aging Dis 3(4): 313-329.
- Thomas MK, LloydJones DM, Thadhani RI, Shaw AC, Deraska DJ, et al. (1998) Hypovitaminosis D in medical inpatients. N Eng J Med 338(12): 777-783.
- Houston M (2014) The role of nutrition and nutraceutical supplements in the treatment of hypertension. World J Cardiol 6(2): 38-66.
- Bishop WM, Zubeck HM (2012) Evaluation of microalgae for use as nutraceuticals and nutritional supplements. J Nutr Food Sci 2(5): 147.
- Houston M (2013) Nutrition and nutraceutical supplements for the treatment of hypertension: Part I. J Clin Hypertens (Greenwich) 15(12): 752-757.
- Qureshi NA, Al-Bedah AM (2013) Mood disorders and complementary and alternative medicine: A literature review. Neuropsychiatr Dis Treat 9: 639-658.
- Jain S, Hammerschlag R, Mills P, Cohen L, Krieger R, et al. (2015) Clinical studies of biofield therapies: Summary, methodological challenges, and recommendations. Glob Adv Health Med 4: 58-66.
- Rubik B (2002) The biofield hypothesis: Its biophysical basis and role in medicine. J Altern Complement Med 8(6): 703-717.
- Trivedi MK, Patil S, Shettigar H, Mondal SC, Jana S (2015) The potential impact of biofield treatment on human brain tumor cells: A time-lapse video microscopy. J Integr Oncol 4(3): 141.
- Trivedi MK, Patil S, Shettigar H, Gangwar M, Jana S (2015) In vitro evaluation of biofield treatment on cancer biomarkers involved in endometrial and prostate cancer cell lines. J Cancer Sci Ther 7: 253-257.
- Trivedi MK, Branton A, Trivedi D, Nayak G, Mondal SC, Jana S (2015) Antimicrobial sensitivity, biochemical characteristics and biotyping of Staphylococcus saprophyticus: An impact of biofield energy treatment. J Women’s Health Care 4(6): 1-6.
- Trivedi MK, Branton A, Trivedi D, Nayak G, Mondal SC, et al.(2015) Evaluation of antibiogram, genotype and phylogenetic analysis of biofield treated Nocardia otitidis. Biol Syst Open Access 4(2): 2-6.
- Trivedi MK, Branton A, Trivedi D, Nayak G, Charan S, Jana S (2015) Phenotyping and 16S rDNA analysis after biofield treatment on Citrobacter braakii: A urinary pathogen. J Clin Med Genom 3(1): 2-8.
- Branton A, Jana S (2017) The influence of energy of consciousness healing treatment on low bioavailable resveratrol in male Sprague Dawley rats. International Journal of Clinical and Developmental Anatomy 3(3): 9-15.
- Branton A, Jana S (2017) The use of novel and unique biofield energy healing treatment for the improvement of poorly bioavailable compound, berberine in male Sprague Dawley rats. American Journal of Clinical and Experimental Medicine 5(4): 138-144.
- Branton A, Jana S (2017) Effect of the biofield energy healing treatment on the pharmacokinetics of 25-hydroxyvitamin D3[25(OH)D3] in rats after a single oral dose of vitamin D3. American Journal of Pharmacology and Phytotherapy 2(1): 11-18.
- Trivedi MK, Branton A, Trivedi D, Nayak G, Gangwar M, et al. (2016) Molecular analysis of biofield treated eggplant and watermelon crops. Adv Crop Sci Tech 4: 208.
- Trivedi MK, Branton A, Trivedi D, Nayak G, Mondal SC, et al.(2015) Morphological characterization, quality, yield and DNA fingerprinting of biofield energy treated alphonso mango (Mangiferaindica L.). Journal of Food and Nutrition Sciences 3(6): 245-250.
- Trivedi MK, Branton A, Trivedi D, Nayak G, Mondal SC, et al. (2015) Evaluation of plant growth, yield and yield attributes of biofield energy treated mustard (Brassica juncea) and chickpea (Cicer arietinum) seeds. Agriculture, Forestry and Fisheries 4(6): 291-295.
- Trivedi MK, Branton A, Trivedi D, Nayak G, Mondal SC, et al. (2015) Evaluation of plant growth regulator, immunity and DNA fingerprinting of biofield energy treated mustard seeds (Brassica juncea). Agriculture, Forestry and Fisheries 4(6): 269-274.
- Trivedi MK, Tallapragada RM, Branton A, Trivedi D, Nayak G, et al. (2015) Characterization of physical and structural properties of aluminum carbide powder: Impact of biofield treatment. J Aeronaut Aerospace Eng 4(1): 1-4.
- Trivedi MK, Nayak G, Patil S, Tallapragada RM, Latiyal O, et al. (2015) Impact of biofield treatment on atomic and structural characteristics of barium titanate powder. Ind Eng Manage 4(3): 1-6.
- Trivedi MK, Patil S, Nayak G, Jana S, Latiyal O (2015) Influence of biofield treatment on physical, structural and spectral properties of boron nitride. J Material Sci Eng 4(4): 1-5.
- Trivedi MK, Nayak G, Patil S, Tallapragada RM, Jana S, et al. (2015) Bio-field treatment: An effective strategy to improve the quality of beef extract and meat infusion powder. J Nutr Food Sci 5: 389.
- Trivedi MK, Tallapragada RM, Branton A, Trivedi D, Nayak G, Mishra RK, Jana S (2015) Biofield treatment: A potential strategy for modification of physical and thermal properties of gluten hydrolysate and ipomoea macroelements. J Nutr Food Sci 5(4): 1-8.
- Kinney JP, Trivedi MK, Branton A, Trivedi D, Nayak G, et al.(2017) Overall skin health potential of the biofield energy healing basedherb mineral formulation using various skin parameters. American Journal of Life Sciences 5(2): 65-74.
- Singh J, Trivedi MK, Branton A, Trivedi D, Nayak G, et al. (2017) Consciousness energy healing treatment based herbomineral formulation: A safe and effective approach for skin health. American Journal of Pharmacology and Phytotherapy 2(1): 1-10.
- Kim AJ, Ro H, Kim H, Chang JH, Lee HH, et al. (2016) Klotho and S100A8/A9 as discriminative markers between pre-renal and intrinsic acute kidney injury. PLoS ONE 11(1): e0147255.
- Xu Y, Sun Z (2015) Molecular basis of klotho: From gene to function in aging. Endocr Rev 36(2): 174-193.
- Massó A, Sánchez A, Gimenez-Llort L, Lizcano JM, Cañete M, et al. (2015) Secreted and transmembrane αklotho isoforms have different spatio-temporal profiles in the brain during aging and Alzheimer's disease progression. PLoS ONE 10(11): e0143623.
- Sprouse-Blum SS, Smith G, Sugai D, Parsa FD (2010) Understanding endorphins and their importance in pain management. Hawaii Med J 69(3): 70-71.
- Meltzer CC, Smith G, DeKosky ST, Pollock BG, Mathis CA, et al. (1998) Serotonin in aging, late-life depression, and Alzheimer's disease: the emerging role of functional imaging. Neuropsychopharmacology 18(6): 407-430.
- Vermeire S, Van Assche G, Rutgeerts P (2006) Laboratory markers in IBD: Useful, magic, or unnecessary toys?. Gut 55(3): 426-431.
- Hod K, Ringel-Kulka T, Martin CF, Maharshak N, Ringel Y (2016) High-sensitive C-Reactive protein as a marker for inflammation in irritable bowel syndrome. J Clin Gastroenterol 50(3): 227-232.

Top Editors
-

Mark E Smith
Bio chemistry
University of Texas Medical Branch, USA -

Lawrence A Presley
Department of Criminal Justice
Liberty University, USA -

Thomas W Miller
Department of Psychiatry
University of Kentucky, USA -

Gjumrakch Aliev
Department of Medicine
Gally International Biomedical Research & Consulting LLC, USA -

Christopher Bryant
Department of Urbanisation and Agricultural
Montreal university, USA -

Robert William Frare
Oral & Maxillofacial Pathology
New York University, USA -

Rudolph Modesto Navari
Gastroenterology and Hepatology
University of Alabama, UK -

Andrew Hague
Department of Medicine
Universities of Bradford, UK -

George Gregory Buttigieg
Maltese College of Obstetrics and Gynaecology, Europe -

Chen-Hsiung Yeh
Oncology
Circulogene Theranostics, England -
.png)
Emilio Bucio-Carrillo
Radiation Chemistry
National University of Mexico, USA -
.jpg)
Casey J Grenier
Analytical Chemistry
Wentworth Institute of Technology, USA -
Hany Atalah
Minimally Invasive Surgery
Mercer University school of Medicine, USA -

Abu-Hussein Muhamad
Pediatric Dentistry
University of Athens , Greece

The annual scholar awards from Lupine Publishers honor a selected number Read More...


