


Lupine Publishers Group
Lupine Publishers
ISSN: 2690-5779
Review Article(ISSN: 2690-5779) 
Modeling and Performance of an Integrated Solar Water Pumping System Volume 1 - Issue 3
Received: February 07,2021 Published: February 26, 2021
Corresponding author: Said MA Ibrahim,Mechanical Engineering Department, Faculty of Engineering, Al-Azhar University, Cairo, Egypt
DOI: 10.32474/JOMME.2021.01.000117
Abstract
Solar water pumping systems provide a proper energy solution especially in rural and isolated areas where the traditional sources of power (electricity or diesel) are unavailable or very costly. Solar energy is available with abundant quantities of daily irradiance, and it is a clean and carbon free source of energy. The present work furnishes a mathematical model and performance evaluation of an integrated solar water pumping system for different water demands through a comprehensive design tool simulation program prepared and designed by the authors. The model calculates the solar radiation data for the selected cite. The simulated model, based upon the solar radiation values, can provide, for the specified water demands, the related hydraulic pump electric power for the desired pump total dynamic head, the required PV peak power and its related area requirements, and the corresponding total cost of the system components in Euro. The present program is universal and can be used to design solar water pumping systems anywhere in the word. The present results are for Cairo Egypt, for water demands range from 50-300 m3/ day. Egypt enjoys an average value of solar radiation of 5.5 kWh/m2/day. The present research offers a good accurate quick tool for designers, users, and buyers of such systems.
Keywords: Mathematical model; Solar; Water pumping system; Water demand; Efficiency; PV sizing; Cost
Introduction
To narrow the present gap between water demands and the
required energy needs in the agriculture sector in Egypt as in many
countries, Solar Water Pumping Systems (SWPS) are considered
essential priority solution to provide the required energy for these
demands. A SWPS can be a cost effective, stand-alone for serving
the remote water needs, whether it is for irrigation, animal grazing,
or potable use. The present research is applied to Cairo, Egypt. The
need of solar pumps in Egypt is an extremely important topic that
depends on the availability of solar radiation and the amount of
stored underground water. The availability of underground water
in the Egyptian desert is given by theNational Specialized Boards
[1].Solar radiation is abundantly available since Egypt is lying in
the middle of the solar belt countries with an average value of 5.5
kWh/m2/day. Solar energy is renewable and clean source of energy.
Being zero carbon source, it can effectively reducehigh pollutions,
global warming, and climatic changes. SWPS has low operating
costs in general that gives it the advantage of being cost-effective
systems. The irrigation water withdrawal is the sum of the actual
water needed for irrigation, with the addition of the water that is
lost in its distribution and application, which by far exceeds the
consumptive use of irrigation [2]. Much research has been carried
out to minimize the losses of irrigation water. Drip irrigation is the
method that allows for the lowest water losses and consequently
needs the least amount of water in order to sufficiently irrigate
plants [3]. Most current photovoltaic (PV) pumping systems are
equipped with a Maximum Power Point Tracker (MPPT). This
electronic device is a DC-DC converter that is able to operate the PV
array in its maximum power point for any given solar irradiation [4].
A benefit of using solar energy to power agricultural water pump
systems is that the increased water requirements for livestock and
irrigation tend to coincide with the seasonal increase of incoming
solar energy. This means that the volume of water pumped by
the SWPS in a given interval depends on the total amount of
solar energy available at that time period. Specifically, the flow rate of the water pumped is determined by both the intensity of
the solar energy available and the size of the PV array used to
convert the solar energy into direct current (DC) electricity. The
principal components of the SWPS are PV array and its supporting
structure, an electrical controller, and an electric powered pump
[5]. It is important that the components be designed as part of an
integrated system to ensure that all the equipment are compatible
and that the system operates as intended.Solar-powered pumps
are characterized as either positive displacement pumps (e.g.,
diaphragm, piston, or helical rotor) or centrifugal pumps. Positive
displacement pumps are typically used when the Total Dynamic
Head (TDH) is high and low flow rate. On the other hand, centrifugal
pumps are used for low TDH and high flow rates.
The scope of this research paper is to present a mathematical
model and build a simulation program to evaluate the performance
of the SWPS for different flow rates and TDH. Finally a complete
sizing of the system components is identified and the integrated
system cost, power, and land requirements are estimated. The
present results are for Cairo, Egypt.
Components of The Solar Water Pumping System
It is essential to calculate the adequate power rating for a
photovoltaic system to meet the total required electrical load. Prior
to the design of the system, the daily average sun hour, amount
of daily solar radiation falling on the horizontal surface, and the
ambient temperature should be defined. The SWPS consists of the
following components [6].
a) PV module which converts solar energy into electricity to
run the pumps.
b) Inverter to covert DC power generated from the PV panel
to AC to meet the load of pumps.
c) Battery bank to drive the pumps shortage of solar
radiation and charger controller to regulate and adapt battery
charging (in case of using storage system).
d) Variable speed pump to be operated according to the
variable solar energy input (in case of not use storage system).
An SWPS as described above with a variable speed pump is
illustrated in (Figure 1)
Figure 1: A typical solar powered water pump system [7].

Theoretical Modeling of The Solar Water Pumping System
The proper design of an SWPS, for certain cite and application,
requires some basic information which are:
i. The amount of solar energy incident on the horizontal and
inclined surfaces.
ii. The required water demand.
iii. The total dynamic head (TDH) of the pump.
iv. Selecting a pump that satisfies both the water demand
and the desired pressure.
v. Estimating the PV power to meet the demanded electric
load for the chosen pump.
vi. Calculating the area of PV modules required for the
system.
vii. Determination of the total SWPS cost of the integrated
system.
The Present Computer Simulation Program
The present software package has three main routines: solar, pumping, and desalination. The program has one main input screen which presents the three main tabs of the program, solar, pumping, and desalination, as illustrated in (Figure 2) In the current work, only solar and pumping categories are used.
Figure 2: Main screen showing routines of the software.

A computer simulation program was specially designed based on the mathematical model of the system components and, according to the algorithm indicated in the flow chart depicted in (Figure 3) This computer program is fed with the necessary input data, and the output lavishes all the required design results for the SWPS. The program is even capable of giving the recommended companies that can supply all the selected equipment of the system. The program is versatile enough such as it can provide different solutions to choose from based on the input data and costumer requirements and available budget. This software tool is difficult to construct, however simple in use. It is a time saver, and can help the designer or customer to study, easily and quickly, different system design cases or proposals and perform several runs without going to redesign again and again for each case. Also, it allows the designer to decide upon the main components of the system, like PV module, inverter, charge controller, and pumps from different manufacturers. The program is versatile and can provide different solutions to choose from based on the input data, costumer requirements, and budget. The present computer program acts as a solar energy recipe.
Figure 3: Flow chart of the present computer simulation program.

The present computer program is general in the sense that it can be used anywhere in the world, as long as the appropriate input data are used.
Calculating the Amount of Solar Energy Falling on The HorizontaL
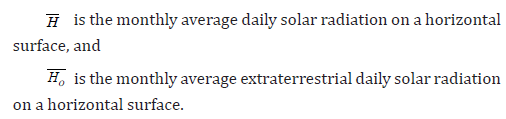
The daily extraterrestrial radiation on a horizontal surface (Ho), at any day of the year, n (n= 1 for January 1 etc.), is calculated by [8]
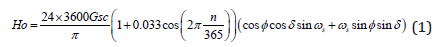
where
Gsc is the solar constant equal to 1,367 W/m2,
δ is the declination angle
s ω
is the sunset hour angle, and
φ is the latitude angle of the site.
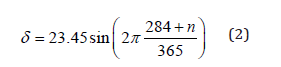
The declination angle (δ ) can be given from Cooper’s equation [8]
The solar hour angleis equal to zero at solar noon and varies by
15 degrees per hour from solar noon. It takes negative sign in the
morning and positive sign in the afternoon.
The sunset hour angle ( ) s ω is an angle equal to the solar hour angle when the sun sets, and is determined from this equation

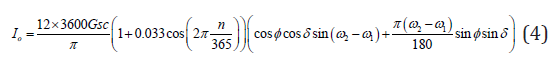
The extraterrestrial radiation on a horizontal surface for an hour period can be estimated by integrating Eq. (1) for a period between hour angles 1 ω and s ω which define an hour (where s ω is the larger) [8]
Clearness index: the monthly average clearness index, T K , is the ratio between extraterrestrial radiation and solar radiation at the surface of the earth. Values of, T K depend on the climates condition and the time of year considered. It can be calculated from this equation [8]
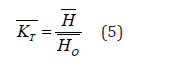
where
The average radiation on a slope surface can be calculated considering the beam, diffuse, and reflected radiation components by using this equation [8]
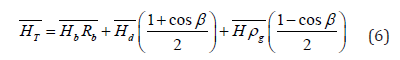
where
Rb = 0 = reflection of radiation on the surface of the earth,
ρ = ground reflectivity, when the monthly average temperature is above 00C = 0.2 and when the monthly average temperature is below -50 C = 0.7 [8], and
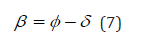
β = slope of the collector, and is given by [8]
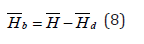
The monthly average daily beam radiation b H , is calculated from this formula
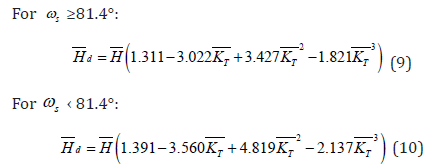
According to sunset hour angle ( ) s ω the monthly average diffuse radiation Hd can be calculated from these equations [8]
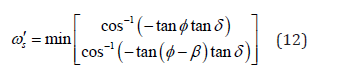
Due to the location of Egypt towards the equator in the northern hemisphere, the ratio between slope surface to the horizontal surface, Rb , is given by [8]
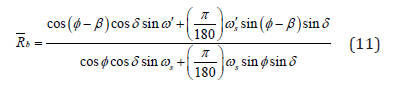
where s ω is the sunset hour angle for tilted surface and is calculated by [8]
In the following (Figure 4) typical data sheet of the solar radiation data, as obtained from the present simulation computer program, for the given city of Cairo are shown.As seen, the solar radiation detection screen has input and results in the same page. System design variables are inputs in the configuration screen as shown in (Figure 4)
Inputs to the program as depicted in (Figure 4) are:
Figure 4: Configuration of solar radiation screen from the software program.

a) The project name and date are entered in the input boxes.
b) Site location by defining the Governorate, State, County or
whatever applicable and the city to obtain the longitude and the
latitude of the location.
The input data for Cairo, Egypt, generated the output results
indicated in (Figure 4)as:
a) Longitude and latitude of the selected location.
b) Monthly and daily irradiances (kWh/m2).
c) Radiance graph for every month of the year.
This screen is of paramount importance, since all design calculations of the SWPS depend on the accuracy and reliability of
the solar radiation results from this software.
Required Water Demand
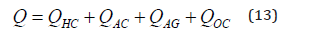
Calculations of the water demand is based on many different factors like user identity (human, kind of animal, kind of plant), climate conditions for the given site, environment, method of irrigation, lifestyle for humans, and human activities (cooking, drinking, bathing, ...etc). The average total water consumption for different activities is computed based on the Egyptian standard code as [9]
Where
QHC = Human water consumption (m3 / day),
QAC =Animal water consumption (m3 / day),
QAC =Agricultural water consumption (m3 / day) and
QOC = Other consumptions (m3 / day).
The daily water demand based on the above given parameters are calculated from the present simulation program, according to the worksheet presented in (Figure 5).
Figure 5: A typical program worksheet for calculating the daily water demand.

Total Dynamic Head of The Pump
The total dynamic head (TDH) is composed of the total static
head (hs), friction head losses (hf), and minor head losses (hm).
The total static head is the difference in height between the water
source inlet level (hi) and the water outlet level (ho). The friction
head losses in the system are developed from the wall shear stress
created at the interface between the fluid flowing inside the pipes
and their walls. These losses are directly proportional to the pipe
length (L), and inversely proportional to the inner diameter of the
pipe (d). Moreover, friction head losses are related to a friction
factor (f), which depends on the Reynolds number (Re) of the flow
and the relative roughness of the inner pipe walls (ε).
Minor head losses (hm) result from the unstable turbulent flow
in pipe fittings, connections, and valves. Its magnitude is quantified
by a loss factor (k), which is specific to each type of fitting and
independent of the fitting material [10]. The total dynamic pumping
head is given as [11]

Where
V = Flow velocity (m/s),
I = Pipe length (m),
D = Pipe inside diameter (m), and
K = Loss coefficient for different components
The program output worksheet for calculating the total suction
head is exhibited in (Figure 6), and that for the total dynamic head
is shown in (Figure 7).
Figure 6: A typical program output worksheet for calculating the total suction head of pump.

Figure 7: A typical computer output for calculating the total dynamic head of pump.

Pump Selection Factors
Pump sizing calculations are based on these factors:
a) Pump flow rate (m3/day).
b) Pumping head (m).
c) Type of pump (centrifugal or positive displacement)
d) Water source (surface or submersible).
e) Different manufacturer’s manuals.
Hydraulic Pump Power
The hydraulic pump power, Ph, required to lift up a certain water volume against a total dynamic head, TDH is given by
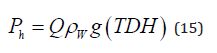
Where
ρw = Water density (1000 kg/m3),
g = Acceleration of gravity (9.81 m/s2), and
Q = Flow rate or volume of water lifted, in m3/s.
The current computer program allows for a complete selection
of surface and submersible pumps as demonstrated in (Figure 8).
Figure 8: A typical computer program worksheet for a complete selection of surface and submersible pumps.

Area of The Pv Panels Required for The Integreted Solar Pumping System
The size of the PV system in Wp for the peak load can be defined as [12]
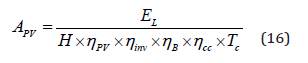
Where
Apv = Total area of photovoltaic requirement (m2),
EL = Peak daily required electrical energy for the SWPS (Wh/
day)
H = daily global irradiation (Wh/m2/d),
PV η , inv η , B η , cc η = efficiencies for photovoltaic, inverter, battery
and charge controller, respectively, and
Tc = Temperature correction factor of the PV module.
The Pv Power for The System
The required photovoltaic modules power PV P (W), to meet the electrical load demand can be estimated as follows
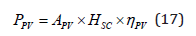
Where
Hsc =Standard solar irradiation, 1,000 W/m2.
After estimating the total area of PV panels (m2), the number of
total modules (Nm) can be determined based on the commercially available area of a single PV panel. The number of modules can be
defined as
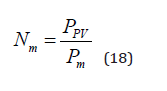
Where
Pm=is the power of the single module (W).
The actual area of all modules, and the exact peak power for all
modules , are calculated by
where
Am is Area of the single module (m2), and
N’m is the corrected number of modules to the nearest integer
number.
The program will give output data based on the inputs provided for it. The program will lavish data for module selection, invertor selection, battery bank and charge controller, and finally the complete design specifications for the total photovoltaic system to match and necessary to operate the SWPS under consideration. (Figures 9, 10, and 11). exhibit typical output results, for certain given inputs, for module selection, invertor selection, and the final PV system data, respectively.
Figure 9: Simulation program worksheet for PV module selection.

Figure 10: Simulation program worksheet for inverter selection.

Figure 11: Simulation program output worksheet of PV components.

Cost of The Swps
The total cost of the SWPS is determined by our computer program by considering the direct cost, indirect costs, and encountered overheads. The direct cost includes prices of land, buildings if any, and all components of the SWPS such as pumps, PV system, frame structure for the modules, piping, and wiring. The indirect costs and overheads represent land preparation, labor, taxes, levelized costs, and any item whenever applicable. A sample of the computer solar water pumping cost output sheet is illustrated in (Figure 12).
Figure 12: Solar water pumping system cost output sheet.

Results and Discussion
Several simulation runs were conducted for the solar water pumping system. The simulated data of the daily average solar radiation for Cairo city is shown in (Figure 13). As the water demand can vary significantly for different water applications (drinking water supply, livestock watering, irrigation, industry, and any application) at different locations in Egypt, therefore six different cases of water needs are used in the simulation model with capacities of 50, 100,150, 200, 250, and 300 (m3 / day).
Figure 13: Simulated data of the daily average solar radiation for Cairo.

According to the average daily water demand (ranging from 50 - 300 m3/day) and TDH (50 m and 150 m), the power required for pumps in kW can be calculated. The relation between water demands and pump power for different values for TDH (m) is demonstrated in (Figure 14). The SWPS features are calculated based on the electrical power needs with specified water demands as given by Eqs. [17] and [13]. Variations of PV peak power and their related areas with the daily water demands are given in (Figures 15 and 16). The results in (Figures 14-16)are in compliance with the theoretical model equations given above.
Figure 14: Pump power for different daily water demands for Cairo.

Figure 15: Solar PV peak power variation different daily water demands for Cairo.

Figure 16: Actual area of panels for different daily water demands for Cairo.

Asa case study for Cairo city several runs of the computer program were performed to get the total cost of the solar water pumping system in Euro for different water demands (m3/day)and different TDH. The obtained results are presented in (Figure 17). It is indicated that the system cost increases as the pump head and water demand increase.
Figure 17: Total cost for different daily water demands for Cairo.

Conclusions
Solar water pumping systems are found to be a good feasible solution for use in many locations and in particular in rural and isolated remote areas where conventional power sources are unavailable, or available at unaffordable cost. In addition, solar energy is a clean source, and abundantly available with an average daily radiation of about 5.5 kWh/m2/day. The present study offers a detailed mathematical modeling and performance evaluation for a complete design of an integrated SWPS, including the PV solar system components for different water demands. This is done by means of a computer program developed and designed by the authors. The program calculates accurately and quickly the pump hydraulic power, PV peak power, PV required area, and total system costs for different pump total dynamic heads and different water demands. The model was applied successfully to calculate for the city of Cairo, Egypt the solar radiation data, and design parameters for the different components of the SWPS, for water demands ranging from 50-300 m3/day. The obtained results comply with the mathematical model. This gives confidence in the present model and software program. The calculated results can be obtained for any water demand, the pump electric power at the desired total dynamic head, the required PV peak power and its related area requirements, and the corresponding total cost of the integrated system in Euro. This program, based on its scientific and commercial merit, offers a much needed powerful accurate good tool for designers, users, and customers. The program is versatile and as such furnishes several solutions for the costumer to select from according to the available budget and desires. The present computer program is quite difficult to construct, but easy to use. It also a time saver. The program is universal and can be applied to any location in the world as long as the proper solar data are supplied together with water needs, and other specific data relevant to the site and project specifications and requirements.
Nomenclatures
Am Module area, m2
At Total area of all modules, m2
QAC Daily Animal Consumption, (m3 / day)
QAGC Daily Agriculture Consumption, (m3 / day)
QHC Daily Human Consumption, (m3 / day)
D Pipe diameter, m
EL daily required electrical energy for pumps the Wh/d
f Friction factor
g Earth gravity, 9.8 m/s2
H Daily irradiation ,Wh/m2/d
Hsc Standard solar irradiation, 1,000 W/m2
hf Major loss, m
hm Minor loss, m
hs Total static head, m
k The loss coefficient for different component.
l Pipe length, m
Nm Number of total modules
Ph The hydraulic Power, W
PPV PV power, W
Pm Module power, W
Pm Module power, W
Pt Total power of all modules, W
Q Total water demand per day, m3/day
TDH Total Dynamic Head, m
Tc Temperature correction factor of the PV module
V Velocity of flow, m/s
hi , ho Height difference between water source inlet (hi) and level of water outlet(ho),m
ρ Water density, kg/cm3
ηB Battery efficiency
ηC Charge controller efficiency
ηinv Inverter efficiency
ηm Motor efficiency
ηp Pump efficiency
ηpv PV efficiency
References
- Hatem MA (1990) National specialized board reports, residential Council. The Arab Republic of Egypt 1: 1974-1989.
- FAO (2015) Aqua stat Database. FAO.
- Darouich HM, Pedras CMG, Gonçalves JM, Pereira LS(2014) Drip vs surface irrigation: A comparison focusing on water saving and economic returns using multi-criteria analysis applied to cotton. Bio systems Engineering 122: 74-90.
- Mohammedi A, Mezzai N, Rekioua D, Rekioua T (2014) Impact of shadow on the performances of a domestic photovoltaic pumping system incorporating an MPPT control: A case study in Bejaia, North Algeria. Energy Conversion and Management 84: 20-29.
- Abdalla M Kishta (2002) "Designing, modeling, and testing a solar water pump for developing countries”. Retrospective Thesis and Dissertations. State University. Paper 391.
- Kleissl J, Deep-Well, Low-Flow Photovoltaic Water Pumping System Design.
- Nicholle Kovach (2010) Design of Small Photovoltaic (PV) Solar-Powered Water Pump Systems, Technical Note No. 28, PORTLAND, OREGON, United state department of Agriculture, Natural Resources Conservation Service.
- Duffie JA, Beckman WA(1991) Solar Engineering of Thermal Processes. 2nd Edition, John Wiley & Sons, USA.
- Hamidat A Benyoucef B, Hartani T (2003) Small-scale irrigation with photovoltaic water pumping system in Sahara regions, Renewable Energy 28(7): 1081–1096.
- Glasnovic Z and Margeta J (2007) A model for optimal sizing of photovoltaic irrigation water pumping systems. Sol Energy 81(7): 904–916.
- Kudela H (2015) Hydraulic Losses in Pipes, Wroclaw Univ. Sci Technol.
- Ahmad GE (2002) Photovoltaic-powered rural zone family house in Egypt. Renewable Energy 26(3): 379–390.


-

Mark E Smith
Bio chemistry
University of Texas Medical Branch, USA -

Lawrence A Presley
Department of Criminal Justice
Liberty University, USA -

Thomas W Miller
Department of Psychiatry
University of Kentucky, USA -

Gjumrakch Aliev
Department of Medicine
Gally International Biomedical Research & Consulting LLC, USA -

Christopher Bryant
Department of Urbanisation and Agricultural
Montreal university, USA -

Robert William Frare
Oral & Maxillofacial Pathology
New York University, USA -

Rudolph Modesto Navari
Gastroenterology and Hepatology
University of Alabama, UK -

Andrew Hague
Department of Medicine
Universities of Bradford, UK -

George Gregory Buttigieg
Maltese College of Obstetrics and Gynaecology, Europe -

Chen-Hsiung Yeh
Oncology
Circulogene Theranostics, England -
.png)
Emilio Bucio-Carrillo
Radiation Chemistry
National University of Mexico, USA -
.jpg)
Casey J Grenier
Analytical Chemistry
Wentworth Institute of Technology, USA -

Hany Atalah
Minimally Invasive Surgery
Mercer University school of Medicine, USA -

Abu-Hussein Muhamad
Pediatric Dentistry
University of Athens , Greece
