


Lupine Publishers Group
Lupine Publishers
ISSN: 2690-5779
Research Artical(ISSN: 2690-5779) 
Experimental Investigation of a Spoiler’s Impact on the Flow Pattern of a High-Speed Sport Car Volume 1 - Issue 2
Received: July 30, 2020 Published: August 18, 2020
Corresponding author: Mohammed Amer, Department of Mechanical Engineering, National Chiao Tung University, 1001 University Road, Hsinchu 300, Taiwan
DOI: 10.32474/JOMME.2020.01.000110
Abstract
In this study, the spoiler effect in a different angle of attacks that makes the maximum downforce is conveyed. Two different facilities are utilized to set up the experiment. A wind tunnel is used to measure the downforce and drag force, and a water tunnel is used to observe the velocity profile and flow field visualization. The result revealed that a 12° angle of attack is the optimal angle for designing the spoiler. Twelve degrees angle of attack provided the highest downforce. This downforce can improve the stability of high-speed sports car without increasing much drag. Compared to the angle of attack of 5°, the downforce of the angle of attack equal to 12° increases 233%, but the drag force only increases by 15% in wind tunnel experiments.
Keywords: Angle of attack; Downforce; Drag force; High-speed car; Spoiler
Introduction
The relative motion of a car causes air resistance. This generates
an aerodynamic force in the opposite direction of motion called
drag. This force is mainly influenced by the shape of the car. Poor
aerodynamic properties will result in higher fuel consumption [1],
especially at higher velocities. The former forces are acting in the
horizontal path concerning the car. Another substantial force acting
on the car in the vertical direction is called downforce or rather a
negative downforce named a lift. Downforce is necessary to hold
the car on the ground. A higher downforce will improve the grip
and protect the car at corners when driving at higher speeds. Fast
automotive vehicles experience high uplift forces, which creates
unexpected accidents. Therefore, spoilers are mainly used for
sports cars.
To enhance the aerodynamic properties, extensions are attached
to the car. These supplementary parts can spoil the unfavorable
drag turbulence air movement across the body of a vehicle in
motion. These automotive devices like splitters, side skirts, vortex
generators (VGs), and canards. These parts are known as spoilers
and can be found in most of the cars. Based on the Coanda effect, the
air tends to follow the shape of the aerofoil. On top of the spoiler,
the air moves faster due to the long-distance and creates an area of
low pressure. The slower moving air below the aerofoil results in
a high-pressure area. This pressure difference is the main reason
for aircraft to fly. Rear spoilers are supposed to create a force in the
opposite direction. To achieve this, a high-pressure area at the top
and a low-pressure area under the spoiler is necessary. It is essential
to know the higher downforce does not lead to a higher drag force.
Also, not only the shape of the spoiler influence the aerodynamic
properties of the car but also the optimal angle of attack can help
in increasing the downforce in parallel of not having any increase
in the drag force or even reduce it. The reconciling of these two
aspects initiates the main goal of a rear spoiler. Similarly, in “Race
car Aerodynamics” usually when a car travels in an unobstructed
situation, the prevalent flow is well-thought-out to be laminar.
However, some conditions like spoilers or the movement of other
vehicles may cause the flow to be turbulent. Initially, this flow can
be laminar, but it may become turbulent because of the disruption produced by the vehicle. This is the purpose to design the spoiler.
As the streamline of moving air particle strikes the spoiler of the
car, it changes to turbulence and causes a swirl around the vehicle’s
boot, which thrusts the tires to the ground generating the required
downforce [2].
Fairly enormous research has been done on spoiler’s design.
Yet, some papers closer to this research drive have been chosen to
present. Abdulwahab [3] researched the front wing and rear wing
effect on the formula car. The rear wing which is like the spoiler was
found in different angles of attack would make different downforce.
Moreover, if the attack angle is too large (10 degrees), the
downforce decreases obviously. The maximum downforce occurred
at 5°. Yakkundi & Mantha [4] presented CFD analysis to observe
w/o spoiler effect on the car. With the spoiler, the pressure on the
rear spoiler upper area was higher than without it. Additionally,
the velocity on the rear spoiler upper area is lower than the car
without the spoiler. From the understanding of the spoiler, it causes
the downforce on the car’s rear and this what Mashud & Das [5]
clarified in their study since the spoilers are designed to reduce lift
and make a considerable increase in drag. It is estimated that the
aerodynamic drag is the governing form of resistance when vehicles
run at speeds of 80 km/h or greater taking into consideration the
fact that 65% of the power required at 110 km/h is consumed
due to overcoming aerodynamic drag [6,7] Mohammad et al. [8]
presented the comparison for an airfoil with the spoiler to the
airfoil without the spoiler and reported the effect of the spoiler for
different angles of attack. The same investigation has been carried
out by Mohammad et al. [9]. Patel et al. [10] reported maximum
negative lift and maximum drag at an angle of attack 200, but they
took 100 angles of attack for their design purpose as 200 is the
critical angle. In investigating the effects of rear spoilers on ground
vehicle aerodynamic drag, Halil et al. [11] found that the addition of
the spoiler caused a decrease in the lift coefficient from 0.26 to 0.05.
An analytical study of downforce adjustable by optimum incidence
has been carried out by Tarulescu et al. [12].
The trend of downforce and drag is critical. Sharma and R Bansal
[13] performed an experimental and numerical study to evaluate
the drag coefficient for a passenger car. They applied spoiler
with VGs on the boot rear side and at the roof of the baseline car
respectively with inclination angle 12°. The results indicated that
the drag coefficient CD is 0.3359 and the lift coefficient CL is 0.1875
for a car with spoiler and VGs. Adding a spoiler with VGs results in
a reduction of the drag coefficient with 4.35% and a lift coefficient
with 18.83% in the head-on wind. Hence, drag force and lift force
on the passenger car reduced proportionally to drag coefficient
and lift coefficient respectively. Furthermore, rounding the edges
partially reduces drag in head-on the wind, but it does not bring
any significant improvements in the aerodynamic efficiency of the
passenger car with spoiler and VGs together. Thus far, the drag force
can be reduced by using add on devices on the vehicle, and fuel economy and stability of a passenger car can be improved. Deressa
& Sureddy [14] studied the effect of fluid flow and the effective drag
of the vehicle at speed of 80 km/h over a 3D standard car (BOLERO)
with attached rear spoiler numerically and compared it with a
scaled base vehicle. They revealed that the CD of Bolero vehicle
was 0.62 which was mentioned in the Bolero catalog matched with
actual Bolero vehicle. CD was 0.59 when the spoiler is at 3°. The
flow angle of air over the spoiler is kept as minimum as possible.
So, it is concluded that the spoiler base curve has to be designed
with a minimum angle of elevation to minimize CD. In essence, it is
observed that CD value is increasing with more elevation in a base
curve when it is analyzed with 28° of elevation. Spoiler CD is 0.69
at 28°. CD of the vehicle with the attached rear spoiler went down
by 4.8%. Finally, the spoiler’s objective to reduce aerodynamic
drag acting on the vehicle was achieved and thus improved the
fuel efficiency of a passenger car which resulted in a 3.2% increase
of fuel economy in on-road mileage test at 80 km/h speed (at
3°). Taking out the previous literature review, the importance of
attaching the spoiler on high-speed cars is noticeable. The current
study will test a car’s spoiler under different angles of attack to get
the optimal value that can achieve the stability of the car on the
road that leads to less energy consumption by the end of the way.
Experimental Setup and Data Reduction
Figure 1: Spoiler’s structure atdifferent angles for the BMW model car.

In this research, a spoiler with a different angle of attack has been used for conducting the experiment in the wind tunnel and water tunnel respectively. The designed spoilers are shown in Figure 1(a) including 0°, 5°, 10°, 12°, and 15° angle of attack. All of them have been produced by the 3D printer. Their shape is similar to the upside-down aerofoil as shown in Figure 1(b). The main purpose of this research is to find out how the angle of attack of a spoiler impacts the aerodynamic properties of a running car, such as downforce, drag force, flow field, etc. Thus, the angle of the attack of the spoiler is an independent variable in the experiment. In the wind tunnel test, the only spoiler is installed in the wind tunnel. The downforce, drag force, and fluid velocity around the spoiler have been measured under a different angle of attack. As for the water tunnel test, the spoiler would be fixed on the 1/24 scale of the BMW model car as exposed in Figure 2, and the streamline of the car with a different angle of spoilers would be observed by PIV and color dye method.
Figure 2: BMW model car.

Wind tunnel experiment
Only the spoiler is installed in the wind tunnel and the angle of attack (θ) has been changed from 0° to 15° as shown in Figure 3. The velocity of air provided by a wind tunnel is set to 4.6 m/s. Besides, three aerodynamic properties have already been measured which are downforce, drag force, and air velocity over the upper surface of the spoiler and air velocity beneath the lower surface of the spoiler.
Figure 3:A schematic diagram of the spoiler.

The main focus is on the downforce and drag force. These two forces are important for car control as mentioned in the literature.
Downforce measurement: The experimental setup is shown in Figure 4 where the spoiler is fixed on the stick firmly by exerting force to rotate the stick and the angle of attack can be adjusted. The spoiler and the weight sensor were put on opposite sides of the equal-arm balance. Based on the principle of level, the net torque should be the same. Thereby, the force sensed by the weight sensor has the same magnitude, but with a reverse direction to the downforce exerted on the spoiler
Figure 4: Illustration of downforce measurement via the experimental setup.

Drag force measurement: The experimental setup is shown in Figure 5. The spoiler and the weight sensor were put on opposite sides of the L-shaped level. The force sensed by the weight sensor is perpendicular to the drag force of the spoiler. However, due to the equal-arm balance, their magnitude has the same values. Therefore, the value of the drag force can be measured by the weight sensor.
Velocity measurement: The pitot tube is utilized for measuring the dynamic pressure surrounding the spoiler as in Figure 6. Then, the velocity can be inferred by the following equation:
Figure 5:Illustration of drag force measurement via the experimental setup.

Figure 6: Pitot tube used in the measurement.


In this experiment, the dynamic pressure from eight different locations has measured under a different angle of attacks as shown in Figure 7. Since the Pitot tube assumes velocity at Hole 2 is 0, Hole 1 should be closed to the measurement point when measuring the dynamic pressure on a certain location, instead of Hole 2.
Figure 7:Locations for the eight measurement points and their numbers.

Water tunnel experiment
The model car put into the water tunnel as seen in Figure 8. Then observe the flow visualization and velocity profile by PIV technique. However, the density and viscosity of air and water are different. Subsequently, by doing Reynold number matching to calculate what velocity of flowing water will provide the same effect as the car running in the air at a certain velocity. For Reynold number matching, use equation (2) to calculate the Reynold number of the model car in the wind tunnel.
Figure 8: The experimental setup of the water tunnel.

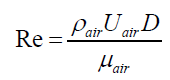
where ρair is the density of air, Uair is the velocity in the wind tunnel, D is the hydraulic diameter, and μair is the dynamic viscosity of air. By getting the ρair, ρwater, Uair, Uwater, μair, and μwater, the velocity in the water tunnel could be calculated.
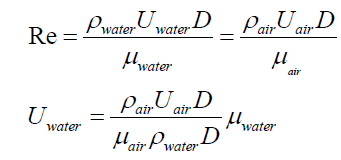
Then, the velocity in the water tunnel has to be at 0.3 m/s.
Experimental Results
Experimental results are divided into wind tunnel experiment, water tunnel experiment, and a comparison between them as following:
Wind tunnel experiment
Downforce measurement: The value of downforce corresponding to the different angles of attack is shown in Figure 9. The results are measured with a standard deviation of 0.92. The direction of the lift force is reverse to the direction of the downforce. The negative sign for 0° of attaching represents the force facing upward, which is the lift force, and the positive sign represents the force facing downward, which is the downforce. Solely 0° angle of attack gets the lift force, all other angles of attack get downforce. Downforce can enhance the stability of high-speed car while it is running, so finding the spoiler design with the maximum value of downforce is the main purpose in this measurement. From the experimental outcomes, 0° angle of attack is less than the ideal angle, because it cannot produce downforce but the lift force. In addition, when the angle of attack increases from 5° to 12°, the value of downforce increases as well. Yet, when the angle of attack changes from 12° to 15°, the value of downforce decreases as the angle of attack increases. The maximum value occurs when the angle of attack equals to 12°. The downforce measurement of this experiment is similar to the one conducted by Abdulwahab [2], which also obtained the result that the maximum value of downforce would occur within a certain range of angles of attack. In addition to having a good agreement Tarulescu et al. [12] study as well. Downforce dramatically increases as the angle of attack reaches to 12° and decreases drastically when the angle of attack exceeds 12°. Compared to the 5° angle of attack, 12° has a 233% higher downforce value. As a result, the spoiler with a 12° angle of attack can provide most downforce and indeed improves the stability of high-speed sports car in this study.
Figure 9: The relation between the angle of attack and downforce.

Drag force measurement: The value of drag force versus different angle of attack is shown in Figure 10. As the angle of attack equal to 14°, the drag force reaches the maximum value with 2.26 gw. Nevertheless, the standard deviation is only 0.18, which is relatively small when it is compared to downforce measurement. From this result, it can be inferred that the drag force would not change so obviously as downforce would. For instance, compared to the angle of attack of 5°, 12° has a 233% higher value of downforce, but it only has a 15% high value of drag force.
Figure 10: The relation between the angle of attack and drag force.

Velocity measurement: Table 1 shows the raw data of dynamic pressure (P2-P1) on different locations measured by the Pitot tube. After substituting P2-P1 into equation (1), the velocity on different locations can be derived. The velocity data is shown in Table 2. In addition, based on the momentum equation (4), the location, on which velocity is higher, has lower static pressure. Thus, if the velocity below the lower surface of the spoiler is higher than the one above the upper surface of the spoiler, the static pressure above the upper surface of the spoiler would be higher than the one below the lower surface of the spoiler. In this way, the downforce would be formed. Furthermore, if the lower velocity minus the upper velocity obtains a higher value, the value of the downforce would also be higher.
P1 + ρ1 U12 = P2 + ρ2U12
Table 1: Dynamic pressure measured by a Pitot tube in different locations.

Table 2: The relation between the angle of attack and downforce.

The velocity difference on different locations of the spoiler has been charted in Figure 11. The angle of attack tested in this experiment includes 0°, 5°, 10°, 12°, and 15°. The Reynolds number in the wind tunnel is 21367.
Figure 11: Velocity difference in different locations of the spoiler.

Water tunnel experiment
PIV: Different angles of attack (0°, 5°, 10°, 12°, and 15°) have been tested as shown in Figure 12. It found the velocity magnitude on the top of the spoiler is higher than the bottom of it. According to Bernoulli’s principle, the region with the higher velocity means it has lower pressure. This means there is no downforce but lift force on the spoiler. While increasing the angle of attack from 0° to 15°, the velocity magnitude on the top of the spoiler was still higher than the velocity on the bottom of the spoiler except at 12°. Moreover, whit increasing the angle of attack, the velocity magnitude on the bottom of the spoiler increased with same the same trend. However, the velocity magnitude on the top and bottom is the same as shown in Figure 12 (d) and Table 3. It shows that there is no lift force on the spoiler and 12° is the optimal angle of attack which matched with wind tunnel experimental results.
Figure 12: Velocity magnitude in different angle of attack, (a) 0° (b) 5° (c) 10° (d) 12° (e) 15°

Table 3: The relation between the angle of attack and downforce.

Figure 12. Velocity magnitude in different angle of attack, (a) 0° (b) 5° (c) 10° (d) 12° (e) 15°. In the water tunnel, the drag force can’t be measured, so this research identified the magnitude of vorticity behind the spoiler. A spoiler model cross-section is shown in Figure 13. If the magnitude of vorticity behind the spoiler is bigger means it has a bigger drag as well. When the angle of attack increases, the magnitude of vorticity would not increase obviously which means the drag does not increase obviously as shown in Figure 14 and Table 4. This result agrees with the wind tunnel with almost the same values and the Reynold number in the water tunnel was 18824.
Figure 13: The spoiler model cross-section.

Figure 14:Vorticity magnitude, (a) 0° (b) 5° (c) 10° (d) 12° (e) 15°.

Table 4: The velocity magnitude along the dashed line (in the middle of the spoiler).

Flow field visualization: Flow visualization at different angles of attack is shown in Figure 15 via injection a dye with the way of the flow field.
Wind tunnel versus water tunnel comparison: A comprehensive comparison between wind tunnel and water tunnel experiments for different angles of attack is illustrated in Table 5.
Figure 15:Flow field visualization, (a) 0° (b) 5° (c) 10° (d) 12° (e) 15°.

Table 5: Wind tunnel versus water results comparison.

Conclusion
According to the experimental results obtained by wind tunnel
test and water tunnel test respectively, 12° is the optimal angle of
attack for the spoiler designed in this research. In the wind tunnel
experiment, as the angle of attack equal to12°, the downforce
increases prominently. Yet, its drag force just increased slightly.
Compared to the angle of attack at 5°, the drag force of angle of attack
equal to12° increases 233%, but the drag force only increases by
15%. It meets the favorable design of the spoiler, which functionally
enhances the downforce of the sports car without inducing too
much drag force. As for the velocity difference (velocity on lower
surface-velocity on the upper surface), the magnitude obtained
from wind tunnel test are mostly positive, means the downforce can
be formed. Thus, the magnitude from PIV data is mostly negative,
which means the force is facing upward i.e. lift force. Nevertheless,
when the angle of attack is equal to 12°, the lift force can be
fortunately offset.
In essence, through various experimental methods used in this
research, spoiler with the angle of attack of 12° is undoubtedly able
to create the downforce or offset the lift force of a running sports
car without gaining too much drag.
Acknowledgements
The authors would like to thank for the financial support from National Tsing Hua University of Taiwan.
Conflict of Interest
The authors declare that they have no conflict of interest.
References
- Cakir M (2012) “CFD study on aerodynamic effects of a rear wing/spoiler on a passenger vehicle,”. Mechanical Engineering Masters Theses, Paper 1, Santa Clara University, USA.
- Katz J (2006) Aerodynamics of Race Cars. Annual Reviews on Fluid Mechanics 38: 27-63.
- Abdulwahab SF (2015) “Aerodynamic Evaluation of Racing”. MSc Project Report, School of Engineering and Technology, University of Hertfordshire, UK.
- Yakkundi V, Mantha SS (2018) “Effect of Spoilers on aerodynamic properties of a car”. International Journal of Scientific Research and Review 7(3): 271-280.
- Mashud M, Das RC (2017) “Effect of Rear End Spoiler Angle of a Sedan Car”. AIP Conference Proceedings 1851: 1.
- Leduc G (2009) “Longer and Heavier Vehicles: An overview of technical aspects”. JRC Scientific and Technical Reports, European Commission.
- Diamond S (2004) “Heavy Vehicle Systems optimization”. Annual Progress Report for Heavy Vehicle Systems Optimization, Washington, DC, USA.
- Inam MI, Mashud M (2017) “Numerical Investigation of the Fluid Flow Characteristics on the Surface of an Airfoil with Different Angles of Vortex Generator’s”. International Journal of Engineering Research and Applications (IJERA) 6(8): 338-344.
- Mashud M, Ferdous M, Omee SH (2012) “Effect of Spoiler Position on Aerodynamic Characteristics of An Airfoil”. International Journal of Mechanical & Mechatronics Engineering IJMME-IJENS 12: 6.
- Jiyan P, Kandarp K, Tushar P, Jay P (2017) “Fluid Dynamics Simulation of a Car Spoiler”. Chandubhai S Patel Institute of Technolgy, India.
- Hamut HS, El-Emam RS, Aydin M, Dincer I (2014) “Effects of rear spoilers on ground vehicle aerodynamic drag”. International Journal of Numerical Methods for Heat & Fluid Flow 24(3): 627-642.
- Tarulescu R, Tarulescu S, Leahu C (2017) “Downforce variation dependence of angle of incidence modification for the rear wing of high-speed vehicles”. IOP Conf Ser Mater Sci Eng 252(1): 012025.
- Sharma RB, Bansal R (2014) “Aerodynamic Drag Reduction of a Passenger Car Using Spoiler with VGs”. International Journal of Engineering Research and Applications (IJERA) 256-263.
- Deressa KK, Sureddy KK (2016) “Design and Analysis of a New Rear Spoiler for Su Vehicle Mahindra Bolero Using Cfd.” International Research Journal of Engineering and Technology (IRJET) 3(06): 914-924.


-

Mark E Smith
Bio chemistry
University of Texas Medical Branch, USA -

Lawrence A Presley
Department of Criminal Justice
Liberty University, USA -

Thomas W Miller
Department of Psychiatry
University of Kentucky, USA -

Gjumrakch Aliev
Department of Medicine
Gally International Biomedical Research & Consulting LLC, USA -

Christopher Bryant
Department of Urbanisation and Agricultural
Montreal university, USA -

Robert William Frare
Oral & Maxillofacial Pathology
New York University, USA -

Rudolph Modesto Navari
Gastroenterology and Hepatology
University of Alabama, UK -

Andrew Hague
Department of Medicine
Universities of Bradford, UK -

George Gregory Buttigieg
Maltese College of Obstetrics and Gynaecology, Europe -

Chen-Hsiung Yeh
Oncology
Circulogene Theranostics, England -
.png)
Emilio Bucio-Carrillo
Radiation Chemistry
National University of Mexico, USA -
.jpg)
Casey J Grenier
Analytical Chemistry
Wentworth Institute of Technology, USA -

Hany Atalah
Minimally Invasive Surgery
Mercer University school of Medicine, USA -

Abu-Hussein Muhamad
Pediatric Dentistry
University of Athens , Greece
