Lupine Publishers Group
Lupine Publishers
Menu
ISSN: 2641-6921
Research Article(ISSN: 2641-6921) 
Mathematical Model to Monitor Application Of Silica Fumes, Iron Slag And Rice Husk Ash on Compressive Strength For Partial Replacement of Cement Volume 3 - Issue 4
Eluozo SN* and Ebirim S
- Department of Civil Engineering, College of Engineering, Gregory University Uturu Abia State, Nigeria
Received: December 30, 2020; Published: January 21, 2021
*Corresponding author: Eluozo SN, 1Department of Civil Engineering, College of Engineering, Gregory University Uturu Abia State, Nigeria
DOI: 10.32474/MAMS.2021.03.000168
Abstract
The study has expressed the rate on strength development of concrete as it partially replaced cement with silica fumes, iron slag and Rice husk Ash. Modeling and simulation were adopted to monitor the growth rate of compressive strength, the predictive values that was generated experienced gradual growth rate with slight curve to the optimum level recorded at 28 days of curing. The study monitor the system by improving on the previous work done by other experts, such improvement were carried out by predicting the compressive strength of concrete that partially replaced cement with silica fumes iron slag and Rice husk Ash at the 14 days of curing, while other existing work was carried out on experimental procedure that monitored the compressive within 7 and 28days, there is no literature that has applied this mathematical techniques to monitor the compressive strength analytically, the developed compressive strength generated predictive values that was in agreement with Chaudhary et al. [1] for 7 and 28 days, this generated compressive strength was a model concrete that partially replaced cement with silica fumes, Iron Slag and Rice husk Ash, the predictive model observed silica fumes to attained the optimum compressive strength, followed with iron slag and Rice Husk Ash that experienced the lowest compressive strength, the growth rate of these materials shows that these additives have the highest siliceous content and pozzolanic properties, these study also monitor the system based on the dosage which shows that 5 and 10% experienced the required percentage that developed silica fume as the highest compressive strength. While Iron Slag maintained stable strength above Rice husk Ash which experienced the lowest compressive strength, other concrete properties was monitored to determined there variations influence on the development rates of the concrete model, the model reflected the compressive growth rate on variation of concrete porosities, these were examined from the variation established in the simulation, there rates of influenced monitored were determined in the system, the study is imperative because the behaviour of the model concrete that partially replaced cement in different admixtures has been predicted, there various pressure from other parameters in concrete properties has been examined. Experts will fine these tools as another conceptual technique in developing different concrete model with partial replacement of silica fumes, Iron Slag and Rice husk Ash to attain any designed concrete model.
Keywords: Mathematical model; silica fumes; iron slag; rice husk; ash compressive cement
Introduction
Numerous studies have carried out to observe the application some localized materials such as iron slag waste tyre and Rice husk Ash as partial replacement of cement. other materials are fine and coarse aggregates in strength development, these concept are available in the literature [2-9] the concept has definitely generated high percentage result, the application of waste tyre has demonstrated tremendous feasibility applying gargantuan amounts from waste tyre in concrete products. Other materials are the use of plastic waste, these are one of the most familiar environmental issues that is contemporary around the globe Choi et al. [10] most current studies carried out has examined the effect of waste PET bottles aggregate on properties of concrete. The yield of these studies explained how this concept of applying waste tyre and bottles can be reducing by 2 – 6% of normal weight concrete. Marzouk et al. [11] carried out research studied on the applications of consumed plastic bottle waste material as sand replacement; it was observed from the study monitored that density was lowered when the PET aggregate exceeding 50% by volume of sand. Suganthy et al. [12] investigated the declined in weight of concrete just as plastic content experienced an increase Ode and Eluozo [13]. Marzouk [11] more so studies were carried out to monitor the reduction of compressive strength from plastic concrete; this concept was the application of sand replaced with plastic. Al-Manasser and Dalal other investigation was carried out by studying the influence of plastic on concrete mix. It was observed that the splitting tensile strength experienced decreased as the plastic content increased. Batayneh et al. [14] express splitting tensile strength and the flexural strength of concrete mix slump on the replacement and observed that the plastic content went up. Several experts have investigated the strengths of plastic concrete Batayneh et al. [14] mentioned that the incorporation of ground plastic in concrete had effect on its compressive strength [15,16] investigated the effect of post-consumer waste plastic in concrete as a soft filer [17-19].
Theoretical Background
Materials and Method
Experimental Procedures
Compressive Strength Test Concrete cubes of size 150mm×150mm×150mm were cast with and without copper slag. During casting, the cubes were mechanically vibrated using a table vibrator. After 24 hours, the specimens were demoulded and subjected to curing for 1-90 days and seven-day interval to 28 days in portable water. After curing, the specimens were tested for compressive strength using compression testing machine of 2000KN capacity. The maximum load at failure was taken. The average compressive strength of concrete and mortar specimens was calculated by using the following equation 5.1.
Compressive strength (N/mm2) = Ultimate compressive load (N)
Area of cross section of specimen (mm2)
Results and Discussion
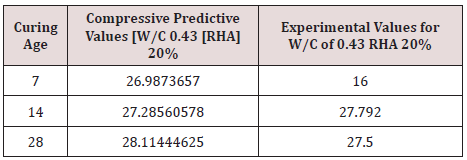
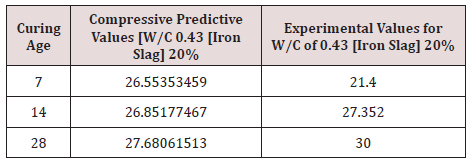
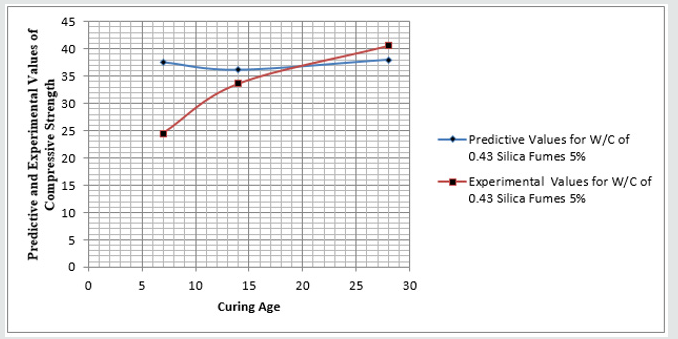
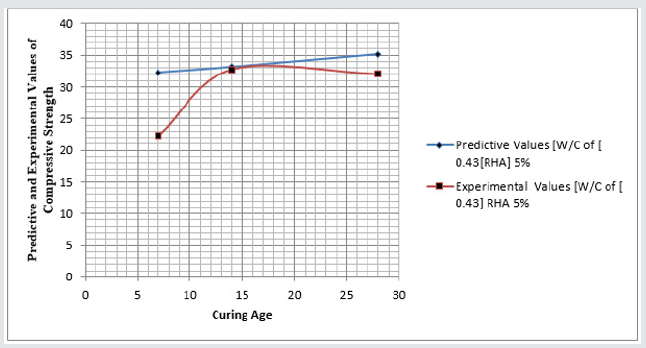
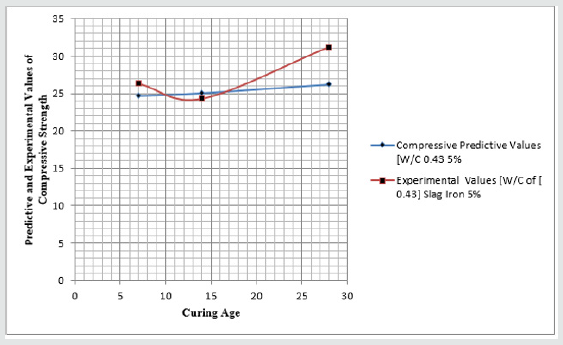
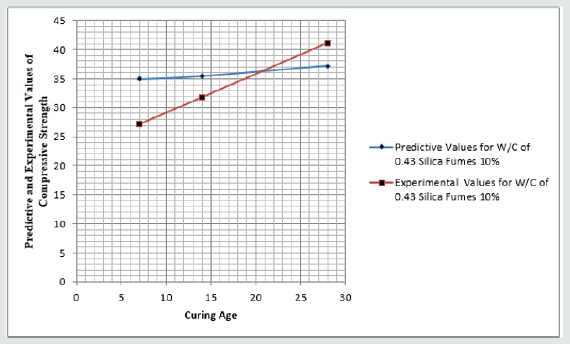
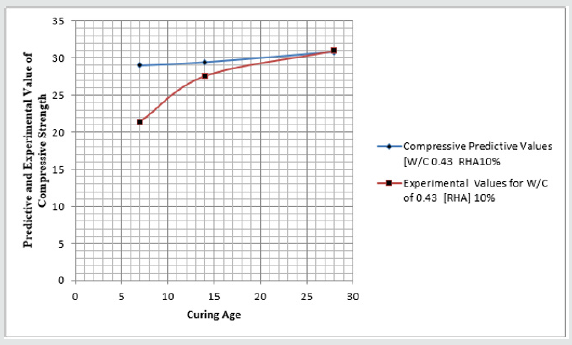
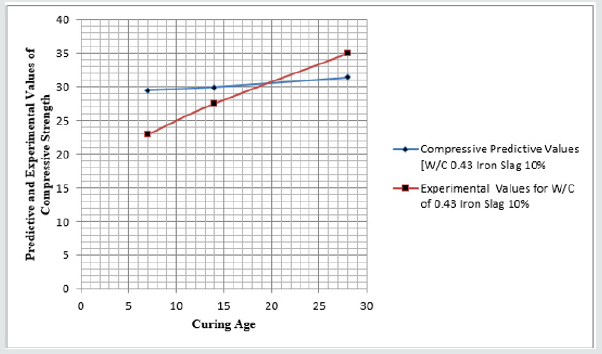
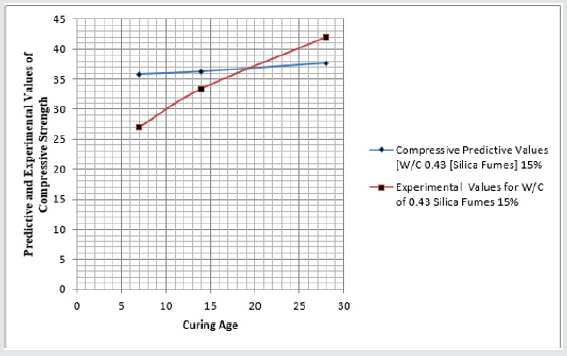
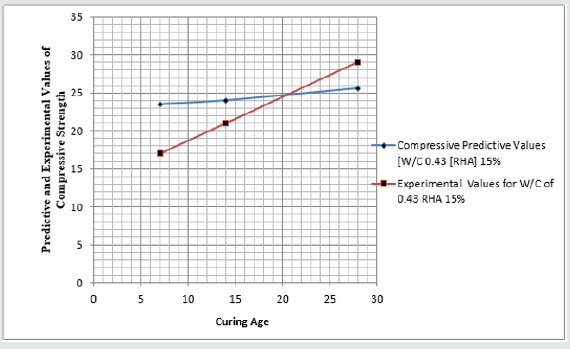
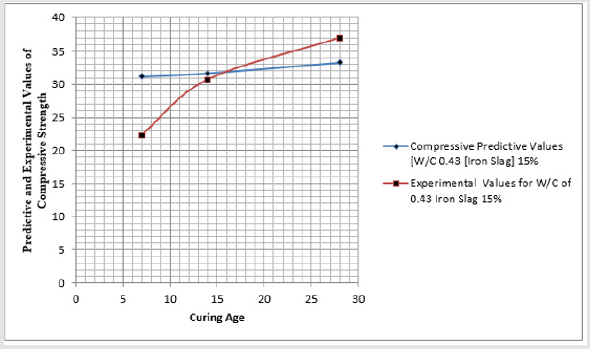
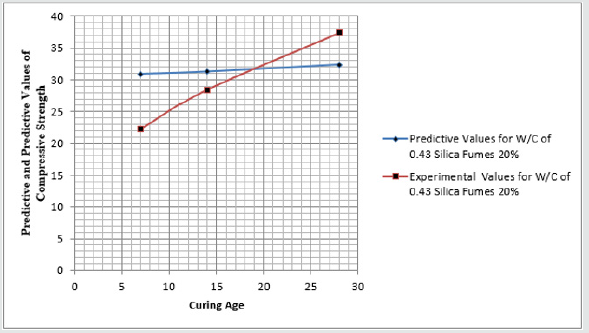
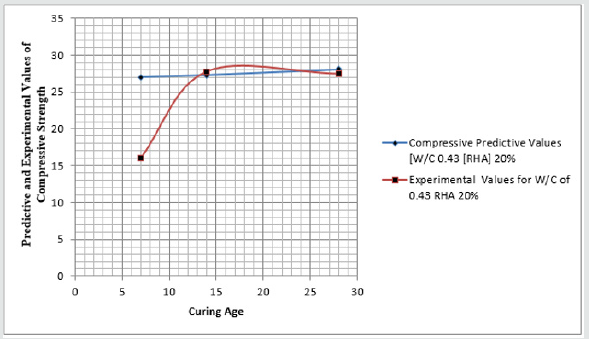
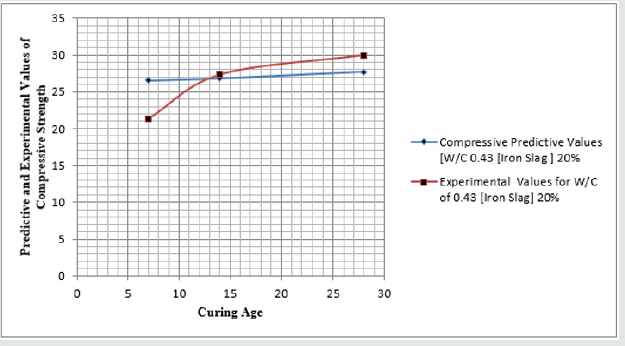
The study expressed the behaviour of the model concrete from figure one to twelve based on the mixed design approach for the study, the trend in most of the figures displayed slight curve were gradual increase were observed to the optimum values recorded at twenty eight days of curing, while some figures displayed linear increase in gradual process to the optimum level, slight fluctuation was also experienced in a figures, while predominant figures observed linear growth rate, the predictive model thoroughly developed this variation, similar condition were observed on the experimental values, this were applied to validated the model, but displayed predominant linear growth rate, the study explained the level of concrete mixed designed proportion in various figures, the study developed model that was applied by Silica fume, Rice Husk Ash and Iron Slag, the experimental values were he applied at different admixtures to develop compressive strength of concrete, the study monitored the developed of concrete that partially replaced cement with these materials, the study predict at various modifiers such as Silica fume, Rice Husk Ash and Iron Slag used Chaudhary et al. [20] experimental values, the experimental values between 7 and 28 days were in agreement with predictive parameters, these validated the simulation parameters, the dosage percentage for Silica fume, Rice Husk Ash and Iron Slag was between 5%-20% , the predictive simulation values at different admixture observed that observed the highest compressive was generated from silica fumes flowed by iron slag, while Rice husk ash developed the lowest compressive strength, these was much lower than the compressive strength without replacement of cement by Chaudhary et al. [20] , the study monitored the compressive strength from various admixtures by replacing cement with these addictives, at different dosage and curing age. More so, the simulation was able to monitor the effect from other concrete characteristic that developed mechanical properties, this simulation generated variations influence from these parameters, it was observed that the system was affected by these variables and it was reflected on the growth rate of the compressive from different curing age Tables 1-12 (Figures 1-12).
Conclusion
The study has modified a model concrete that is applied at different admixtures with variations of dosage and curing age. the study expressed the growth rate of compressive strength at constant water cement ratio, but with variation of these admixtures within 7 and 28 days of curing, while the dosage was within 5 to 20%, the concept adopted was developed modeling techniques, the study express the behaviour of the model concrete by simulating the derived model to generated the predictive values, these were applicable to other addictives, the behaviour of the materials express various growth rate based on different factors, this concept were observed to monitor other concrete characteristics that could affect the concrete model, this application adopted were validated with experimental values generated by Chaudhary et al. [20]. The study improved on the model concrete whereby 14days of curing was integrated, this application was integrated in the system, the predictive values simulated for 14days and observation from the growth rate at 14 days were experienced, the variation influenced from 14 days of curing were observed before the reflection growth rate of 28 days of curing, the study expressed the correlation between 7,14, and 28days, this development expressed the behaviour of the model concrete in different dimensions, these strength development from predictive and experimental values was based on the fact that it serve as fillers within the void of concrete, these are through the particles of the admixtures to generated high strength base on the concrete grades. The lowest values from the predictive and experimental values were that of RHA, that obtained the lowest even at 5%, but lower than concrete compressive developed without admixtures, this can be used in local areas for low-cost housing.
References
- Chaudhary AS, Khan N, Kumar VP (2018) Analysis of Concrete Containing Different Admixtures as Partial Replacement of Cement Journal of Engineering Research and Application 7(7): 31-38.
- Topcu IB (1995) The Properties of Rubberized Concrete. Cement and Concrete Research 25(2): 304-310.
- Toutanji HA (1996) The Use of Rubber Tyre Particles in Concrete to Replace Mineral Aggregate. Cement and Concrete Composites 18(2): 135-139.
- Khatib ZR, Bayomy FM (1999) Rubberized Portland Cement Concrete. ASCE Journal of Materials in Civil Engineering 11(3): 206-213.
- Ling TC (2011) Prediction of Density and Compressive Strength for Rubberized Concrete Block, Construction and Building Materials 25(11): 4303-4306.
- Ohemeng EA, Yalley PPK (2013) Models for Predicting the Density and Compressive Strength of Rubberized Concrete Pavement Blocks. Construction and Building Materials 47: 656-661.
- Eric AO, Peter PY, John D, Susan Dzifa D (2014) Utilization of Waste Low Density Polyethylene in High Strengths Concrete Pavement Blocks Production Civil and Environmental Research IISTE 6(5).
- Ode T (2004) Structural properties of Concrete made with locally occurring 3/8 gravel. M TECH. Thesis Rivers State University of Science and Technology.
- Ode T, Eluozo SN (2016) Predictive Model on Compressive Strength of Concrete Made with Locally 3/8 Gravel from Different Water Cement Ratios and Curing Age. International Journal of Scientific and Engineering Research 7(1): 1528-1551.
- Choi YW, Moon DJ, Chung JS & Cho SK (2005) Effects of Waste PET Bottles Aggregate on Properties of Concrete. Cement and Concrete Research 35(4): 776-781.
- Marzouk OY, Dheilly RM, Queneudec M (2007) Volarisation of Post-Consumer Waste in Cementitious Concrete Composites. Waste Management 27(5): 310-318.
- Suganthy P, Chandrasekar D, Kumar SPK (2013) Utilization of Pulverized Plastic in Cement Concrete as Fine Aggregate. International Journal of Research in Engineering and Technology 2(6): 1015-1019.
- Ode T, Eluozo SN (2016) Model Prediction to Monitor the Rate of Water Absorption of Concrete Pressured by Variation of Time and Water Cement Ratios. International Journal of Scientific and Engineering Research 7(1): 1514-1527.
- Batayneh M, Marie I, Asi I (2007) Use of Selected Waste Materials in Concrete Mixes. Waste Management 27(12): 1870-1876.
- Ode T, Eluozo SN (2016) Calibrating the Density of Concrete from Washed and Unwashed Locally 3/8 Gravel Material at Various Curing Age. International Journal of Scientific and Engineering Research 7(1): 1514-15574.
- Ode T, Eluozo SN (2016) Compressive Strength Calibration of Washed and Unwashed Locally Occurring 3/8 Gravel from Various Water Cement Ratios and Curing Age. International Journal Engineering and General Science 4(1): 462-483.
- Ode T, Eluozo SN (2016) Predictive Model to Monitor Variation of Concrete Density Influenced by Various Grade from Locally 3/8 Gravel at Different Curing Time. International Journal Engineering and General Science 4(1): 502-522.
- Ode T, Eluozo SN (2016) Predictive Model to Monitor Vitiation of Stress –Strain Relationship of 3/8 Gravel Concrete with Water Cement Ration [0.45] at Different Load. International Journal Engineering and General Science 4(1): 409-418.
- Ode T, Eluozo SN (2015) Predictive Model to Monitor the Variation of Concrete Density Influenced by various Grades from Locally 3/8 gravel at different curing time 4(1): 502-522.
- Naik TR, Singh SS, Huber CO, Brodersen BS (1996) Use of Post-Consumer Waste Plastics in Cement-Based Composites. Cement and Concrete Research 26(10): 1489-1492.

Top Editors
-

Mark E Smith
Bio chemistry
University of Texas Medical Branch, USA -

Lawrence A Presley
Department of Criminal Justice
Liberty University, USA -

Thomas W Miller
Department of Psychiatry
University of Kentucky, USA -

Gjumrakch Aliev
Department of Medicine
Gally International Biomedical Research & Consulting LLC, USA -

Christopher Bryant
Department of Urbanisation and Agricultural
Montreal university, USA -

Robert William Frare
Oral & Maxillofacial Pathology
New York University, USA -

Rudolph Modesto Navari
Gastroenterology and Hepatology
University of Alabama, UK -

Andrew Hague
Department of Medicine
Universities of Bradford, UK -

George Gregory Buttigieg
Maltese College of Obstetrics and Gynaecology, Europe -

Chen-Hsiung Yeh
Oncology
Circulogene Theranostics, England -
.png)
Emilio Bucio-Carrillo
Radiation Chemistry
National University of Mexico, USA -
.jpg)
Casey J Grenier
Analytical Chemistry
Wentworth Institute of Technology, USA -
Hany Atalah
Minimally Invasive Surgery
Mercer University school of Medicine, USA -

Abu-Hussein Muhamad
Pediatric Dentistry
University of Athens , Greece

The annual scholar awards from Lupine Publishers honor a selected number Read More...


