
Lupine Publishers Group
Lupine Publishers
Menu
ISSN: 2641-6921
Research Article(ISSN: 2641-6921) 
Effect of Laser Welding Parameters on Porosity of Welds in Cast Magnesium Alloy AM50 Volume 1 - Issue 2
Karl Fahlström1*, Jon Blackburn2, Leif Karlsson3 and Lars-Erik Svensson3
- 1Swerea KIMAB, Kista, University West, Sweden
- 2The Welding Institute, Great Britain
- 3University West, Sweden
Received: December 03, 2018; Published: December 14, 2018
*Corresponding author: Karl Fahlström, Swerea KIMAB, Isafjordsgatan 28A, 164 40 Kista, Sweden
DOI: 10.32474/MAMS.2018.01.000106
Abstract
Pores in the weld metal lower the mechanical properties of the weld. It is therefore important to understand the pore formation mechanisms and find procedures that could reduce porosity. This study focused on laser welding of 3 mm thick magnesium alloy AM50, investigating how different parameters affect porosity formation. Low levels of porosity content were achieved by either increasing the welding speed or using a two-pass welding approach. It was found that higher welding speeds did not allow pores, which were pre-existing from the die-casting process, to have sufficient time to coalesce and expand. In the two-pass welding technique, pores were removed as a result of a degassing process which occurred through the second pass.
Keywords: Laser welding; Magnesium, Cast; Metallurgy; Porosity; Automotive; AM50
Introduction
Magnesium alloys are light-weight metals suitable for applications in several industries, such as automotive and aerospace. Compared with most materials they provide a possibility to reduce weight due to their high specific strength. However, their tensile strength is low (190-310MPa) compared with steels, which may limit their application; for example, to car interior parts such as seat frames, steering wheels or structural dashboard cross beams [1-4]. A common magnesium alloy is AM50 (4.4-5.5 wt% Al, 0.26-0.6 wt% Mn) which, compared with other magnesium alloys, is of relatively high strength, high hardness, high elongation and has excellent castability. Often magnesium alloys are cast into complex shapes using high pressure die-casting [5-8]. An alternative is to cast less complicated parts and join them by welding, commonly by tungsten inert gas (TIG) or metal inert gas (MIG) welding [2]. An alternative is laser welding, where high power densities are attained with small welding spots, allowing relatively high welding speed and low heat inputs to be achieved. Low heat input is an advantage for many metallic materials as a narrow fusion zone and HAZ will form, reducing negative effects on material properties [2]. Laser welding of magnesium alloys was reviewed by [9], who stated that crack-free laser welds with low porosity and good surface quality could be obtained when using appropriate welding parameters. Nevertheless, magnesium alloys may exhibit many processing problems and weld discontinuities, such as an unstable weld pool, spatter, drop-through, sagging, undercut, porosity, cracking, and oxide inclusions. Pores in the weld metal lower especially the tensile strength and may have a deleterious effect on fatigue performance if surface breaking. Therefore, it is important to understand the pore formation mechanisms and find procedures that could be used to reduce pore formation [2,10]. Porosity in welded magnesium alloys has been the subject of a number of previous investigations [2,10-15]. In these studies, a range of different factors have been found to cause pore formation including: hydrogen, an unstable keyhole, pre-existing pores from the die-cast process, surface condition, gas entrapment, and alloying elements with a low vaporization temperature. In studies by [15] and [11] porosity in laser welded AM60B (Mg-alloy with 5.5-6.5 wt.% Al and 0.24-0.6 wt.% Mn) was investigated. Pre-existing pores in the base metal coalesced and expanded in the weld metal during welding resulting in large diameter pores [16] presented three solutions to avoid porosity; specifically, removing the oxide layer with a separate plasma arc before welding, use of dual laser beam welding or using a two-pass laser welding procedure. The best results were obtained using a two-pass welding, with a pre-heating configuration for the first laser pass. However, a systematic study of how different parameters affect the amount of porosity in laser welded AM50 has not been previously performed. This study was therefore initiated to investigate how different parameters affect porosity formation in laser welded AM50, with the overall aim to ensure that high quality welds can be produced reliably and reproducibly. Investigations were undertaken on 3mm thickness AM50, since this is of common interest to many potential applications.
Experimental
Material
Die-cast magnesium alloy AM50 sheets of dimensions 3(T) x100(L)x170(W) mm were welded. The composition according to ISO 16220(00) and the composition measured with glow-discharge optical emission spectroscopy are presented in Table 1.
Welding
Figure 1: Schematic image of the laser welding setup. A trailing gas shielding was used on the top side with a ‘panpipe’ design, and root gas was applied through a 10mm wide efflux channel in the fixture along the weld line.
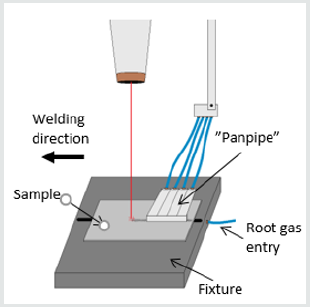
Welding was performed with an IPG 10kW fiber laser with a delivery fiber of 200μm core diameter. A 120mm focal length collimator lens and a 400mm focal length focusing lens were used, giving a nominal beam width of 0.66mm diameter the optics were aligned perpendicular to the sheet with the beam width on the top surface of the workpiece. Bead-on-plate welds, 100mm in length, were produced. Argon gas with a purity >99.99% (gas type I1 to ISO 14175:2008) was used as shielding gas at the top and root sides, with flow rates of 40 l/min and 5 l/min, respectively. On the top side a trailing gas shielding was used with a ‘panpipe’ design. The root gas was applied through a 10mm wide efflux channel in the fixture along the weld line Figure 1. Laser welding parameters and surface conditions were varied to study their influence on porosity formation. The welding parameters varied were power, welding speed and focus position (the laser beams minimum diameter with respect to the top surface of the workpiece). The surface condition was varied through different cleaning procedures, specifically wire brushing (Br), acetone degreasing (A) and grit blasting (Bl). In addition, single or two-pass welding was used Table 2. For the twopass welding, both passes were resulting in full penetration welds i.e. not a pre-heating setup.
Table 2: Parameters and cleaning procedure. Specimens W07 and W08 were welded with two passes. For W07, loose welding soot was removed with a soft brush between the passes.
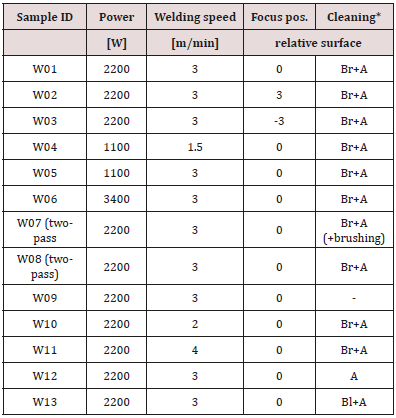
*Br=Wire brushing, A=Acetone, Bl=Grit blasting
Evaluation
Metallographic cross-sections, both transverse and longitudinal to the welding direction were prepared to study the resulting microstructure and porosity of the welds. The longitudinal sections were cut from the centre of the weld with a length of 20mm. All sections were grinded with 4000 grit paper, and polished with either a 6 or 1μm diamond suspension slurry for the LOM (Light Optical Microscopy) evaluation or and the SEM (Scanning Electron Microscopy) evaluation respectively. When performing LOM, an external ring-shaped light source (directed from the sides onto the sample) was used to provide additional illumination and increase visibility of the pores. This yielded a high contrast image suitable for image analysis using ‘Image J’, an open source Java-based image processing software [17]. A JEOL JSM-7001F field emission SEM equipped with a back-scatter detector and an Oxford Instruments EDS (Energy Dispersive Spectrometry) detector was used for microstructure studies and phase analysis.
Result
Microstructure
EDS analysis showed that the matrix of the as-received AM50 sheet material contained a Mg-Al phase (corresponding to β-Mg17Al12 according to literature [18]), particles of Al- Mn (typically Al8Mn5 [18]) and as Mg-Al oxides Figure 2. Also, occasional cavities were found in the base material. These are most likely shrinkage pores from the high-pressure die-casting process.
Figure 2: Cross section images of AM50 weld obtained using the back scattered detector in SEM showing (a) base material and (b) fusion zone. White areas are a Mg-Al and Al-Mn phases. Black areas are shrinkage pores from die-casting (1), Mg-Al oxides (2) or pores from welding (3).

Porosity
Figure 3: LOM micrograph of a longitudinal section of W01, obtained using an external ring shaped light source.

Table 3: Transverse and longitudinal cross-sections porosity content, including number of pores in the section as well as area fraction.

*Br=Wire brushing, A=Acetone, Bl=Grit blasting
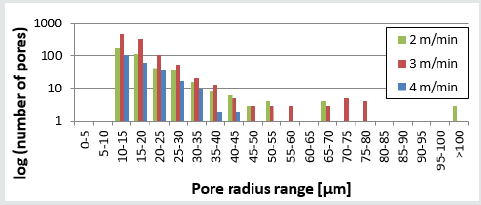
The porosity analysis was typically performed using images taken of the cross-section’s transverse to the welding direction. Longitudinal section images Figure 3 were also analyzed to verify that the transverse cross-sectional images were representative of the full length of the weld. Table 3 details the number of pores, including the percentage of the fusion zone cross-sectional area covered by pores (hereafter ‘area fraction pores’). The porosity counts in the transverse cross-sections show a good correlation with the porosity counts in the longitudinal cross-sections, suggesting that cross-sectional porosity is representative and can be used for evaluation. The size distribution of pores was analyzed for samples welded at three different welding speeds; specifically, 2m/min (W10), 3m/min (W01) and 4m/min (W11). Most pores had a radius in the range 10-40μm, independent of welding speed. However, for the lowest welding speed (2m/min) some pores exceeded 100μm in radius (Figure 4).
Figure 4: Graph showing the size distibution of pores for three welding speeds: 2 m/min (W10) 3 m/min (W01) and 4 m/min (W11). Most pores were in the size of 10-40 μm. Welding speed 2 m/min has some large pores in the size of >100 μm in radius.
Effect of Welding Parameters on Porosity
Surface condition
Figure 5: LOM images showing porosity content for different surface conditions. Grit blasted and cleaned with acetone (W13), cleaned with acetone (W12), no cleaning (W09) and brushed and cleaned with acetone (W01). The yellow contour shows the fusion zone.

Several different surface cleaning procedures were evaluated, including grit blasted and cleaned with acetone (W13), cleaned with acetone (W12), no cleaning (W09) and brushed and cleaned with acetone (W01) (Table 2). The area fraction pores for grit blasted (W13) and brushed samples (W01) was ~8-10% (Figure 5), compared with 5-7% for samples either degreased with acetone or subject to no cleaning (W12 and W09); suggesting that cleaning without a mechanically abrading process is most favorable. The number of pores per mm2 was 78 for grit blasted (W13) compared with 58 for cleaning with acetone (W12), 85 for no cleaning (W09) and 147 for brushing and subsequent cleaning with acetone (W01).
Power
The laser power was varied in three steps, 1100 W (W05), 2200 W (W01) and 3400 W (W06), while keeping other parameters constant. Both the fusion zone area and the area fraction pores were nearly doubled when increasing the power from 1100 to 3400 W Figure 6. The number of pores per mm2 was 99 for a power of 1100 W (W05), compared with 147 for a power of 2200 W (W01) and 100 for a power of 3400W (W06). This could suggest that the size of the pores increased with higher power rather than the number of pores.
Figure 6: LOM images showing porosity content of welds produced using 1100W (W05), 2200W (W01) and 3400W (W06). The yellow contour shows the fusion zone. The fusion zone and area fraction pores increased with increasing power.

Welding speed
Three different welding speeds were evaluated; specifically, 2m/min (W10), 3m/min (W01) and 4m/min (W11). The other parameters were kept constant. The area fraction pores significantly reduced as the welding speed increased Figure 7. The number of pores per mm2 was 71 for a welding speed of 2m/min (W10), compared with 147 for a welding speed of 3m/min (W01) and 47 for a welding speed of 4m/min (W11). No clear correlation between the number of pores and welding speed can be seen.
Focus position
The focus position of the laser beam was varied in three steps; specifically, 3mm (-3) below the top surface of the work piece (W03), on the top surface of the work piece (0) (W01), and 3mm (+3) above the top surface of the work piece (W02). The lowest area fraction pores was achieved with a focus position on the top surface of the work piece material (0). The amount of porosity formed did not change significantly when moving the focus position into the work piece (i.e. -3), although, positioning the focus above the surface (i.e. +3) almost doubled the percentage of pores per mm2. The number of pores per mm2 was 80 for -3mm (W03), compared with 147 for 0mm (W01), and 58 for +3mm (W02).
Figure 7: LOM images showing porosity content of 2m/min (W10), 3m/min (W01) and 4m/min (W11). The yellow contour shows the fusion zone. The area fraction pores decrease with increasing welding speed.

Two-pass welding
Single-pass welding with two welding parameter combinations of nominally identical heat input (J/mm) was evaluated. Welds were produced with a welding speed of 3m/min and a laser power of 2200 W (W01), and with a welding speed of 1.5m/min but with a laser power of 1100W (W04). Both single-pass welds were brushed, and acetone degreased prior to welding. Two-pass welding was performed with two repetitions of the W01 parameters, with two different interpass cleaning procedures evaluated - brushing (W07) and no cleaning (W08). Both two-pass welds were brushed, and acetone degreased prior to welding. Both single-pass welding samples had area fraction pores of approximately of ~8-10%, whilst for the two-pass welds it was 2-4%, independent of the interpass cleaning procedure (Figure 8). The number of pores per mm2 was 147 for a single-pass weld made with a welding speed of 3m/min and a laser power of 2200 W (W01) compared with 28 pores per mm2 for a welding speed of 1.5m/min and a laser power of 1100 W (W04). These numbers suggest that the lower welding speed and lower power for W04 results in fewer, but larger pores compared to W01. For the two-pass welding process, 26 pores per mm2 were found when a brushing interpass cleaning procedure was used (W07), and 35 with no interpass cleaning (W08).
Figure 8: LOM images showing porosity content of single-pass with 3m/min and 2200W (W01), single-pass with 1.5m/min and 1100W (W04), two pass with 3m/min and 2200W using brushing between passes (W07) as well as two-pass with 3m/min and 2200W without cleaning (W08). The yellow contour shows the fusion zone. The area fraction pores clearly decreased when using two-pass welding.

Discussion
Porosity
Table 4: Cross-sectional porosity content including number of pores in the section, percentage of area in the section covered with pores and number of pores/mm2.
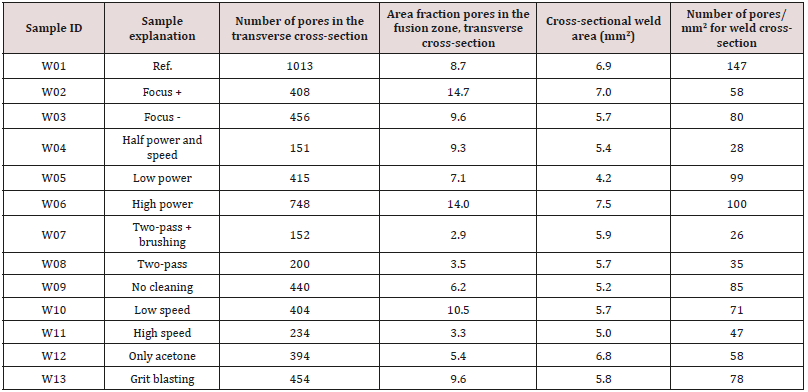
Results of porosity measurements are summarized in Table 4. There is no clear correlation between the number of pores and the area fraction pores in the cross-section. This can be understood from Figure 4 showing that the size distribution of the pores depends on, for example, the welding speed. It can be seen that welds produced with a speed of 2m/min (W10) resulted in 47 pores/mm2 and 10.5% of area fraction pores while welds produced with a speed of 3m/min (W01) resulted in 147 pores/mm2 but only 8.7% of area fraction pores. In this case, a lower welding speed resulted in a lower number of pores, but with more pores with a radius >100μm in radius. Large pores can form directly as a result of the welding process, or when several smaller pre-existing pores in the cast material coalesce. The main consequence of porosity in the weld metal is the lowered strength of the joint [2,10,11]. With respect to strength, the pore volume is the most useful measure. Therefore, in this paper the area fraction porosity in the fusion zone cross-section was used.
Effect of welding parameters
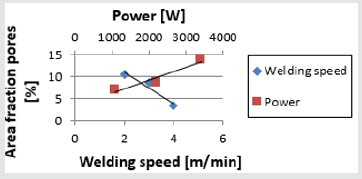
The welds that had above 10 % area fraction pores had parameters settings giving the highest heat input or most defocused laser beam (W02, W06 and W10). On the other hand, welds with the lowest area fraction pores of around 3% had parameter settings with the highest welding speed or were two-pass welds (W07, W08 and W11). The effects of the heat input, welding speed and power are illustrated in Figure 9 & 10.
Figure 9: Area fraction pores plotted against heat input illustrating that a higher heat input results in more porosity.
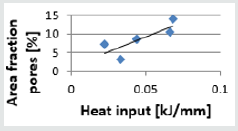
Figure 10: Area fraction pores as a function of welding speed and power. A decrease in welding speed or an increase in power resulted in increased porosity.
Pore formation
Three major reasons for porosity are detailed in existing literature: pre-existing pores from the die-casting process, pores formed by nucleation and growth of gas (most likely hydrogen) in the molten material, and porosity originating from process instabilities [9]. One explanation is that gases entrapped in preexisting shrinkage pores grow when the solid material becomes molten during welding [11,12,15]. These relatively large pores have difficulties to escape from the molten pool due to the rapid solidification in laser welding. This suggests that a higher heat input, giving a larger volume of molten material and allowing more entrapped gas to grow to larger pores, should result in a larger pore volume. It is also claimed that a higher welding speed reduces the available time to form and grow pores, resulting in fewer pores in the weld bead [15]. In line with this Zhao et al. [15] found that the porosity increased with increased heat input, i.e., increase in laser power and decrease in welding speed. This corresponds well with results from the present study. In a previous study it is described how the heat input is controlled while welding die-cast AM50 [14]. It needs to be high enough to achieve full penetration, but low enough to avoid poor weld surface quality and excessive porosity. Porosity of 5% was achieved, which is in the range of the lowest porosity content of 3% in the present study.
Surface cleaning
Unexpectedly brushing (8.7%) or grit blasting (9.6%) resulted in more porosity than no cleaning (6.2%) and cleaning only with acetone (5.4%) Table 4. This suggests that cleaning has a negative impact on porosity. Harooni et al. [2] stated that the surface oxide on magnesium alloys was one of the causes of pore formation. When welding a lap joint where the oxide layer had been mechanically removed almost no porosity was shown, while welding with asreceived surfaces produced porosity at the faying surface of the two overlapping sheets. The explanation was that the oxide layer bonds moisture forming magnesium hydroxide. As a result of heating during welding water molecules were released and trapped in the molten metal thereby forming pores. Lower porosity content when plasma arc pre-heating was explained by degassing of the oxide layer. In the present study there were no faying interfaces for the bead-on-plate samples why porosity formation cannot readily be explained by moisture being released from surface oxides. This suggests cleaning of the surface would not have a major effect. Another explanation is that the oxide layer was mixed in the molten metal creating nucleation points for porosity. However, the pores did not have time to grow, hence resulted in many small pores with low impact on the total pore volume. The absorption of the laser beam depends on the surface condition and thereby the cleaning procedure [2]. The higher porosity content in the cleaned samples could therefore possibly be due to a lower absorption of the laser beam and hence a resulting unstable welding process. An unstable keyhole could be one explanation for pore formation [9] however, this is more common when welding aluminium than magnesium due to the lower vapor pressure and higher surface tension causing the keyhole to collapse.
Two-pass welding
The lowest amount of porosity was achieved with two-pass welding with 2.9% (W07) and 3.5% (W08). The porosity decreased roughly 5% when applying the second pass. Obviously pores formed in the first pass, while the second pass had a degassing effect removing in particular the large pores. A higher heat input in a single-pass could be thought to have the same effect, however more material becomes molten and hence more porosity occur. The two-pass welding only melts a small volume but gives longer time to de-gas. Two-pass welding is however not considered production friendly due to the lower productivity (double process time). Solutions like twin-spot laser welding would therefore be of interest for further investigations.
Conclusion
a) Magnesium alloy AM50 has been laser welded bead-on-plate to study pore formation. Effects of welding parameters including laser power, welding speed, focus position, single-pass and twopass welding and surface cleaning have been studied.
b) The lowest area fraction porosity of 3 % was achieved for 4 m/min with 2200 W and for two-pass welding at 3 m/min with 2200 W. Focus position was at the surface and oxide was not removed.
c) Trends were that an increased welding speed or a decreased welding power resulted in less porosity. The focus position does not seem to influence the porosity.
d) Low porosity in single-pass welds is achieved when preexisting pores in the base metal don’t have time to coalesce and expand.
e) Low porosity in two-pass welds is due to degassing by the second pass removing in particular the large pores.
f) Mechanical cleaning of the surface increased the amount of porosity. Possible explanations are:
i. The surface oxide layer is mixed in the molten metal acting as nucleation points for porosity. This results in many small pores with low impact on the total pore volume.
ii. Removal of the oxide layer affects the absorption of the laser beam causing an unstable process resulting in porosity.
Acknowledgment
Special thanks are directed towards the people involved in this work; Frank Nolan at TWI, Kjell-Arne Persson and Jacek Komenda at Swerea KIMAB, Edwin Bergstedt at KTH, as well as the PhDresearch school SiCoMaP at University West.
References
- Kielbus A, Rzychon T, Cibis R (2006) Microstructure of AM50 die casting magnesium alloy. Journal of achievements in materials and manufacturing engineering 18(1-2).
- Harooni M, Fanrong Kong, Blair E Carlson, Radovan Kovacevic (2014) Pore formation mechanism and its mitigation in laser welding of AZ31B magnesium alloy in lap joint configuration. Materials and Design 58: 265-276.
- Zhu J, L Li, Z Liu (2005) CO2 and diode laser welding of AZ31 magnesium alloy. Applied Surface Science 247: 300-306.
- Cao X (2005) Continuous Wave ND: YAG Laser Welding of Sand Cast ZE41A-T5 Magnesium Alloys. Materials and manufacturing processes 20(6): 987-1004.
- Gertsman Y, Jian Li, Su Xu, James P Thomso, Mahi Sahoo (2005) Microstructure and second-phase particles in low- and highpressure die-cast magnesium alloy AM50. Metallurgical and Materials Transactions A 36(8): 1989-1997.
- Fredriksson H, Åkerlind U (2006) Materials Processing during Casting. John Wiley & Sons, Chichester UK.
- Ma Y, Zhang J, Yang M (2009) Research on microstructure and alloy phases of AM50 magnesium alloy. Journal of Alloys and Compounds 470(1-2): 515-521.
- Lee G (2006) Effect of process parameters on porosity distributions in high-pressure die-cast AM50 Mg-alloy. Materials Science & Engineering A 427(1): 99-111.
- Cao X, Jahazi M, Immarigeon JP, Wallace W (2006) A review of laser welding techniques for magnesium alloys. Journal of Materials Processing Technology 171: 188-204.
- Harooni M, Fanrong Kong, Blair Carlson, Radovan Kovacevic (2012) Mitigation of Pore Generation in Laser Welding of Magnesium Alloy AZ31B in Lap Joint Configuration. In ASME-International Mechanical Engineering Congress & Exposition proceedings. Houston, Texas, USA.
- Wahba M, Masami Mizutani, Yosuke Kawahito, Seiji Katayama (2012) Laser welding of die-cast AZ91D magnesium alloy. Materials and Design 33: 69-576.
- Wahba M, Katayama S (2012) Laser welding of magnesium alloy. Transactions of JWRI 41(1): 11-23.
- Liu L (2005) Pore formation during hybrid laser-tungsten inert gas arc welding of magnesium alloy AZ31B-mechanism and remedy. Materials Science and Engineering A 390: 76-80.
- Zhang J (2013) Reducing the Porosity in Die-Cast Magnesium Alloys during Laser Welding. Welding Journal 92: 101-109.
- Zhao H, Debroy T (2001) Pore formation during laser beam welding of die cast magnesium alloy AM60B - mechanism and remedy. Weld Journal 80: 204-210.
- Harooni M (2016) Welding magnesium: battle against the pores, in Laser-community - The laser magazine from trumpf, TRUMPF p. 1-6.
- Rasband W, Image J (2016) National Institutes of Health. Image processing program.
- Braszczynska Malik, Dabrowski KR, Braszczynski J (2009) Microstructure of high-pressure die-casting AM50 magnesium alloy. Archives of foundry engineering 9(2): 53-56.

Top Editors
-

Mark E Smith
Bio chemistry
University of Texas Medical Branch, USA -

Lawrence A Presley
Department of Criminal Justice
Liberty University, USA -

Thomas W Miller
Department of Psychiatry
University of Kentucky, USA -

Gjumrakch Aliev
Department of Medicine
Gally International Biomedical Research & Consulting LLC, USA -

Christopher Bryant
Department of Urbanisation and Agricultural
Montreal university, USA -

Robert William Frare
Oral & Maxillofacial Pathology
New York University, USA -

Rudolph Modesto Navari
Gastroenterology and Hepatology
University of Alabama, UK -

Andrew Hague
Department of Medicine
Universities of Bradford, UK -

George Gregory Buttigieg
Maltese College of Obstetrics and Gynaecology, Europe -

Chen-Hsiung Yeh
Oncology
Circulogene Theranostics, England -
.png)
Emilio Bucio-Carrillo
Radiation Chemistry
National University of Mexico, USA -
.jpg)
Casey J Grenier
Analytical Chemistry
Wentworth Institute of Technology, USA -
Hany Atalah
Minimally Invasive Surgery
Mercer University school of Medicine, USA -

Abu-Hussein Muhamad
Pediatric Dentistry
University of Athens , Greece

The annual scholar awards from Lupine Publishers honor a selected number Read More...


