Lupine Publishers Group
Lupine Publishers
Menu
ISSN: 2637-4544
Review Article(ISSN: 2637-4544) 
How Do the Different Types of Diabetes Influence Pregnancy Outcomes? Retrospective study from January 2017 to Dec 2018 at Khoula hospital Volume 4 - Issue 3
Vijayalakshmy Attuveppil Raman1, Aditi Kishore Shinde2*, Reena Mani1, Reeni Mahil Cherian1, Raheela Naheed Khan1, Mradula Sharma1, Sudha Krishnan1, Anju Anna Biju1, Saima Batool1, Aisha Farooq1, Ezhyl Arasi1, Athira Rajamma1 and Anuja Thomas1
- 1Khoula Hospital Muscat Oman
- 2Glangwili General Hospital, Camarthen, UK
Received: February 24, 2021; Published: March 4, 2021
Corresponding author:Aditi Kishore Shinde, Glangwili General Hospital, Camarthen, UK
DOI: 10.32474/IGWHC.2021.04.000189
Abstract
Objective: The aim of our study was to determine the prevalence of diabetes in labouring women from January 2017 to December 2018 and compare the feto-maternal outcomes of GDM, Type 1 and Type 2 diabetes mellitus.
Methodology: A retrospective cohort of diabetic women in pregnancy who delivered at Khoula hospital were identified from the electronic medical record system in Khoula hospital, Muscat, Oman from January 2017 to December to 2018 and analysed for feto-maternal parameters.
Results: 11190 files were analysed, 2859 (25.5%) patients were identified to have diabetes. 437 patients were excluded and 2422 were selected. Overall prevalence of diabetes was 25.8%. 2062 (85.1%) had GDM, 329 (13.5%) NIDDM and 38(1.56%) had IDDM. Mean age was 32.8+/- 4.6yrs. The obesity rate in the cohort was 60.3% and overall mean BMI was 31.7+/- 5.2. Optimum control was achieved in 89.5% of women. Mean gestational age of delivery was 38+/- 1.2 wks. Macrosomia was seen in 5.7% and shoulder dystocia rate was 0.78%. 9.9% babies were born preterm overall. Overall induction of labor was 17.09% and caesarean rate was 27.4%. Mean birthweight was 3133+/-430gm. 88.4% of women had good neonatal outcome. 4.79% babies had congenital anomalies and 5.9 % babies were admitted to neonatal intensive care unit.
Conclusion: The accelerated rate of diabetes in pregnancy in this study could be explained by the exponential increase in obesity and lower fasting cut off values for diagnosis of diabetes. Timely induction of labor and caesarean section led to improved perinatal outcomes.
Keywords:Diabetes in Pregnancy; Gestational Diabetes; Maternal Outcomes; Caesarean Section; Perinatal Outcomes; Oman; Macrosomia; Shoulder Dystocia; Respiratory Distress Syndrome; Diabetes Control.
Introduction
Diabetes in pregnancy is increasing globally in light of lifestyle changes and lower thresholds of diagnosis. Incidence varies from 5 to 10 % depending upon geographical location, prevalence of obesity, ethnicity and extent of implementation of diabetic screening in routine antenatal care pathways [1,2]. It is estimated that approximately 87.5% have gestational diabetes, 7.5% have type 1 diabetes and the remaining 5% have type 2 diabetes [3]. In Oman, the recent estimates of diabetes in pregnancy was 18.34% in 2017 [4]. Diabetes in pregnancy is associated with adverse maternal and fetal outcomes like pre-eclampsia, urinary tract infections, preterm labor, macrosomia, increased induction of labor, caesarean section rates and increased neonatal intensive care stay [5,6]. Placental vascular malperfusion, re-setting of expression of genes within the placental energy sensing and oxidative stress rather than genetic differences in islet cell function and peripheral insulin resistance are novel postulated mechanisms leading to poor outcomes [7]. Recent studies like LIP [8]. and UPBEAT [9]. indicate that diet and lifestyle interventions are most effective in improving outcome if instituted prior to conception as glucose dysregulation occurs ten weeks prior to the diagnosis of gestational diabetes.
As there are substantial ethnic differences in glucose metabolism and incidence of diabetes, the objective of our study was to determine whether the prevalence and feto-maternal outcomes of diabetes in our institution is comparable to that in international studies. The aim of our study was to determine the prevalence of diabetes in laboring women over a two year period in Khoula hospital and compare the maternal and fetal outcomes of gestational diabetes, non-insulin and insulin dependent diabetic women during pregnancy.
Methodology
Time Period: Jan 2017 To Dec 2018
All patients who delivered in Khoula hospital over the above period were analysed for the variables relevant for pregnant diabetics using a well-designed proforma. Ethics approval was sought prior to starting the study by the Ethical approval Board of the department. There was no need for informed consent as the data was protected through the hospital medical records policy. The study was registered in the Oman National Medical Research Council Omanl research code (PRO06201941). Inclusion and exclusion criteria were followed. Inclusion criterion was all women with singleton diabetic pregnancies who delivered in Khoula Hospital. Exclusion criteria included all women not delivered in Khoula, incomplete data, women not reaching the laboratory criteria for diagnosis and multiple gestations. Primary outcome measures were the prevalence and distribution of the different types of diabetes, induction and caesarean section rate, macrosomia, shoulder dystocia, neonatal intensive care admission, birth injury and birth asphyxia. Secondary outcome measures were diabetes control, gestational hypertension, rate of congenital anomalies and hypoglycaemia. Data was retrieved from Al Shifa 3 computer system. Statistical analysis was carried out with the MedCalc, Excel Statistical functions, Relative Risk and ANOVA for correlational statistics were calculated online (https://goodcalculators. com). Diagnosis of diabetes in pregnancy was made according to international diagnostic criteria after oral glucose tolerance test with 75 gm glucose. A fasting blood sugar above 5.1 mmol and or 2 hour above 8.5 mmol were considered to be having gestational diabetes. Fasting blood sugars of more than 7.8mmol and 2 hours more than 11.1mmol were considered as overt diabetes. Previous records of patients were reviewed to categorise overt diabetics into type 1 and type 2.
All patients were given diabetic diet according to the caloric requirement based on the body weight. Gestational diabetics were initially puton diet for 1-2 weeks and if satisfactory glycemic control was not achieved as shown by pre-prandial and post-prandial blood sugars i.e. pre-prandial above 5.3 mmol and post prandial above 6.7 mmol, they were put on metformin in divided doses to a maximum of 2500 grams daily. If glycemia was not controlled with diet and metformin, insulin was administered in divided doses as double mixed regime or basal bolus regimen. Ultrashort acting insulins and long-acting insulins were given in few patients for glycemic control. Patients with uncontrolled blood sugars were admitted till optimum control was achieved. Timing of delivery was according to the departmental protocols. Well controlled diabetics on diet were induced at 40 weeks to 40 weeks +6 days. Well controlled diabetics on metformin or low dose insulin were delivered at 39-40 weeks. Well controlled diabetics on high dose insulin and insulin and/ or metformin delivered by 38 weeks. Decision was individualized in patients with poor control, complications like retinopathy, neuropathy, nephropathy and superimposed pre-eclampsia. Neonates were seen after birth by the Neonatologist and cared for in Special care Baby unit if required. All neonates were observed for hypoglycaemia, congenital anomalies, dyselectrolytemias, hyperbilirubinemia, respiratory distress syndrome and transient tachypnea of newborn.
Results
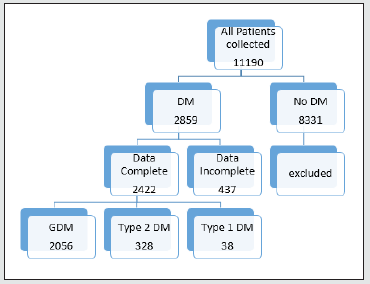
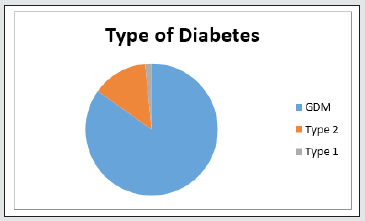
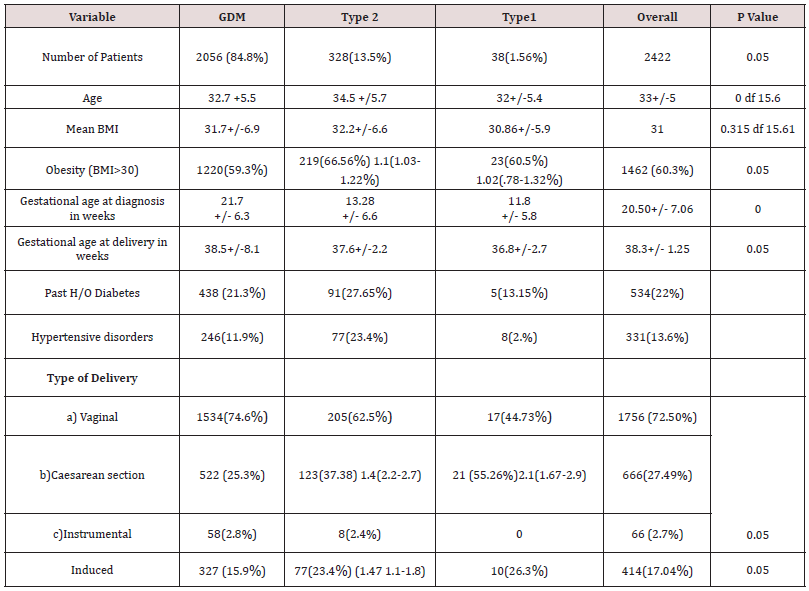
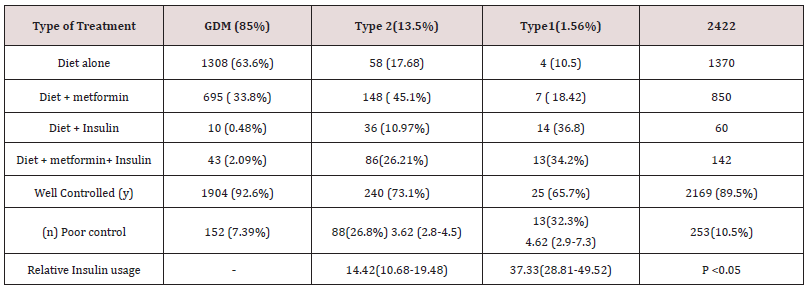
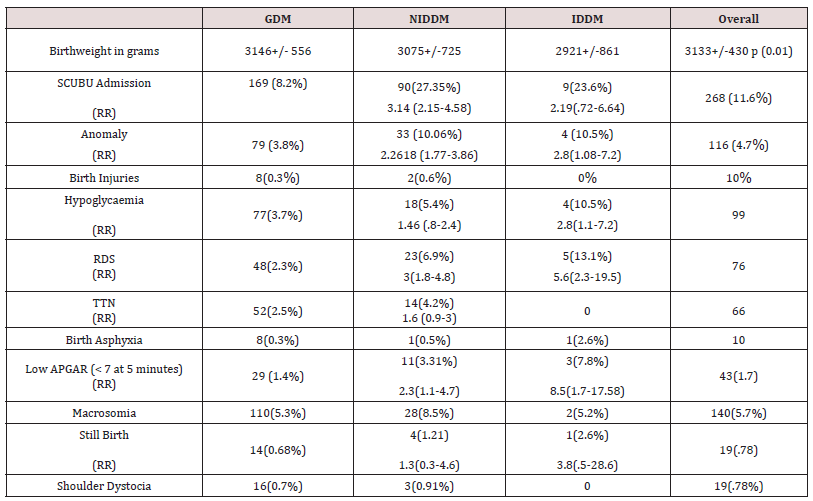
A total 11,190 case files were analysed during the study period within the parameters of inclusion and exclusion criteria. Descriptive logarithmic regressional analysis and IBM SpSS Statistics software were used for data analysis .2859(25.5%) patients were identified to have diabetes in pregnancy. 437 patients were excluded from analysis due to incomplete data. 2422 patients were selected for final analysis (Figure 1). It was found that 2056( 84.8%) had gestational diabetes,328 (13.5%) noninsulin dependent diabetes,and38 (1.56%) had insulin dependent diabetes (Figure 2). The mean age was 32.8+/- 4.6 yrs. Obesity rates were 58.9% (1220) in gestational diabetes,66.4% (219) in type 2 diabetics and 60% [4]. In type 1 diabetics respectively (Table 1). Overall mean BMI of this cohort was 31.7+/-5.2. On the analysis of the data, there was no significant difference in the BMI with diabetes type (p <0.5002). Previous history of diabetes in pregnancy and hypertension were the main risk factors noted in this study. Optimum control of diabetes was achieved in 89.5 % overall and 1904 (92.3%),240 (73.1%) 25(65.7%) in subgroups. Gestational age at delivery and birth weights were similar in all the three groups. Mean gestational age at delivery was 38 +/- 1.2 weeks and mean birthweight was 3133 +/- 430gm. Macrosomia was seen in 5.7% of babies (5.3,8.5 and 5.26% in the subgroups respectively) (Table 2).
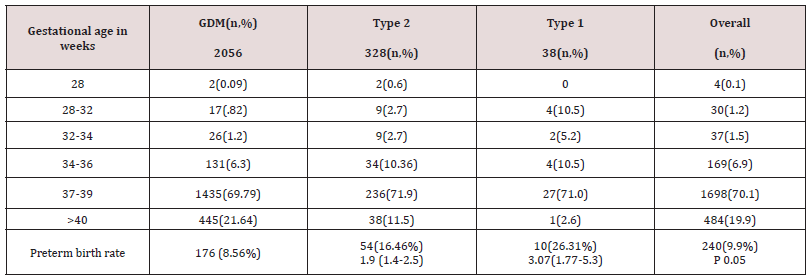
Overall induction of labor was 17.09%, Labour was induced in 327(15.9%),77 (23.4%) and 10(26.3%) of the subgroups. Overall caesarean section rate was 27.49 % with 522(25.3%), 123(37.5%) and 17 (44.7%) in the subgroups. Preterm delivery rates were 9.9% overall 8.3%,16.41% and 26.31 % respectively in the subgroups. (Table 3). It was found that as age advances the incidence of diabetes was also increasing. GDM peaked between 30-34 years of age whereas type 2 diabetes was more common between the age of 35-39 in this study. Contrary to the expectation, Type 1 diabetes was also more in the age group between 35-39 years However the number of patients with type 1 diabetes was very small (1.56 %) The most important reasons for admission were hyperemesis, control of blood sugar, reduced fetal movements, pregnancy induced hypertension and fetal monitoring. The mainstay of treatment was diet and metformin in this study.
Only 8.3% women required insulin overall. It was documented that four patients with type 1 diabetes were given diet which does not correlate with clinical management of type 1 (Table 4). 88.4 percent of women had good neonatal outcome. An APGAR score of less than 7 at 5 minutes was 29 (1.4%),11(3.3%), 3(7.8 %). 4.79% babies had congenital anomalies with 79 (3.8%),33 (10.06%) and 3 (7.8%) in subgroups.5.9% babies were admitted to the neonatal intensive care unit. The main causes for this were hypoglycaemia, respiratory distress syndrome, and transient tachypnea of newborn. The rates of birth asphyxia and birth injury were very low (.41%) (Table 5). There was a 1.2 [95% CI 0.8-2.0] relative risk of developing macrosomia in diabetic pregnancies which was statistically not significant (p<0.3). 58 women were needed to treat to prevent one macrosomic infant (NNT). Overall macrosomia rate was 5.7 %. in this study. Shoulder dystocia was seen in 19 patients (0.78%). Most of the shoulder dystocias were mild and there were no birth injuries, however in three patients severe shoulder dystocia which caused humerus fracture in a 4.6kg , clavicular fracture in a 3.1kg and Erb’s palsy in a 4.4kg baby respectively .There was no statistically significant correlation of diabetes with prematurity ( p < 0.072) f ratio 2.6555.9.9% of babies were born preterm in this cohort with 8.3%,16.41% and 26.31% in individual groups. The overall preterm rate did not differ much from general population.
Discussion
High prevalence of diabetes of 25.8% noted in this study is higher than the national average of 18.34% [2] and also more than in many countries [1,2]. We had a higher incidence of diabetes in our population as compared to international data (25% vs 15%) that could be explained by higher obesity rates and lifestyle factors in our cohort. We also found three women under the age of twenty years to have gestational diabetes implying that gestation diabetes can also occur in very young women. This could be attributed to higher obesity rates and higher mean average age of these women [10,11,12,13,14]. Obesity was slightly higher in patients with type 2 diabetics compared to gestational diabetics RR 1.1(1.03- 1.22), this could explained by common pathogenesis of metabolic syndrome. Risk of developing diabetes tripled when the BMI more than 30 and age more than 40. [15]. Women with obesity had higher placental weights, hyperlipidemia and increased leptin at term [16]. Women with hypertension and previous history of diabetes had an increased risk of developing diabetes in the current pregnancy which was also noted in our study [16]. It is seen that 15-60 % required pharmacological treatment in combination with diet and exercise to achieve euglycaemia [17]. In our study, medical nutritional therapy achieved euglycaemia in 43.4%. Two-thirds of gestational diabetics achieved good glycaemic control with diet alone while almost half of type 2 diabetics required metformin. 2.5 % of gestational diabetics required insulin as compared to 34.8% seen in international data [18]. 8.3 % of women overall and 70% with type 1 diabetes required insulin. Optimal diabetic control was achieved in almost nine out of ten women, despite that few fetal outcomes were adverse. The still birth rate in our study was 0.78% which is less than reported internationally [19]. The likelihood of stillbirth was 1.3 times in type 1 and 3.8 times in type 2 as compared to gestational diabetics. This could be explained by the fact that the placenta acts as a reservoir of glucose aggravating fetal hyperglycaemia and hyperinsulinemia and potentiating adverse outcomes [20]. Mean gestational age was 38+/1.2 weeks and the mean birth weight was 3100 +/- 430 gm. The mean birth weights differed within 300 gm between the 3 groups but were within the average for the Omani population [21]. Macrosomia (5.7% vs 11.8%) and preterm rates (9.9% vs 17.7%) were much lesser than that reported for diabetic pregnancies, which could be due to optimum blood sugar control in our cohort [22-24].
Type 2 diabetes were 1.9 (95% CI 1.4-2.5) and Type 2 Diabetics were 3 (95%CI 1.7-5.3) times more likely to be born preterm than gestational diabetics, however the macrosomia rates were similar across the subgroups.
Rates of shoulder dystocia in diabetic pregnancies vary from 8.4 to 23.5% [25]. depending upon the birthweight. However, we found macrosomia rates in our study was 5.7 % and shoulder dystocia occurred in 0.78%. This could be attributed to optimal glycaemic control, timely induction of labor, appropriate case selection for caesarean section and anticipation for shoulder dystocia [26,27]. Our rates of induction of labor and caesarean section rate were similar to those reported internationally we had a 17 % induction rate as compared to 20 % internationally [27]. Both Type 1 and Type 2 diabetics were 1.4 times and 1.6 times more likely to be induced. We followed local guidelines for induction of labor. Standard protocols offer delivery depending upon the type of diabetes and degree of glycaemic control from 37 weeks onwards [3]. Our induction protocol permitted delayed delivery of well controlled diabetics till 40 weeks and beyond. Our overall caesarean section rate was 27.5%. which is less than that reported internationally [3]. though in insulin dependent diabetics it was 55 % which is acceptable. Type 2 diabetics were 1.4 times more likely and type 1 diabetics were twice as likely to undergo a caesarean section. Though the rate of caesarean section was high in this subgroup we cannot generalize our findings due to small sample size. 5.9 % of babies were admitted in the neonatal intensive care unit. Babies of type 2 diabetics were thrice and those of type 1 diabetics twice more likely to be admitted to the neonatal intensive care unit. The main causes for this were hypoglycaemia, respiratory distress syndrome, and transient tachypnea of newborn, hypothermia, meconium aspiration and hyperbilirubinemia. The relative risk of developing RDS was 3 (95% CI 1.8-4.8) vs 5.6 (95% CI 2.3-19.5), low APGAR scores 2.3(95% 1.1-4.7) vs 8.5(1.7-17.5), stillbirth1.3(0 .3-4.6) vs 3.8(0.5-28.6) and hypoglycaemia 1.46 (0.8-2.4) vs 2.8(1.1-7.2) was higher in type 1 as compared to type 2 diabetics. NfKB signaling activates the pro-inflammatory and pro-oxidative pathways generative Reactive Oxygen Species (ROS) this is the new postulated mechanism for poor outcomes like macrosomia and neonatal intensive care stay [20].
The congenital anomaly rate in our study was 4.7% overall with type 2 diabetics at 2.2 risk and type 1 diabetics 2.8 risk of anomaly. In this study we could not identify any predilection towards any specific organ system as anomalies ranged from anencephaly to congenital talipes equinovarus. The strength of our study was good numbers, meticulous statistical technique and new practice points for management of diabetes which emerged from out data. There was no selection bias as a diagnostic criterion was applied. We could suggest certain good practice points from the results of our cohort (Table 6). The study design was appropriate for the outcome measures. The weaknesses of our study were retrospective nature and smaller numbers in the type 1 subgroup for comparative analysis. Moreover, as all the data is from a single institution so the applicability of results to general population is limited.
Conclusion
The accelerated rate of diabetes in pregnancy in this study could be explained by the exponential increase in obesity and lower fasting cut off values for diagnosis of diabetes. Similar mean birth weights and lower rates of macrosomia noted in this study were due to optimal control of glycaemia in our population. Timely induction of labor and caesarean section led to improved perinatal outcomes. Neonatal complications like shoulder dystocia and birth injuries were minimal in the studied population. Favorable maternal and neonatal outcomes achieved in this study were attributed to high quality antenatal, intrapartum and neonatal care.
References
- Deputy NP, Kim SY, Conrey EJ, et al. (2018) prevalence and changes in the preexisting diabetes and gestational diabetes among women who had a live birth-United States, 2012-2016 MMWR Morb Mortal Wkly Rep 67(43): 1201-1207.
- Hedderson M, Ehrlich S, Sridhar S, Kai McKeever Bullard (2012) Racial /ethinic disparities in the prevalenceof gestational diabetes mellitus by BMI. Diabetes Care 35(7): 1492-1498.
- Walker JD (2008) NICE guidance on diabetes in pregnancy: Management of diabetes and its complications from preconception to the postnatal period. NICE clinical guideline 63. London, March 2008. Diabetic Medicine 25(9): 1025-1027.
- NCCD Website Oman Antenatal indicators for 2019.
- Metzer BE, Lowe LP, Dyer AR, et al. (2008) HAPO Study Cooperative Research Group. Hyperglycaemia and adverse pregnancy outcomes. N engl J med 358(19): 1991-2002.
- Weintrob N, Karp M, Hod M, Elisabeth R Trimble, Udom Chaovarindr, et al. (1996) Short- and long-range complications in offspring of diabetic mothers. J Diabetes Complications 10(5): 294-301.
- Sweeting AN, Ross GP, Hyett J, Molyneaux L, Constantino M, et al. (2016) Gestational diabetes mellitus in early pregnancy: Evidence for poor pregnancy outcomes despite treatment. Diabetes care 39(1): 75-81.
- Vinter CA, Jensen DM, Ovesen P, Beck-Nielsen H, Jørgensen JS (2011) The LiP (Lifestyle in Pregnancy) study: A randomized controlled trial of lifestyle intervention in 360 obese pregnant women. Diabetes care 34(12): 2502-2507.
- Poston L, Bell R, Croker H, Flynn AC, Godfrey KM, et al. (2015) Effect of a behavioural intervention in obese pregnant women (the UPBEAT study): A multicentre, randomised controlled trial. The lancet Diabetes & endocrinology 3(10): 767-777.
- Nesbitt TS, Gilbert WM, Herrchen B (1998) Shoulder dystocia and associated risk factors with macrosomic infants born in California. Am J Obstet Gynecol 179(2): 476-480.
- Black MH, Sacks DA, Xiang AH, Lawrence JM (2013) The relative contribution of prepregnancy overweight and obesity, gestational weight gain, and IADPSG-defined gestational diabetes mellitus to fetal overgrowth. Diabetes Care 36(1): 56-62.
- Casey BM, Lucas MJ, Mcintire DD, Leveno KJ (1997) Pregnancy outcomes in women with gestational diabetes compared with the general obstetric population. Obstet Gynecol 90(6): 869-873.
- Bryson CL, Ioannou GN, Rulyak SJ, Critchlow C (2003) Association between gestational diabetes and pregnancy-induced hypertension. Am J Epidemiol 158(12): 1148-1153.
- Shoham I, Wiznitzer A, Silberstein T, D Fraser, G Holcberg, et al. (2001) Gestational diabetes complicated by hydramnios was not associated with increased risk of perinatal morbidity and mortality. Eur J Obstet Gynecol Reprod Biol 100(1): 46-49.
- Aberg A, Rydhström H, Källén B, Källén K (1997) Impaired glucose tolerance during pregnancy is associated with increased fetal mortality in preceding sibs. Acta Obstet Gynecol Scand 76(3): 212-217.
- Silva JC, Fachin DRRN, Coral ML, Bertini AM (2012) Perinatal impact of the use of metformin and glyburide for the treatment of gestational diabetes. J Perinatal Med 40(3): 225-228.
- Gante I, Melo L, Dores J, Ruas L, doCeu Almeida M (2018) Meformin in gestational diabetes mellitus: Predictors of poor response. European Journal of Endocrinology 178(1): 129-135.
- Wang M, Athyade N, Padmanabhan S, Cheung NW (2019) Causes of stillbirths in diabetic and gestational diabetes pregnancies at an NSW tertiary referral hospital. Anzjog 59(4): 561-566.
- Bianchi C, de Gennaro G, Romano M, Aragona M, Battini L, et al. (2018) Pre-pregnancy obesity, gestational diabetes or gestational weight gain: Which is the strongest predictor of pregnancy outcomes? Diabetes research and clinical practice 144: 286-293.
- Abdulrahim, Idris, Ur-RahmanAbdellatif, Fuller (2017) Interpreting Neonatal Growth Parameters in Oman. Sultan Qaboos univ Med J 17(4): 411-417.
- Ehrenberg HM, Mercer BM, Catalano PM (2004) The influence of obesity and diabetes on the prevalence of macrosomia. American journal of obstetrics and gynaecology 191(3): 964-968.
- Salihu HM, Dongarwar D, King LM, Yusuf KK, Ibrahimi S, et al. (2019) Trends in the incidence of fetal macrosomia and its phenotypes in the united states, 1971-2017. Archives of Gynaecology and Obstetrics 301(2): 415-426.
- Kock K Kock, F Klein K, Bancher Todesca D, Helmer H (2010) Diabetes mellitus and risk of preterm birth with regard to risk of spontaneous preterm birth. The journal of Maternal-Fetal and Neonatal Medicine 23(9): 1004-1008.
- Young BC, Ecker JL (2013) Fetal macrosomia and shoulder dystocia in women with gestational diabetes. risks amenable to Treatment?. Curr Diab Rep 13(1): 12-18.
- Smith GC, Smith MF, McNay MB, Fleming JE (1997) The relation between fetal abdominal circumference and birthweight: Findings in 3512 pregnancies. Br J Obstet Gynaecol 104(2): 186-190
- Hackmon R, Bornstein E, Ferber A, Javine Horani, Christopher P O'Reilly Green, et al. (2007) Combined analysis with amniotic fluid index and estimated fetal weight for prediction of severe macrosomia at birth. Am J Obstet Gynecol 196(4): 333. 1-4.
- Induction of Labor- NICE guidelines 2008.

Top Editors
-

Mark E Smith
Bio chemistry
University of Texas Medical Branch, USA -

Lawrence A Presley
Department of Criminal Justice
Liberty University, USA -

Thomas W Miller
Department of Psychiatry
University of Kentucky, USA -

Gjumrakch Aliev
Department of Medicine
Gally International Biomedical Research & Consulting LLC, USA -

Christopher Bryant
Department of Urbanisation and Agricultural
Montreal university, USA -

Robert William Frare
Oral & Maxillofacial Pathology
New York University, USA -

Rudolph Modesto Navari
Gastroenterology and Hepatology
University of Alabama, UK -

Andrew Hague
Department of Medicine
Universities of Bradford, UK -

George Gregory Buttigieg
Maltese College of Obstetrics and Gynaecology, Europe -

Chen-Hsiung Yeh
Oncology
Circulogene Theranostics, England -
.png)
Emilio Bucio-Carrillo
Radiation Chemistry
National University of Mexico, USA -
.jpg)
Casey J Grenier
Analytical Chemistry
Wentworth Institute of Technology, USA -
Hany Atalah
Minimally Invasive Surgery
Mercer University school of Medicine, USA -

Abu-Hussein Muhamad
Pediatric Dentistry
University of Athens , Greece

The annual scholar awards from Lupine Publishers honor a selected number Read More...


