Lupine Publishers Group
Lupine Publishers
Menu
ISSN: 2641-6794
Short Communication(ISSN: 2641-6794) 
We Can Cut Global Warming Volume 2 - Issue 5
Roger D Mastersa*
- Department of Government, Dartmouth College, USA
Received: May 29, 2019; Published: June 04, 2019
Corresponding author: Roger D Masters, Professor Emeritus, Department of Government, Dartmouth College, Hanover, USA
DOI: 10.32474/OAJESS.2019.02.000149
Short Communication
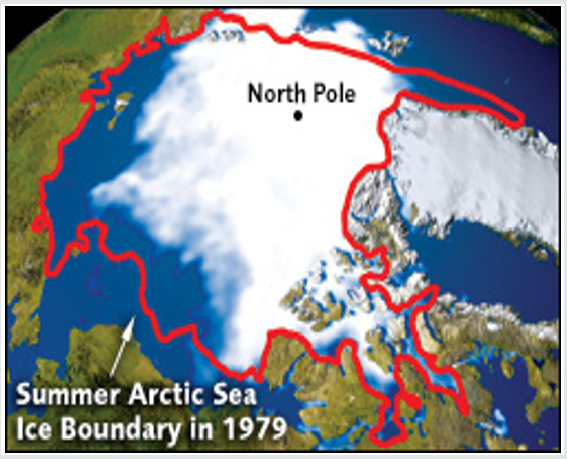
It’s time to recognize that Global Warming is a FACT (visible in the NASA photo below), which means the U.S. needs to reduce our CO2 emissions by a national energy transition from oil and carbon to hydrogen and solar fuels. Don’t believe it? Just look at the photos and ask every “Global Warming denier” (especially President Trump) to explain the 300,000 square miles of sea-ice between the ice cap over the North Pole and the red line that melted between 1979 and 2012. Melting polar ice along with melting glaciers (which have turned into flowing rivers in the last century) have produced water that had to go somewhere -- and that’s into the world’s oceans (whose warming melted the polar sea-ice from the bottom). Warm oceans breed hurricanes. After this year’s example of coastal flooding, any residual doubts should be gone just ask the population of Houston and other communities flooded from this year’s hurricanes. Comparable changes thousands of years ago took centuries -- not just the 33 years between 1979 and 2012. There’s scientific consensus that Global Warming is largely due to a greenhouse effect from emissions of carbon dioxide. The major sources of CO2 are oil and coal, fossil fuels that have been the principal energy sources for industrial societies. America’s substantial contribution to Global Warming has received virtually no media coverage in the U.S.
The world’s leading sources of CO2 emissions in 2007 were China (6.0 Billion tons) and the U.S. (5.768 Billion tons); no other country emitted over Russia’s 1.6 Billion tons (OECD in Figures 2009 [Paris: OECD, 2009], pp. 48-49). Global warming can be greatly reduced if not ended by substituting zero CO2 emitting fuels (hydrogen and solar energy) for CO2 polluting fossil fuels (oil and coal) -- and using solar panels with new battery technologies to capture this zero CO2 energy source. Our country ought to take the lead, stimulating our market economy to complete current work on improvements like 3D sheets of solar collectors to cover the roof-tops of houses as well as hydrogen fuel-cells and larger capacity batteries for American autos and trucks. Apart from two articles in the “Science Times” section of New York Times (Jan. 3, 2016, pp. D1-3), most Americans haven’t been told that Europeans are developing the new technologies needed for Zero-CO2 fuels. America will get nowhere by following Donald Trump (whose idea of economic development is the $8Billion dollar Dakota Access pipeline as a gift to America’s oil cartel and “saving” the coal industry) will get America nowhere. Since all major automakers have developed pollution free hydrogen cars and many are following Tesla toward electric autos, within a decade or two new oil pipelines will be obsolete. Solar panels are already covering rooftops.
Further innovations in the production and implementation of hydrogen and solar energy are needed to complete the transition away from fossil fuels by cutting costs and improving efficiency. To implement these goals, lithium ion batteries with greatly increased storage capacity (needed because sun shines in daytime, electricity is used at night) are being developed. Especially for suburban and rural housing, development of more efficient inexpensive solar collectors and batteries will give many households a self-sufficient energy supply. The investments needed to bring to market less expensive zero CO2 fuels will not only generate economic activity in the U.S. (a boom that will create thousands of jobs); it will also multiply technologies patented in America that can find international markets (like GM’s hydrogen patents sold to Audi in Europe).
America’s mass media and educated public should demand government subsidies to speed the technological developments needed for a more rapid transition to the age of zero CO2 fuels. How long will it take for American businessmen, politicians, and journalists (not to mention our silent scientists) to recognize the economic boom that will accompany the transition from fossil fuels to the age of solar and hydrogen energy (Figure 1).
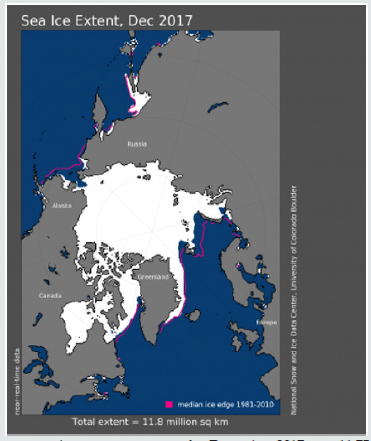
This NASA satellite photograph of the area covered by Arctic sea-ice on Aug. 26, 2012 shows that the melting of the North Pole’s icecap in the 33 years since 1979 covered at least 300,000 square miles. In this photo, the Polar sea-ice had the smallest extent that had ever been recorded in more than three decades of satellite measurements, according to scientists from NASA and the National Snow and Ice Data Center. This melting is due to human activities because the area between the red line and the current sea ice is too large to have melted so rapidly from natural causes. (Source: http://www.nrdc.org/globalwarming/qthinice.asp). NOTE: This photograph of the sea-ice covering the North Pole and the complementary photo of the Northern Pacific Ocean (Figure 2) should suffice as evidence that Global Warming has had similar effects in the melting of sea-ice in both areas. This confirms the evidence that sea-ice melts on its lower surface in contact with the ocean (not from the upper surface in contact with the earth’s atmosphere).
Arctic sea ice extent for December 2017 averaged 11.75 million square kilometers (4.54 million square miles), the second lowest in the 1979 to 2017 satellite record. This was 1.09 million square kilometers (420,900 square miles) below the 1981 to 2010 average and 280,000 square kilometers (108,100 square miles) above the record low December extent recorded in 2016. Extent at the end of the month was below average in the far northern Atlantic Ocean and Barents Sea, slightly above average in western Hudson Bay, and continued to be below average in the Bering and Chukchi Seas. Near-average conditions prevailed along the eastern coast of Greenland and in the Sea of Okhotsk. Arctic sea ice extent for December 2017 averaged 11.75 million square kilometers (4.54 million square miles), the second lowest in the 1979 to 2017 satellite record. This was 1.09 million square kilometers (420,900 square miles) below the 1981 to 2010 average and 280,000 square kilometers (108,100 square miles) above the record low December extent recorded in 2016. Extent at the end of the month was below average in the far northern Atlantic Ocean and Barents Sea, slightly above average in western Hudson Bay, and continued to be below average in the Bering and Chukchi Seas. Near-average conditions prevailed along the eastern coast of Greenland and in the Sea of Okhotsk. Read scientific analysis on Arctic sea ice conditions. We provide an update during the first week of each month, or more frequently as conditions warrant.
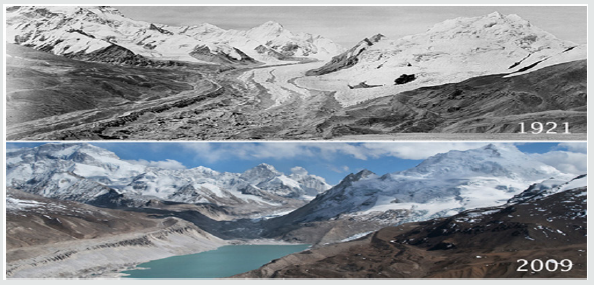
(Figure 3) E.O. Wheeler’s 1921 photo of West Rongbuck Glacier at the foot of Mount Everest (the tallest peak in the center of the photos, and David Breashears’ 2009 photo showing a flowing river and bare mountains at the same Himalaya scene (http://www.nrdc. org/globalwarming/qthinice.asp). Unlike the cycles of the earth’s warmer temperature thousands of years ago (studied in deep Antarctic ice), this current evidence of Global Warming took place in just 88 years. Combining Figures 1 & 2 provides images of changes at both sea level (both the North and South Poles) and in the high Himalayan mountains. Water from this melting of massive amounts of ice and snow is producing rising sea levels along our shores that have already flooded Miami and Houston when hurricane winds produce surging seas.

Top Editors
-

Mark E Smith
Bio chemistry
University of Texas Medical Branch, USA -

Lawrence A Presley
Department of Criminal Justice
Liberty University, USA -

Thomas W Miller
Department of Psychiatry
University of Kentucky, USA -

Gjumrakch Aliev
Department of Medicine
Gally International Biomedical Research & Consulting LLC, USA -

Christopher Bryant
Department of Urbanisation and Agricultural
Montreal university, USA -

Robert William Frare
Oral & Maxillofacial Pathology
New York University, USA -

Rudolph Modesto Navari
Gastroenterology and Hepatology
University of Alabama, UK -

Andrew Hague
Department of Medicine
Universities of Bradford, UK -

George Gregory Buttigieg
Maltese College of Obstetrics and Gynaecology, Europe -

Chen-Hsiung Yeh
Oncology
Circulogene Theranostics, England -
.png)
Emilio Bucio-Carrillo
Radiation Chemistry
National University of Mexico, USA -
.jpg)
Casey J Grenier
Analytical Chemistry
Wentworth Institute of Technology, USA -
Hany Atalah
Minimally Invasive Surgery
Mercer University school of Medicine, USA -

Abu-Hussein Muhamad
Pediatric Dentistry
University of Athens , Greece

The annual scholar awards from Lupine Publishers honor a selected number Read More...


