


Lupine Publishers Group
Lupine Publishers
ISSN: 2641-6794
Research article2641-6794 
Two-Dimensional Discriminant Locality Preserving Projections for Crop Leaf Disease Detection Volume 4 - Issue 2
Received: November 11, 2019; Published: December 02, 2019
Corresponding author: Ping Li Hao Yuan Qingqing Zhang, Zhengzhou SIAS University, Zhengzhou, China
DOI: 10.32474/OAJESS.2019.04.000182
Abstract
There are many kinds of crop diseases, which directly affect the yield and quality of crops and cause immeasurable losses. Using image processing and pattern recognition technology, it is simple and fast to identify crop diseases and provide necessary information for taking prevention measures in time. A crop disease recognition method is proposed based on two-dimensional discriminant locality preserving projections (2D-DLPP). 2D-DLPP tries to find a mapping matrix to reduce the dimensionality of the original diseased leaf images, so that the intra-class samples in low-dimensional mapping subspace are closer to each other, while the inter-class samples are far from each other, which can improve the recognition rate of the algorithm. The experiments on the common cucumber disease leaf image dataset are carried on and compared with other plant disease recognition algorithms. The results show that the 2D-DLPP based method is effective and feasible for crop disease identification.
Keywords:Crop disease identification; Dimensional reduction; Discriminant locality preserving projections (DLPP); Twodimensional DLPP (2D-DLPP)
Introduction
Crop diseases seriously affect the yield and quality of crops
and decrease the economic income of the farmers. It is an essential
research topic to recognize crop diseases by detecting the disease
symptom as soon as they appear on the diseased leaves [1,2]. For
crop disease management, it is important to automatically detect
and identify the crop diseases at a stage to treat them properly.
Sometimes farmers are unable to pay attention to the diseases or
face difficulty in identifying the diseases [3,4]. Then the best chance
for disease control may be lost. Every disease has a different remedy
to work out. For example, fungi-based disease can be prevented by
disrupting the life cycle of the pathogen. The current approach of
disease detection is manual, which means farmers mainly depend
on the guidebooks or use their experiences to identify the diseases
[5]. Each crop disease has different stages of growth. Crop disease
identification is generally based on crop disease leaves to identify.
The image of crop disease leaves can be used to diagnose the disease.
Whenever the disease occurs on the crop, farmers must keep eyes
on the infection. This approach is time-consuming, laborious, and
the prediction lags, and it is not suitable to be developed in a large
range.
With scientific and technical advancement of computer, pattern
recognition, image processing and the urgent need of agricultural
information, many scholars at home and abroad try to use computer
image processing and pattern recognition technology to realize
automatic identification and diagnosis of crop diseases. More
reliable and effective recognition methods have been proposed
and developed for early detection of crop disease [7-10]. The study
of crop disease diagnosis technology based on computer vision
will effectively promote the comprehensive management of crop
disease [11,12]. The crop disease recognition process based on the
diseased leaves is mainly composed of image acquisition, disease
spot segmentation, feature extraction and feature recognition. The
diseased leaf image segmentation is one of the important stages in
crop disease recognition. The segmentation result directly affects
the efficiency and effect of disease diagnosis in the later stage. It
is to segment an image into several distinct regions and extract
the interested objects. In the research and application of image
segmentation methods for disease leaves, people are usually only
interested in the image of disease leaves, which corresponds to
specific and unique areas in the image.
To improve the accuracy and stability of disease spot
segmentation, Wang et al. [13] proposed an adaptive segmentation
method for crop disease images based on K-means clustering,
including three stages. So crop disease diagnosis method based
on disease image processing research on crop protection of
automation, intelligent and networked, digitized, not only can solve
caused by a lack of knowledge growers, cause errors in judgment
and the prevention and control measures, and can be a lot of cost
saving and labor, avoid because of a shortage of labor force to
cause trouble. Baum et al. [14] used Sobel edge detection operator
method to segment barley plaque, and effectively separated the
plaque from the leaves. Yasue Mitsukura [15] segmented images
by semi-supervised fuzzy clustering, which achieved good results,
but also had some limitations. Not all images were applicable to
semi-supervised fuzzy clustering, and the parameter values in
image segmentation were obtained through many experiments, so
parameters given in advance could not be used. Jie et al. [16] first
used two intersecting straight lines to detect the four edge points
of the complex blade. Then the “smart scissors” method was used
to track the contour of the blade. Finally, the user can check and,
if necessary, re-enter the original four edge points with the mouse
to correct. This method is only suitable for the simple shape of
leaves without leaf splitting, and the segmentation success rate
is low. Rupali [17] calculated the shielding threshold of the green
pixels of the disease image with the maximum inter-class variance
method, eliminated the zeroing RGB pixels and the edge features
of infection, and successfully separated the disease spots from the
leaves with k-means clustering. Yun et al. [18] selected the first and
second moments of each component in RGB color space, the first
and second moments of each component in HIS color space, and
the first and second moments of each component in YCbCr color
space. Four shape characteristics, such as eccentricity, sphericity,
complexity and rectangularity, were extracted. Energy, correlation,
moment of inertia, contrast and entropy are 5 texture features,
which can be used as effective characteristics of cucumber leaf
diseases. Chung et al. [19] proposed to use the morphological
characteristics of rice such as height, width, length-width ratio, first
internode length, second internode length and leaf and trunk Angle
as the characteristics of rice disease identification and obtained
a good identification rate. In terms of crop disease identification.
Omrani et al. [20] proposed the diagnosis of apple disease based on
radial basis function and support vector regression. Using k-means
cluster detection in epidemic areas, the accuracy of disease
identification was compared between rtial Neural Network and
support vector machine. It was found that SVM identification had
better effect on apple disease diagnosis than ANN.
From the above algorithms, it is found that three characteristics
of color, shape and texture of the diseased leaves are main features
for crop leaf disease recognition. Color features describe the
surface properties of objects in an image or image region. Texture
is a pattern of object surface structure, a pattern of color gray scale
in space with a certain form of change, and a regional nature of
image. Another important feature of shape description image is a
local feature. Although it is easy to extract a lot of features from
each diseased leaf image, it is difficult to decide the optimal feature
set because of the complicity diversity and uncertainty, as shown in
Figure 1. Some features may be redundant and even affect disease
identification rate.
Figure 1: Some examples of common cucumber disease leaf images.

Manifold learning is to map the high dimensional data into the low dimensional feature subspace to realize the classification task better. Supervised manifold learning can effectively explore the inherent characteristics of nonlinear data. Linear discriminant analysis (LDA) is one of the most popular dimensionality reduction methods in image recognition [21]. It is a linear algorithm, is not effective for nonlinear data. Locality preserving projections (DLPP) is a direct and complete implementation of locality preserving projections (LPP) algorithm, which can directly optimize locality preserving criterion on high-dimensional raw images data via simultaneous diagonalization for image recognition without any dimensionality reduction preprocessing [22]. Nevertheless, LDA and DLPP always suffer from small-sample-size problem and some undesired behaviors caused by globality, namely ignoring local geometric structure of images. To fully capture the geometric information from the original training images, some two-dimensional image base manifold learning algorithms have been proposed for image classification, such as two-dimensional discriminant locality preserving projections (2D-DLPP) [23,24]. 2D-DLPP mainly relies upon the local structure information in the rows and columns of images for efficient image feature extraction and dimensionality reduction [25]. Based on 2D-DLPP, a crop disease recognition method is proposed by incorporating both class label information and neighborhood information to pull the within-class points as close as possible, and push those betweenclass points far apart.
2D-DLPP
2D-DLPP is to learn a linear transformation A to reduce the dimensionality of the original images, so as to make the withinclass images as close as possible, while the between-class images as far as possible. Suppose X1,X2,…,XN are N training images. A node in the within-class graph Gw or between-class graph Gb corresponds to a training image, thus, two graphs are used to model the intrinsic manifold structure of image space, while the structure inside the images is not considered. The within-class similarity weight of Gw and between-class similarity weight of Gb are respectively defined as follows:
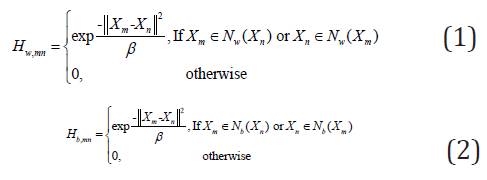
where Nw(Xm) is the within-class neighborhood set of Xm, Nb(Xm) is the between-class neighborhood set of Xm. Two objective functions of 2D-DLPP is defined based on Hw,mn and Hb,mn as follows,
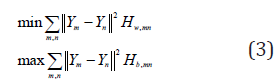
From Eq.(3), it is found that the objective functions on the within-class graph gives a heavy penalty if neighboring images Xm and Xn are mapped very unlike while they are actually the within-class images; while the objective function on the betweenclass graph gives a heavy penalty if neighboring images Xm and Xn are mapped so like each other while they actually belong to the different classes. Therefore, the objective functions can ensure that if Xm and Xn are similar and sharing the same label then Ym and Yn are similar as well; meanwhile to ensure that if Xm and Xn are similar but with different labels then Ym and Yn are very unlike.
By simple algebraic formulation, Eq.(3) can be formulated as:
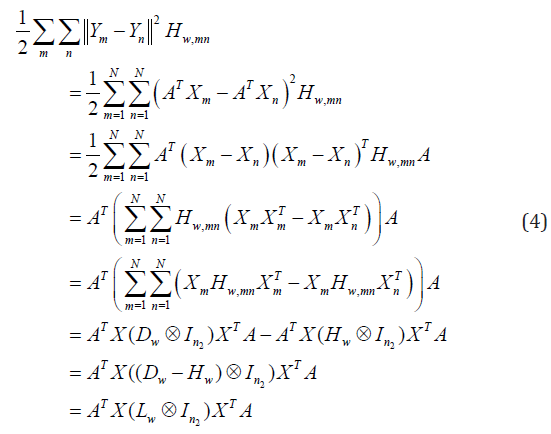
where X = [ X1, X2,...XN] is the training space of size n1 × Nn2,
Lw = Dw − Hw is a matrix of size N×N, Hw is a matrix of size N×N with
elements Hw,mn, and Dw is a diagonal matrix with elements Dw,mn =Σn Hw,mm
, In2
is an identity matrix of order n2, and the operator ‘⊗’ is the
Kronecher product of the matrices.
The Kronecher product is used to extend Lw In2 ⊗
to n2N ⊗ n2N as follows:
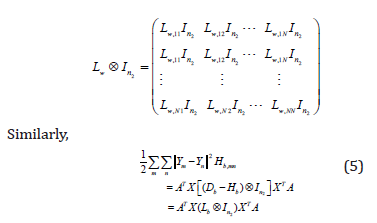
where Lb = Db − Hb , Hb is the matrix of size N×N with elements Hb,mn, and Db is a diagonal matrix with elements Db,mm =Σ Hb,mn.
From the above analysis, the optimal problem is defined as follows:
argmax[a( ATX(Lb⊗In2)XTA) − (1− a)(AT X(Hw⊗In2) XTA)] (6)
where a is an adjustable parameter in range of (0,1).
Then we can easily find that A consists of the eigenvectors associated with d top eigenvalues of the following eigen-equation,
Let a1, a2,..., ad be the first d solution of Eq. (7), which are selected according to their d eigenvalues, where λ1 > λ2...> λd. The optimal projection matrix Aopt is obtained by Aopt = [a1, a2,..., ad]. Then every training image and test image Xm can be projected as
where Ym is a low-dimensional projection matrix of Xm.
2D-DLPP aims to seek a projection matrix characterized
by within-class image compactness and between-class image
separability. Its procedure for crop disease recognition is formally
summarized as follows:
(1) Assign neighbors to each data point Xi by using k nearest neighbors, spilt it into two subsets: Nw(Xi) and Nb(Xi), and then construct Gw and Gb;
(2) Choose the weights Eqs. (1) and (2);
(3) Construct the optimal objection function Eq.(3);
(4) Compute the eigenvector and eigenvalue of Eq.(7);
(5) Output the final optimal transformation matrix A;
(6) Project the test images to low-dimensional representation
in the discriminating subspace by Eq.(8).
(7) Predict the corresponding class labels using the nearestneighbor classifier. For the projection Ytest corresponding to the test image Xtest, compute the distance (dtest,Yi )= ||Ytest−Yi||. If the distance between Ytest and Yi is minimal, and Yi belong to the ith class, then Xtest is classified as belonging to the ith class.
Experiments and analysis
In this Section, to validate the performance of the proposed method, a lot of experiments on a real-world cucumber diseased leaf image dataset are carried on and compared with three methods, i.e., Improved KPCA/GA-SVM Classification Model (IKPCA/GA-SVM)[16], Global-Local Singular value decomposition (GLSVD) [26] and Image Processing Technology (IPT) [27]. In these methods, 1-nearest neighbor classifier is adopted to recognize disease classes. We collected 400 diseased leaf images from six kinds of common cucumber leaf diseases, i.e., powdery mildew, Black spot, Anthracnose and Angular spot. Each disease has 100 leaf images with at least one typical symptom, different sizes (JEPG format), orientation, illumination and background. All leaf images were taken by a Canon A640 digital camera with a resolution of 1200*1600, from the greenhouse cucumber orchard, Yangling agricultural high-tech industrial demonstration area, Shaanxi, China. The K-means clustering algorithm is used to segment the diseased leaf images and a segmented spot dataset is constructed [18]. Some examples of the original diseased leaf image dataset and the segmented lesion image dataset are shown in Figure 2.
Figure 2: Examples of diseased cucumber images and corresponding to segmented lesion images.

Five-fold cross validation is used to conduct the disease recognition experiments. That is, divide all data set into 5 parts, and take turns to take 4 of them as training data and the rest as test data for the experiment. Each experiment yields a corresponding accuracy rate. The average value of the accuracy of the result for 5 times is used as an accuracy of the algorithm. In this paper, 50 times 5-fold cross validation are carried out, and then its mean value is calculated as the accuracy of the algorithm. The parameter k can be set to 3 when constructing the neighborhood graph. 2D-DLPP is used to extract the classification features. The parameters α and β are set as 0.7 and 200 by 5-fold cross validation experiment, the optimal recognition rate can be obtained. At last, we use the 1-nearest neighbor classifier for classification. The optimal recognition rates are shown in Table 1. From Table 1, it is found that the proposed method achieves much better recognition rate than other approaches, and its recognition rates of four kinds of leaves are all above 91%. The reason is that, the proposed method can maximize the distance between the inter-class samples and minimize the distance between the intra-class samples, and fully retain the local and global information, meanwhile considering the local geometric structure of images.
Table 1: Cucumber disease recognition rates (%) by IKPCA/GA-SVM, GLSVD and IPT on different datasets.

Conclusion
Crop disease detection and recognition by the disease leaves is very important for timely controlling the disease is a challenging task. It is an important part of plant disease management and plays a key role in the management and decision-making of agricultural production. Because the fact collected disease leaf images are often complex and irregular with massive background, it is still challenging topic. A crop disease recognition method is proposed based on 2D-DLPP. By introducing the inter-class constraints and class identification information into DLPP, 2D-DLPP can obtain more discriminant information to better reflect the class relations by preserving the locality and local geometric structure of images by maximizing the between-class scatter and withinclass scatter. Precision agriculture can enable significant progress in improving yield outcomes and controlling diseases for farmers. Recent progress in sensing and perception promises to further improve the use of precision agriculture by allowing the detection of plant diseases. When coupled with robotics methods for spatial localization, early detection of plant diseases will allow farmers to respond in a timely and localized manner to disease outbreaks and limit crop damage.
Acknowledgments
This work is partially supported by the Key Scientific Research Projects of Henan Higher Institutions No. 19B520029 and Henan Science and Technology Research Program Nos. 172102210512 and 172102210109.
References
- Martinelli F, Scalenghe R, Davino S (2015) Advanced methods of plant disease detection. A review. Agronomy for Sustainable Development35(1):1-25.
- Hiary HA, Ahmad SB, Reyalat M (2011) Fast and Accurate Detection and Classification of Plant Diseases. International Journal of Computer Applications 17(1):31-38.
- Kaur S, Pandey S, Goel S (2018) Plants Disease Identification and Classification Through Leaf Images: A Survey. Archives of Computational Methods in Engineering 26(2):507-530.
- Bagde S, Patil S, Patil S (2015) Artificial neural network-based plant leaf disease detection. Int J Comput Sci Mob Comput 4(4):900-905.
- Bashish DA, Braik M, Bani-Ahmad S(2011) A framework for detection and classification of plant leaf and stem diseases. IEEE InternationalConference on Signal & Image Processing.
- Yi Fang, Ramaraja P. Ramasamy(2015)Current and Prospective Methods for Plant Disease Detection. Biosensors 5(3): 537-561.
- Gulhane MVA, Gurjar AA (2011) Detection of Diseases on Cotton Leaves and its Possible Diagnosis. International Journal of Image Processing5(5): 590-598.
- Bashish DA, Braik M, Baniahmad S(2011) Detection and Classification of Leaf Diseases using K-means-based Segmentation and Neural-networks-based Classification. Information Technology Journal 10(2):267-275.
- Dubey SR, Jalal AS (2015) Apple disease classification using color, texture and shape features from images. Signal Image & Video Processing p. 1-8.
- RevathiP, Hemalatha M(2012) Classification of cotton leaf spot diseases using image processing edge detection techniques. IEEE IntConf Emerging Trends Sci Eng Technol pp. 169-173.
- Barbedo JGA (2013) Digital image processing techniques for detecting, quantifying and classifying plant diseases. SpringerPlus 2(1):660-666.
- Gui J, Hao L, Zhang Q (2015 ) A New Method for Soybean Leaf Disease Detection Based on Modified Salient Region. International Journal of Multimedia & Ubiquitous Engineering 10(6):45-52.
- Wang H, Li G, Ma Z (2012) Image recognition of plant diseases based on principal component analysis and neural networks. IEEE International Conference on Natural Computation p.246-251.
- Baum T, Navarro-Quezada A, Knogge W(2011)HyphArea-Automated analysis of spatiotemporal fungal patterns. Journal of Plant Physiology 168(1SI):72-78.
- Yasue Mitsukura K. S. H. F (2012) Color Feature Extraction of Regions by Means of GA for Scenery Image Retrieval. Electronics and Communications in Japan 95(02): 710-719.
- JieTian QHXM (2012) An Improved KPCA/GA-SVM Classification Model for Plant Leaf Disease Recognition. Journal of Computational Information Systems18(8): 7737-7745.
- Rupali Patil SUSM(2016) Grape Leaf Disease Detection Using K-means Clustering Algorithm. International Research Journal of Engineering and Technology3(4): 2395-0072.
- Shi Y, Wang XF, Zhang SW (2015)PNN based crop disease recognition with leaf image features and meteorological data. International Journal of Agricultural and Biological Engineering 8(4):60-68.
- Chung C, Huang K, Chen S (2016) Detecting Bakanae disease in rice seedlings by machine vision. Computers and Electronics in Agriculture121(05): 404-411.
- Omrani E, Khoshnevisan B, Shamshirband S (2014) Potential of radial basis function-based support vector regression for apple disease detection. Measurement55(04): 512-519.
- Zhang Hao P (2013) Study Speech Recognition System Based on Manifold Learning. Applied Mechanics and Materials380(384):3762-3765.
- Qian Y, Ying L, Pingping J (2013) Speech emotion recognition using supervised manifold learning based on all-class and pairwise-class feature extraction. IEEE Conference Anthology.
- Feng G, Hu D, Zhou Z (2008) A Direct Locality Preserving Projections (DLPP) Algorithm for Image Recognition. Neural Processing Letters27(3):247-255.
- Ping H, Wu J, Wu R (2012) SAR Target Feature Extraction and Recognition Based on 2D-DLPP. Physics Procedia 24(8):1431-1436.
- Wei Z, Chu Y, Zhao L (2017) An effective two-dimensional linear discriminant analysis with locality preserving approach for image recognition. Signal, Image and Video Processing11(1):1-8.
- Zhang S, Wang Z (2016) Cucumber disease recognition based on Global-Local Singular value decomposition. Neurocomputing 205:341-348.
- Dong P, Wang X (2013) Recognition of Greenhouse Cucumber Disease Based on Image Processing Technology. Open Journal of Applied Sciences3(1):27-31.


-

Mark E Smith
Bio chemistry
University of Texas Medical Branch, USA -

Lawrence A Presley
Department of Criminal Justice
Liberty University, USA -

Thomas W Miller
Department of Psychiatry
University of Kentucky, USA -

Gjumrakch Aliev
Department of Medicine
Gally International Biomedical Research & Consulting LLC, USA -

Christopher Bryant
Department of Urbanisation and Agricultural
Montreal university, USA -

Robert William Frare
Oral & Maxillofacial Pathology
New York University, USA -

Rudolph Modesto Navari
Gastroenterology and Hepatology
University of Alabama, UK -

Andrew Hague
Department of Medicine
Universities of Bradford, UK -

George Gregory Buttigieg
Maltese College of Obstetrics and Gynaecology, Europe -

Chen-Hsiung Yeh
Oncology
Circulogene Theranostics, England -
.png)
Emilio Bucio-Carrillo
Radiation Chemistry
National University of Mexico, USA -
.jpg)
Casey J Grenier
Analytical Chemistry
Wentworth Institute of Technology, USA -

Hany Atalah
Minimally Invasive Surgery
Mercer University school of Medicine, USA -

Abu-Hussein Muhamad
Pediatric Dentistry
University of Athens , Greece
