


Lupine Publishers Group
Lupine Publishers
ISSN: 2641-6794
Research Article(ISSN: 2641-6794) 
Monitoring Environmental Noise Pollution in X8 Building (International Student Dormitory) Wuhan University of Technology Volume 3 - Issue 1
Received: July 01, 2019; Published: July 10, 2019
Corresponding author: Koricho Hingabu Hordofa, School of Resources and Environmental Engineering, Wuhan University of Technology, China
DOI: 10.32474/OAJESS.2019.02.000155
Introduction
Sound is an important thing our lives such as hearing the birds chirp and the sound of a smoke alarm is a wonderful thing, but the noise is usually referred to unpleasant or unwanted sounds. The industrialization and urbanization have made the world full noise as it is called as noise pollution and a serious environmental issue. Noises like an airplane flying over, train passing through living houses, honking cars, loud music, construction and a barking dog etc. are considered as noise pollution. According to the World Health Organization levels of noise pollution in some cities present danger and are seriously harming human health and activity. Noise pollution can cause several health conditions the two most common among them being hearing loss and tinnitus. Noise pollution and its effect on human health has got great concern specially in modern cities and welfare for this issue is recently considered as an important and vital issue to be solved. Scientists and interested agencies all over the world, such as World Health Organization (WHO) trying to conduct more researches concerning assessment of its levels and harmful effects [1-4]. Levels of environmental noise pollution increase rapidly with the progress of years due to the rapid increase in human activities such as transportation, industrialization, and urbanization [5,6]. Other researches have been conducted in several cities of the world to study the bad effects of environmental noise pollution on the human’s health, comfort, and welfare [7-9]. Recently small researches are being conducted for living areas and trying to overcome the solutions. More deep researches are required in every living area. This study was conducted to assess the noise pollution for the International student dormitory. Study was conducted with proper instrument. So, the most typical reason for measuring noise pollution was in response to a specific nuisance issue, relating to traffic and others near to a residential area. The second reason was to conduct noise monitoring study and to provide data to know how harmful it is to the students and report was sent to teachers to control the conditions.
Study Area
X8 Building is international student dormitory, Students of around the world are living here. This building has 8 floors and almost around 115 international students are living in the building. Within the x8 building, some staggering statistics exist for people affected by various forms of noise. Students/people are exposed to environmental noise causing annoyance and disturbance of sleep. The majority students living in x8 building are exposed today and night-time noise levels exceeding.
Sources of Noise Pollution in X8 Building
Sources of noise pollution in x8 building are numerous but the major source is traffic and construction sites. In particular, predicting noise from construction sites but lists a number of factors which might affect the acceptability of noise and vibration from construction sites. Where construction work continues day and night.
Research Methodology
Equipment
The equipment for data collection was used, namely, Sound level meter (Figure 1). The specification of this equipment (TES 1350A, RANGE:LOW 35-100dB, High 65-130dB, Response: S (slow response for continues stable noise) and F (Fast response for rapid changing noise) Max hold: Maximent , Function: A ( A: weight of human feelings), C (C: Machine reading), CAL 94dB (calibration), Usage:RH〈90% ,0-40 ℃ \.
Figure 1: Sound level meter equipment.

Method
The following methods were used for the data collection
A. Identifying floors with a building and selecting noise measurement and modeled
B. Receiver data and locations.
C. Analysis and calculation of the data.
D. Noise prediction methods.
Criteria and degree of the noise impact
According to Noise criterion (Engineering ToolBox, (2004). NC), Noise pollution has different levels (Table 1)
Table 1: Criteria and degree of the noise impact.

Calculation
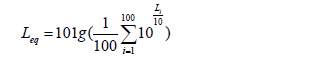
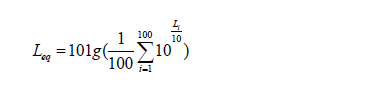
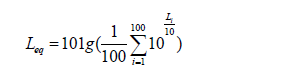
Before starting and calculating equivalent continuous sound level the group was calculated the noise standard deviation according to standard deviation formula. Based to that the below is the standard deviation of study area noise pollution.
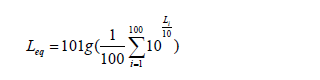
Where: Li = the number of populations
L = arithmetical average
N= Data size
Results and Discussion
Analysis of data
The noise levels were calculated (Table 2), assessment was done because of noise impacts associated with the construction and traffic around the study area. Results shows that noise levels are above the criteria (Table 1), the degree of the impact can be summarized below in Table 2 (based on Institute of Environmental Management and Assessment and Institute of Acoustics Consultation Draft Guidelines for Noise Impacts Assessment - April 2002).
Table 2: Analysis of noise level.

Data processing
The data processing was followed as monitoring equivalent continuous sound level and Standard deviation. Data collection and processing methods were as follow.
A. Rearrange that 100 data from the high to low
B. The 10th data as L10, 50th data L50, 90th data L90.
C. L10: Above 90% of data is 69.79633333 the average peak noise
D. L50: Above 50% of data is 23.64033333 the average noise
E. L90:Above 10% of data is 15.09833333 the initial or low noise
Traffic noise pollution
Traffic noise around study area is becoming a bigger issue with the rapid expansion of infrastructure in roadside. Some of the most intrusive noises are associated with major roads during rush hour. However, for any environmental noise survey, traffic noise is generally less disturbing than industrial or leisure noise as it is typically traffic which defines the background noise for assessing noise pollution.
The standard deviation is 1.579
After calculation of standard deviation according to the formula, based to that, the following results are calculated and it shows that Noise level is exceeding the limits (Figures 2 & 3).
Figure 2: Equivalent of sound level of 10th, 50th and 90th.

Figure 3: Sound level in different equivalent.

Equivalent of 10th sound level is 69.796
Equivalent of 50th sound level is 23.607
Equivalent of 90th sound level is 15.098
It is also predicted that increase of traffic volume is not necessarily directly correlate to an increase in noise pollution. However, when the road is so busy that traffic begins to slow-down or even stop consequently noise levels will typically go down and vary less [10].
Conclusion and Recommendation
International student’s dormitory named as x8 dormitory was analyzed for noise pollution. The equipment which was used to measure noise pollution was noise meter. Three floors were selected for sampling, (i.e 8th, 6th and 3rd.) According to the above results within a building, the 8th floor is more affected by traffic and construction noise. The group members of this survey recommended that because of the building is found adjacent to the roadside; the traffic noise is very high especially in the night time, so it affects the residents’ life. The building should surround a high wall or something that should stop the traffic noise.
Supplementary Data
References
- Amrutha Preethi P, Sravani M, Ashok Kumar M, Sowmya P, Naga Siva p, et al. (2016) Noise Pollution and Its Impact on Human Health and Social Behavior using Systems Approach-A Case Study in Kurnool City. Civil and Environmental Research 8(7): 70-80.
- Mahmoud F El-Sharkawy, Ali SR Alsubaie (2016) Study of Environmental Noise Pollution in the University of Dammam Campus. Saudi Journal of Medicine & Medical Science 2(3): 178-184.
- Pirrera S, De Valck E, Cluydts R (2010) Nocturnal road traffic Noise: A review on its assessment and consequences on sleep and health. Environ Int 36(5): 492-498.
- World Health Organization (WHO) (1990) Indoor Environment: Health Aspects of Air Quality, Thermal Environment. Light and Noise, Geneva, Switzerland.
- Hunashal RB, Patil YB (2012) Assessment of noise pollution indices in the city of Kolhapur, India. Procedia Soc Behav Sci 37: 448-457.
- Pathak V, Tripathi BD, Mishra VK (2008) Evaluation of traffic noise pollution and attitudes of exposed individuals in working place. Atmos Environ 42(16): 3892-3898.
- Alberola J, Flindell H, Bullmore J (2005) Variability in road traffic noise levels. European Commission, environmental noise directive 2002/49/ EC; Off. J Eur Communities 189: 12-25.
- Bhosale BJ, Late A, Nalawade PM, Chavan SP, Mule MB (2010) Studies on assessment of traffic noise level in Aurangabad city, India. Noise Health 12(48):195-198.
- Vidya Sagar T, Nageswara Rao G (2006) Noise pollution levels in Visakhapatnam City (India). J Environ Sci Eng 48(2): 139-134.
- Engineering ToolBox (2004) NC - Noise Criterion.


-

Mark E Smith
Bio chemistry
University of Texas Medical Branch, USA -

Lawrence A Presley
Department of Criminal Justice
Liberty University, USA -

Thomas W Miller
Department of Psychiatry
University of Kentucky, USA -

Gjumrakch Aliev
Department of Medicine
Gally International Biomedical Research & Consulting LLC, USA -

Christopher Bryant
Department of Urbanisation and Agricultural
Montreal university, USA -

Robert William Frare
Oral & Maxillofacial Pathology
New York University, USA -

Rudolph Modesto Navari
Gastroenterology and Hepatology
University of Alabama, UK -

Andrew Hague
Department of Medicine
Universities of Bradford, UK -

George Gregory Buttigieg
Maltese College of Obstetrics and Gynaecology, Europe -

Chen-Hsiung Yeh
Oncology
Circulogene Theranostics, England -
.png)
Emilio Bucio-Carrillo
Radiation Chemistry
National University of Mexico, USA -
.jpg)
Casey J Grenier
Analytical Chemistry
Wentworth Institute of Technology, USA -

Hany Atalah
Minimally Invasive Surgery
Mercer University school of Medicine, USA -

Abu-Hussein Muhamad
Pediatric Dentistry
University of Athens , Greece
