


Lupine Publishers Group
Lupine Publishers
ISSN: 2641-6794
Review Article(ISSN: 2641-6794) 
Improving Quality of Water Using Natural Nano-Clay Composites: Isotherms Describing Water Purification Using Fe-Montmorillonite from Chelel, Kapchorwa in Uganda Volume 3 - Issue 3
Received: July 24, 2019; Published: August 08, 2019
Corresponding author: Mukasa Tebandeke IZ, Chemistry Department, School of Physical Sciences, College of Natural Sciences, Makerere University, Uganda
DOI: 10.32474/OAJESS.2019.03.000164
Abstract
Pollution resulting from increased human activities is threatening Lake Victoria, its effects are characterized by high turbidity, pH, iron (II) concentration, chemical oxygen demand (COD) and eutrophication. The performance of Fe-montmorillonite as low cost adsorbent for purifying water was studied. The batch technique was used in which Murchison Bay (MB) water was mixed with varying amounts of clay and stirred at 80rpm for 10 minutes at ambient temperature; filtered through what man paper and the filtrate was used to determine residual COD, Fe, TN and TP. The optimum concentration of clay of 0.4gl-1 was observed to produce 73.5+2% fall in COD as microbes and organic waste was removed. The concentration of iron (II) fell from 3.7+0.3 to 2.5+ 0.2 predicting removal of heavy metal by the clays. The data accumulated was analyzed using Freundlich, Langmuir and Temkin isotherms. The isotherms best described the results because the R2 values were very high. The Langmuir constant KL related to adsorption capacity of clay varied from 0.436 to 12.996 for removal of ions of iron; 0.068 to 1.161 for nitrate ions; 0.365 to 1.7295 for phosphate ions and 0.912 to 0.989 for removal of COD reducing agents. The Freundlich exponential constant, n, characterizing energetic heterogeneity of the clay surface varied from 0.059 to 0.714 for removal of ions of iron; 0.997 to 1.083 adsorption and /or exchange of nitrate ions; 0.339 to 1.582 for removal of COD reducing agents. The Temkin constant BT varied from 6.1582 to 21.025 for the nitrate, from 2.64 to 43.42 for adsorption of iron and 26.24 to 65.38 for removal of COD reducing agents. So, Femontmorillonite can remove organic and inorganic pollutants from MB waters. There is need to investigate the effectiveness of acid- and alkali-leached clay on MB water as well as kinetic study on removal of impurities from the water.
Keywords:Pollution; isotherms; Freundlich constants; Langmuir constants; COD; Total phosphate
Introduction
Lake Victoria is Africa’s largest freshwater resource covering about 68,800 km2, shared between Uganda, Kenya and Tanzania. Its shoreline is composed of gulfs and bays that receive municipal and industrial wastes from adjacent urban centers. Murchison Bay (MB) is located at north-western part of Lake Victoria is affected by flooding and pollution (Hecky et al. 2010; Scheren et al. 2000). Man’s inventions and advancements have come with pollution problems facing lakes, oceans and rivers; and the pollution problems can only be amended after exploring how they arose using naturally occurring materials (Jiang et al, 2006). A watershed is landing that water flows across or through on its way to a common stream, lake or river. It can be a drainage basin or an area where all water flowing in goes to a common outlet like the estuary or reservoir. Unhealthy watersheds affect wildlife, is harmful to man, affects aquatic life, offsets change in the ecosystems. It was further reported that heavy metals readily adsorb on clay particles thus alleviating pollution [1,2]. Fresh water ecosystems are linked to watersheds tightly, but this is influenced by man [3]. Algae blooms from fertilizer runoff during rain harm the watershed health; but nutrients can be got rid of by using clays [4]. MB watershed is located at northwestern part of Lake Victoria is affected by flooding and pollution [5,6]. Increased agricultural practices around near rivers draining in MB have led to increased sediment and nutrient loading in the watershed and consequently to the lake through non-point source pollution [7]. Persistent outbreak of algal blooms in the MB and increased mass occurrences of cyanobacteria was reported to be caused by increased nutrient pollution [8,9]. The quality of water in MB was shown to be influenced by nutrients loading in runoff from the catchment and population centers upstream [10]. MB is heavily eutrophic, and nitrogen, N was reported to be the limiting nutrient [11]. The quality of water deteriorated exponentially in the period 2001–2014 due to increased pollution and the high residence time of water. The worst water quality was in 2010 when diffuse pollution intensified due to the lining of more drainage channels within Kampala City in addition to the declining wetland effect [12]. The development of urban centers in Kampala involved removing plants, changing surface topography and altering natural water drainage networks. This affected the MB watershed. In addition, manmade land covers like tarmacked roads and buildings act as fast lanes for rainwater. Rainwater which would be absorbed by soil and plants is sent directly to streams and rivers, thus increasing chances of flooding of MB because more water pools form in the area than would reach if nature was still restricting its flow.
Organic pollutants include pesticides, fertilizers, hydrocarbons, phenols, plasticizers, biphenyls, detergents, oils, greases, pharmaceuticals, proteins and carbohydrates [13-15]. Toxic organic pollutants cause several environmental problems to our environment. The persistent organic pollutants (POPs) cause environmental problems due to their toxicity, persistence, longrange transport ability [16] and bioaccumulation in animals [17], travel long distances and persist in living organisms. Highly toxic organic compounds can be removed from polluted water and wastewater using methods like coagulation, filtration with coagulation, precipitation, ozonation, adsorption, ion exchange, reverse osmosis and advanced oxidation processes but are expensive. Cheap adsorbents ranging from agricultural waste to industrial by-products may be used to remove pollutants from water after being studied. Natural adsorbents are cheap and readily available but may have less adsorptive capacity than synthetic ion exchangers, pillared clays or activated carbons. Different clays have been explored for the removal of heavy metals from water and wastewater; and have been shown to possess high adsorption and ion-exchange capacities, low permeability, swelling ability, chemical and mechanical stability, and large specific surface area. The adsorption of many pollutants from water is influenced by pH, temperature, the presence of other compounds and initial concentration. The pH of the solution is critical in the adsorption of heavy metals to clays because the surface charge of the clay minerals varies with pH. The pH also influences the solution chemistry of metal ions because precipitation, hydrolysis, complexation and redox reactions are pH dependent. Thus, within limits of pH, adsorption of certain ions increases with increase in pH (Dos Santos et al. 2015). Depending on the structure of clay minerals, the temperature may have an impact on its adsorptive capacity, because the process of adsorption may be physical or chemical. Physisorption is retarded by increasing temperature yet chemisorption is accelerated by increase in temperature. The impact of temperature on the adsorption of metal ions on natural and activated bentonite at a certain pH was reported [17- 23]. Montmorillonite was reported to be a good adsorbent for phosphate and arsenate (V) ions from water and wastewater [24- 27] due to its surface characteristic and cation exchange capacity. The adsorption characteristics of phenol, 2,4,6-trichlorophenol and atrazine on humic acid–carbon hybrid materials was found to be independent of ionic strength and the kinetic data were fitted to Elovich equation and intra-particle diffusion models yet the equilibrium data fitted the Langmuir isotherm better than Freundlich [28]. The removal of nitrate ions by adsorbing to local clay in batch experiments yielded data that fitted the Freundlich isotherm model with the rate of reaction following pseudo-secondorder kinetics and the adsorption yield increases with adsorbent dose and decrease with initial concentration of nitrate [29]. Clays are abundant and they present excellent physicochemical stability and structural and surface properties.
Distribution of 137Cs and stable cesium between aqueous solution and near-surface soil samples from five locations at the Savannah river site was reported to have shown that sorbed cesium was related to the equilibrium aqueous cesium concentrations by a Freundlich isotherm model [30]. The results on the general mechanism of Sb(V) retention, adsorption intensity, and capacity revealed that the antimonite (V) ion adsorption by clays decreased with increasing pH and obeyed the adsorption isotherms described by the Freundlich and the one- or two-site Langmuir models. The adsorption of Sb(V) by aluminol (≡AlOH) groups on gibbsite and kaolinite was divided in high intensity–low capacity and low intensity–high capacity components [31]. The feasibility of kaolinite used as a low-cost adsorbent for the removal of Pb(II), Zn(II) and Cu(II) from aqueous solutions was investigated and it is concluded that kaolinite can be used as an effective adsorbent for removing Pb(II), Zn(II) and Cu(II) from aqueous solutions [32]. The adsorption of hazardous chemicals from industries was reported to be the most efficient method of overcoming pollution of soil and water when combined wastewater of sugar industry was treated with different zeolite doses to decrease biochemical oxygen demand [33].
Adsorption isotherms are mathematical models describing the distribution of the adsorbate space on the adsorbent medium. The formulation of the isotherms may assume hetero- or homogeneity of the adsorbent surface; monolayer or multi-layer coverage of surface with or without possibility of interaction between free and adsorbed species when equilibrium is attained. The application of the Langmuir equation assumes that the adsorption site is homogeneous, with each site accommodating one molecule or one atom; the adsorption is monolayer coverage, and there is no interaction among adsorbed molecules (Hu et al. 2007). Meanwhile, the Freundlich isotherm describes equilibrium on a heterogeneous surface where energy of the adsorption was not equivalent for all adsorption sites, thus allowing multi-layer adsorption.
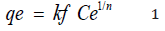
The Freundlich isotherm is;
Its logarithms are given as follows;
n is Freundlich exponential constant and kf is Freundlich proportional constant; qe is amount of impurity adsorbed per unit mass of clay, Ce is equilibrium concentration of impurities.
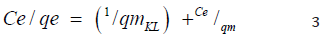
The Langmuir isotherm is given in equation 3
Where, qe is amount of solute adsorbed per unit weight of adsorbent and Ce is equilibrium concentration of the solute, KL is Langmuir constant related to adsorption capacity. The plot of Ce/qe versus Ce/qm gives line graph with slope equivalent KL.
The Temkin isotherm equation assumes the heat of adsorption of all species in layer decreases linearly with coverage due to adsorbent-adsorbate interactions and adsorption is characterized by uniform distribution of bonding energies up to some maximum binding energy [34]. The isotherm is given as follows;
The linearized form of equation 4 is given as follows;
s 5
Where T is absolute temperature, R is universal gas constant, KT is the equilibrium constant and BT is the variation of energy of adsorption. Plot of qe versus lnCe give line graph with slope equivalent to KT.
Materials and Methods
Study Area
The Murchison bay is located to the south of Kampala. It lies in the watershed for Nakivubo channel which drains much of the Kampala areas shown in Figure 1.
Figure 1: Map of Kampala showing location of Murchison bay (source of water used for study).

Sampling of Water
Samples of water (2L) were drawn into plastic bottles, sealed, packed freeze box and transported to the laboratory in Makerere University, where they were stored in a freezer at 4oC for future use. The water used in the study was collected at 0, 50, 100,150 and 200m in the bay south of river Nakivubo. The most important task of water quality analysis is sampling [35]. Water was sampled in brown reagent bottles that had been prewashed with nitric acid, detergent and rinsed with distilled water several times. A total of 10 samples were collected for analysis. The samples were tightly caped and placed in a cool box immediately. They were then transported to the laboratory, and then filtered using Whatman filter papers to avoid interference due to turbidity and color. The samples were then kept in a refrigerator at a temperature below 4oC.
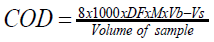
Determination of COD
The quantity of potassium dichromate (VI) used in the reaction is equivalent to the oxygen used to oxidize organic matter in water. COD test is commonly used to indirectly measure the amount of organic compounds in water.
Preparation of Potassium Dichromate (VI) Solution
Potassium dichromate (VI) (6.13g) previously dried at 105oC for two hours was weighed to 1000mL volumetric flask, water (800mL) was added, the mixture shaken, and solution formed was made up to mark with distilled water.
Preparation of Silver(I) Sulfate-Sulfuric Acid Solution
Silver (I) sulfate (10g) was dissolved in sulfuric acid solution (500mL). The mixture was swirled and made up to 1L and allowed to stand for 24 hours before being used.
Preparation of Mercury (II) Sulfate-Sulfuric Acid Solution
Mercury (II) sulfate (0.1g) was dissolved in concentrated sulfuric acid (5mL).
Preparation of 0.025M ammonium Iron (II) sulfate solution
Ammonium iron (II) sulfate (9.8g) was dissolved in distilled water (100mL) and concentrated sulfuric acid (20mL) was added. The mixture was allowed to cool and later made up to 1L with distilled water.
Preparation of Ferroin Indicator
Iron (II) sulfate -7-water crystals (3.5g) and phenanthroline- 1-water (7.5g) was dissolved in distilled water (400mL) and thoroughly mixed, the solution was made up to 500mL using distilled water.
Performing COD Test
To sample (10mL) in a reaction flask was added glass beads followed by mercury (II) sulfate solution (1mL), then added potassium dichromate (VI) solution with continuous swirling, then slowly added silver (I) sulfate-sulfuric acid solution (15mL). Refluxing apparatus was setup and the mixture were digested over a hotplate for two hours, then cooled. The inside of flask and condenser was rinsed with distilled water (25mL) and solution added to flask. Ferroin indicator (2drops) was added to mixture in flask and titrated with 0.025M ammonium iron (II) sulfate solution to blue end point, Vs. A blank titre on distilled water was also carried out in the same way as was done on sample of water from the bay, Vb
Where DF is dilution factor if applied; M is molarity of ammonium iron (II) sulfate solution; Vb is volume consume by blank and Vs is volume consumed by sample. COD is milligrams per liter or ppm.
Preparation of Phosphate Standards
The standards were prepared according to the standard methods for the examination of water and Wastewater (APHA, 1999). 1000 ppm of standard phosphate solution was prepared by weighing analytical grade potassium dihydrogen orthophosphate (1.4329g) and diluting to 1000 ml in a standard volumetric flask using distilled water. In the preparation of 1, 2, 3, 4, 5, 6, ppm solution the standard phosphate solution (0.1 ml, 0.2 ml, 0.3 ml, 0.4 ml, 0.5 ml and 0.6 ml) were respectively diluted to 100 ml with distilled water.
Preparation of Combined Reagent
5N sulfuric acid was prepared by measuring 98% concentrated sulfuric acid(14mL) into a 100 ml volumetric flask and diluting to the mark with distilled water. Potassium antimonyl tartrate (0.2742g) was accurately weighed into a 100 ml volumetric flask and diluted with distilled water to the mark. 4g of ammonium molybdate was weighed and put into a 100 ml volumetric flask and 1.76 g of ascorbic acid in 100 ml. To prepare the combined reagent, 5N sulfuric acid (50mL), potassium antimonyl tartrate solution (5mL), ammonium molybdate solution (15mL), and ascorbic acid solution (30mL) was measured into a 100 ml volumetric flask.
Analysis for Phosphate Ions
Each of the standards (10mL), blank 10mL) and samples (10mL) were measured into a test tube. 2 ml of combined reagent(2mL) were added to the standards, blanks and samples. Phenolphthalein indicator (1 drop) was added to the solutions upon which pink color developed and 5N sulfuric acid was added drop wise to discharge the color. Time (10 minutes) was allowed to elapse, after which absorbance of each solution was measured at 880 nm on a UV-VIS spectrophotometer.
Preparation of Clays
Raw samples of clays were separately soaked in distilled water, sieved to pass through a mesh of 5.3 x 10⁻⁴ m diameter, dried at 105oC and ground to powder using a rolling mill. The clay powders will be stored for future use.
Determination of Iron in Water
The Odyssey spectrophotometer Hach DR 2500 was used.
Part I: Preparation of Standard Solution: Volumetric flasks were labeled: 0 ppm, 1.0 ppm, 2.0 ppm, 4.0 ppm, 6.0 ppm. Using a pipette 0.0 mL, 1.0 mL, 2.0 mL, 4.0 mL, and 6.0 mL of the 100 ppm of Fe2+ solution was added to the appropriate flasks. 0.25% ortho-phenanthroline solution (5ml) was added to each flask. Then distilled water was used to make each solution to 100.0 mL mark. Each of the solutions made was used to record the absorbance.
Part II: Forming the Standard Curve: The spectrophotometer was warmed up for 20 minutes. The wavelength was adjusted to 510 nm. The cuvette containing the blank (0 ppm) was inserted in spectrophotometer. Then the cuvette containing the sample was put in the sample compartment with the triangle on the cuvette facing the front of the instrument. The lid was closed. The absorbance of water was recorded, and the cuvette removed from the instrument. The cuvette containing sample (1.0 ppm) inserted. The lid was closed. Absorbance of sample was recorded. Absorbance for each of the other standard solutions was recorded following similar steps. The data obtained was used to plot calibration curve.
Part III: Preparation and Analysis of the Unknown: Test sample of water (5mL) was put in volumetric flask. 0.25% ortho-phenanthroline solution (5mL) was added to the same flask and mixture made up 100mL mark with distilled water. A cuvette was filled with mixture made. The cuvette was placed in the spectrophotometer and absorbance of solution recorded. Absorbance of other test samples were similarly recorded.
Total nitrate in water
A known volume (50mL) of the sample was pipetted into a porcelain dish and evaporated to dryness on a hot water bath. Phenol disulphonic acid (2mL) was added to dissolve the residue by constant stirring with a glass rod. Concentrated solution of sodium hydroxide and distilled water was added with stirring to make it alkaline. The solution was filtered in a tube and made up with distilled water(48mL). The absorbance was read at 410nm using a spectrophotometer after the development of colour.
Adsorption Experiment
Clay powder of known mass (0.05g) was added to MB water (200mL) in a flask containing magnet in plastic. The mixture was mounted over magnetic stirrer rotating at 80rpm for 10minutes. At end of 10-minute stirring duration, the mixture was filtered through Whatman filter paper and filtrate stored for further analyses. The experiment was repeated thrice.
Results and Discussion
Clay characterization
Basing on elemental and mineralogical compositions as well as X-ray and infra-red spectra patterns published earlier, the clay from Chelel satisfied the formulae
(½Ca,Na)0.33(Mg,Fe+2)3(Si,Al)4O10(OH)2·4H2O and Ca.5(Si7Al.8Fe.2) (Fe,3.5Al.4Mg.1)O20 (OH)4 and was named nontronite or Femontmorillonite [36-38]. The parameters like adsorbent dosage, temperature, contact duration, agitator speed was reported to be useful in adsorption experiments. So, the water-clay mixtures were stirred for equal times at room temperature of 28+ 0.2oC to equilibrium. The equilibrium data have been analyzed using Freundlich, Langmuir and Temkin isotherms.
Characterization of Murchison bay waters
The parameters used to assert whether a water resource is safe or polluted include chemical oxygen demand (COD), biological oxygen demand (BOD), pH, turbidity, concentration of iron (II), total suspended solids (TSS), nutrient concentration and others. Of these parameters, Murchison bay waters sampled on 14th December, 2018 showed COD ranging from to 78 to 52mgl-1, pH ranging from 7.6 to 6.8; iron (II) concentration ranging from 3.8 to 3.4mgl-1; TP ranged from 0.25 to 0.22mgL-1 yet TN ranged from 59 to 25mgL-1 in a distance ranging from 0m to 200m into the bay. This revealed the impurities were dispersing as we moved towards the lake. The permissible published parameters of safe fresh water sources are as follows; COD 10.0mgl-1, turbidity 5NTU, pH range of 5-9 and iron (II) concentration of 2.0mgl-1 [39]. Basing published parameters of water, the MB waters can be declared polluted.
Effect of Clay on COD and Development of Isotherms of Adsorption
The data showed very sharp fall in COD as concentration of clay increased from 0.0 to 0.4 gL-1 due more pronounced adsorptive tendencies for the inorganic and organic pollutants on clay minerals as well as neutralization of electrostatic charges on suspended particles in MB waters by the clay composites leading to flocculation. So, filtration of the water after interacting with clays eliminated almost all oxidizable matter in clarified water from MB. The percentage decrease in COD was plotted in Figure 6 and it showed that fall in COD increased with increase in concentration of clay used. Beyond 0.4g/L, the decrease in COD remained fairly constant Figure 2.
Figure 2: Plot of percentage fall in COD versus concentration of clay.

The rate of decrease in COD was rapid at low concentration of clay then became gradual at higher concentrations. In the low concentration range, the rapid fall was due to presence of large number of vacant sites leading to increased concentration gradient between the adsorbate in solution and the adsorbent surface. The percentage decrease in COD indicated that the clay used worked well, efficiency greater than 73%. The Langmuir isotherms were plotted using data on COD as shown in Figures 3a to 3f.
Figure 3a: Effect of clay on COD at clay concentration of 0.2g/L.

Figure 3b: Effect of clay on COD at clay concentration of 0.4g/L.

Figure 3c: Effect of clay on COD at clay concentration of 0.6/L.

Figure 3d: Effect of clay on COD at clay concentration of 0.8g/L.

Figure 3e: Effect of clay on COD at clay concentration of 1.0g/L.

Figure 3f: Effect of clay on COD at clay concentration of 1.2g/L.

For COD; the linearized Langmuir isotherms were as follows;
At 0.2g/L clay concentration, Ce/qe = 0.0468Ce/qm + 1.0212, R² = 0.9199 KL=0.979.
At 0.4g/L clay concentration, Ce/qe = 0.0033Ce/qm + 0.8189, R² = 0.9858 KL=1.221.
At 0.6g/L clay concentration, Ce/qe = 0.004Ce/qm + 0.5082, R² = 0.9401, KL=1.968.
At 0.8g/L clay concentration, Ce/qe = 0.0038Ce/qm + 0.3674, R² = 0.9898, KL=2.722.
At 1.0g/L clay concentration, Ce/qe = 0.0045Ce/qm + 0.2632, R² = 0.965, KL = 3.799.
At 1.2g/L clay concentration, Ce/qe = 0.0047Ce/qm + 0.2085, R² = 0.9124, KL=4.796.
The linear equations above are valid basing on the following assumptions; There occurs deal localized monolayer adsorption. The molecules are adsorbed at definite sites on the surface of the adsorbent. Each site can accommodate only one molecule. The area of each site is a fixed quantity determine solely by the geometry of the surface. The adsorption energy is the same at all the sites. Such behavior on the basis of kinetic consideration, presuming that the adsorbed molecules cannot migrate across the surface and/ or interact with other neighboring molecules. Once the situation is non ideal, deviations occur. The Langmuir constant, KL, related to adsorption capacity for removal of COD reducing agents in MB waters varied from 0.979 to 3.799 revealing the capacity of the clay at adsorbing COD reducing agent was very high at all clay concentrations used in this study. The coefficients of linearity for removal of COD ranged from 0.912 to 0.989 indicating possibility of deviation from monolayer coverage or/and interaction between species that were adsorbed to neighboring sites on the clay surface. However, the degree of linearity displayed in isotherms drawn using data on COD was very high revealing the Langmuir isotherms were valid for the wide range of concentrations of COD in MB waters studied.
Effect of Clay Dosage on TP and Development of Adsorption Isotherms
The data obtained on variation of concentration of phosphate ions in MB with concentration of clay used was plotted in Figure 9. The results in Figure 9 have revealed that effective binding of phosphate ions on clay as well neutralization of electrostatic charges on particles took place with the clay concentration range of 0.0 to 0.4gl-1 because it is within this range of concentrations that the concentration of phosphate ions fell greatly. Analysis of phosphates could be improved by applying the high point standard method which prevent the interference due to silicates based on the rates of reactions between the phosphate and silicates. The rate of decrease in concentration of the phosphate was rapid at low concentration of clay then became gradual at higher concentrations. In the low concentration range, the rapid fall was due to presence of large number of vacant sites leading to increased concentration gradient between the adsorbate in solution and the adsorbent surface. The Langmuir isotherms were plotted using data on total phosphate concentrations as shown in Figures 4. The linearized isotherms obtained are shown in Figures 4 for the adsorption of phosphate ion of Fe-montmorillonite (Figures 5a-5f).
Figure 4: Plot percentage decrease in TP versus clay concentration.

Figure 5a: Effect of clay on TP at clay concentration of 0.2g/L.

Figure 5b: Effect of clay on TP at clay concentration of 0.4g/L.

Figure 5c: Effect of clay on TP at clay concentration of 0.6g/L.

Figure 5d: Effect of clay on TP at clay concentration of 0.8g/L

Figure 5e: Effect of clay on TP at clay concentration of 1.0g/L.

Figure 5f: Effect of clay on TP at clay concentration of 1.2g/L.

For TP;
At 0.2g/L clay concentration, Ce/qe =251.53Ce/qm - 28.621, R² = 0.7914 KL= 03065
At 0.4g/L clay concentration, Ce/qe =4.5288Ce/qm + 1.6992, R² = 0.8251 KL=0.5885
At 0.6g/L clay concentration, Ce/qe =2.15Ce/qm + 1.1694, R² = 0.9912 KL=0.855
At 0.8g/L clay concentration, Ce/qe =15.4Ce/qm - 0.8283, R² = 0.8363 KL=1.207
At 1.0g/L clay concentration, Ce/qe =11.9Ce/qm - 0.5782, R² = 0.996 KL=1.7295
At 1.2g/L clay concentration, Ce/qe =-21.119Ce/qm + 2.7399, R² = 0.937, KL =0.365
Figure 6: plot of percentage decrease in concentration of iron versus clay concentration.

As Langmuir isotherms assume monolayer coverage and the area of each site is determined solely by the geometry of the surface. The adsorption energy is the same at all the sites. Such behavior on the basis of kinetic consideration, presuming that the adsorbed molecules cannot migrate across the surface and/or interact with other neighboring molecules. Once the adsorption surface is non ideal, deviations occur. The coefficients of linearity for adsorption or/and exchange of phosphate ions ranged from 0.7914 to 0.996 indicating possibility of deviation from monolayer coverage or/and interaction between species that were adsorbed to neighboring sites on the clay surface. However, the degree of linearity displayed in isotherms drawn using data on phosphate ions was fairly high revealing the Langmuir isotherms were more valid at higher clay concentrations than at low. The Langmuir constant, KL, related to adsorption capacity of phosphate ions in MB waters varied from 0.365 to 1.7295 revealing the capacity of the Fe-montmorillonite to adsorb iron was moderate at most clay concentrations.
Variation of Iron in Clarified MB Water and Development of Isotherms of Adsorption
There was a sharp decrease in concentration of iron (II) ions when the concentration of clay increased from 0.0 to 0.4gl-1 probably because within this concentration range the clay would effectively adsorb the iron (II) ions on its surface. So, rendering the MB waters safer for animal health. Increase in concentration of clay used beyond 0.4gl-1 yielded less significant changes in concentration of iron(II) ions in the water probably because effective ion-exchange between the clay and iron(II) in water had already occurred or the electrostatic charges on clay and those on pollutants in MB water had reached the highest possible. The rate of decrease in concentration of iron was rapid at low concentration of clay then became gradual at higher concentrations. In the low concentration range, the rapid fall was due to presence of large number of vacant sites leading to increased concentration gradient between the adsorbate in solution and the adsorbent surface. The Langmuir isotherms for the adsorption of iron were plotted using data as shown in Figures 7a-7f.
Figure 7a: Effect on iron at 0.2g/L clay concentration.

Figure 7b: Effect on iron at 0.4g/L clay concentration.

Figure 7c: Effect on iron at 0.6g/L clay concentration.

Figure 7d: Effect on iron at 0.8g/L clay concentration.

Figure 7e: Effect on Fe at 1.0g/L clay concentration.

Figure 7f: Effect on iron at 1.2g/L clay concentration.

For iron adsorbed, the linearized isotherms, constants and the coefficients obtained are as shown below;
At 0.2g/L clay concentration, Ce/qe =0.224Ce/qm - 0.349, R² = 0.9849 KL=2.865.
At 0.4g/L clay concentration, Ce/qe =0.4Ce/qm – 4x10-13, R² = 1 KL=-12.998.
At 0.6g/L clay concentration, Ce/qe = 0.199Ce/qm + 1.8185, R² = 0.9936 KL=0.5499.
At 0.8g/L clay concentration, Ce/qe = 0.0133Ce/qm + 2.2943, R² = 0.0517 KL=0.436.
At 1.0g/L clay concentration, Ce/qe = 0.2577Ce/qm + 1.0152, R² = 0.0247, KL=0.985.
At 1.2g/L clay concentration, Ce/qe = -0.183Ce/qm + 1.6707, R² = 0.9018, KL = 0.599.
Langmuir isotherms assume monolayer coverage for which the area of adsorption site is depends on geometry of the surface, and the adsorption energy is the same for all sites. Such behavior presumes that the adsorbed molecules cannot migrate across the surface and/or interact with other neighboring molecules. Once the adsorption surface is non ideal, deviations occur. The coefficients of linearity for adsorption or/and exchange of ions of iron ranged from 0.024 to 0.993 indicating deviation from monolayer coverage or/and interaction between species that were adsorbed to neighboring sites on the clay surface. The degree of linearity revealed the Langmuir isotherms would not represent the removal iron from MB waters by Fe-montmorillonite probably due to completion for sites between iron in clay sites and that in the polluted waters. The Langmuir constant, KL, related to adsorption capacity of ions of iron varied from 0.436 to 12.996 revealing the capacity of the Fe-montmorillonite to adsorb iron was moderate at most clay concentrations.
Variation of Nitrate
The results in Figure 8 revealed the was progressive decrease in concentration of nitrate ions in MB waters as concentration of clay increased revealing that the clay effectively adsorbed and or neutralized the charges on the nitrate ions in solution hence improving the quality of water that was clarified. The highest efficiency for removal of nitrate ions from MB water was52% observed at clay concentration of 0.4g/L. The rate of decrease in concentration of the nitrate was rapid at low concentration of clay then became gradual at higher concentrations. In the low concentration range, the rapid fall was due to presence of large number of vacant sites leading to increased concentration gradient between the adsorbate in solution and the adsorbent surface. The data on total nitrate concentration was used to plot Langmuir isotherms in Figures 9a-9f.
Figure 8: Plot of percentage decrease in TN versus clay concentration.

Figure 9a: Effect of clay on TN at 0.2g/L clay concentration.

Figure 9c: Effect of clay on TN at 0.6g/L clay concentration.

Figure 9d: Effect of clay on TN at 0.8g/L clay concentration.

Figure 9e: Effect of clay on TN at 1.0g/L clay concentration.

Figure 9f: Effect of clay on TN at 1.2g/L clay concentration.

For TN, the linearized isotherms obtained are represented by the equations shown below. The constants and coefficients calculated in each case are also presented alongside the equations.
At 0.2g/L clay concentration, Ce/qe = -1.1063Ce/qm + 14.786, R² = 0.9029, KL=0.068
At 0.6g/L clay concentration, Ce/qe = 0.0029Ce/qm + 1.6217, R² = 0.9727, KL=0.617.
At 0.8g/L clay concentration, Ce/qe = 0.0132Ce/qm + 1.0884, R² = 0.9306, KL=0.919.
At 1.0g/L clay concentration, Ce/qe = 0.0104Ce/qm + 0.861, R² = 0.9393, KL=1.161
At 1.2g/L clay concentration, Ce/qe = 0.0103Ce/qm + 0.693, R² = 0.6977, KL =1.443.
Langmuir isotherms assume monolayer coverage with area of each site determined by the geometry of the surface. So, the adsorbed molecules or ions must not migrate across the surface and/or interact with other neighboring molecules or ions. Once the adsorption surface is non ideal, deviations occur. The Langmuir constant, KL, related to adsorption capacity of nitrate ions varied from 0.068 to 1.161 revealing the capacity of the Fe-montmorillonite to adsorb the nitrate was high at most clay concentrations. The coefficients of linearity for adsorption or/and exchange of nitrate ions ranged from 0.697 to 0.972 indicating possibility of deviation from monolayer coverage or/and interaction between nitrate ions that were adsorbed to neighboring sites on the clay surface. However, the degree of linearity displayed in isotherms drawn using data on nitrate ions was fairly high revealing the Langmuir isotherms was highly valid. The deviation from linearity of Langmuir isotherms is attributed to existence of surface sites having multiple adsorption free energies (Srinivasan and Fogler, 1990). The adsorption of impurities in oils may be governed by impurity-oil and impurity-clay surface interactions (Travis and Etnier, 1981). Steric interferences hamper adsorption. The Langmuir isotherms developed using Chelel clay on MB water revealed the adsorption of impurities in polluted water on clays was favorable. Although Langmuir behavior is observed when a straight line is obtained when Ce/qe) is plotted against Ce/qm, this is not definitive proof of a simple, reversible monolayer, chemisorption mechanism. In other words, simply conforming to the Langmuir equation does not constitute absolute proof of the mechanism (Gregg and Sing, 1997).
Freundlich Isotherms
The data on variations in COD were used to plot Freundlich isotherms in Figures 10a-10f. Since the Freundlich isotherms show the adsorptive capacity is a function of the equilibrium concentration of the solute. Therefore, higher capacity is obtained at higher equilibrium concentrations. This suggests the applicability of Freundlich isotherm beyond monolayer coverage of the adsorbate on the outer surface of the adsorbent. The steep gradients of the isotherms indicated that the adsorptive intensity was high at high equilibrium concentration but decreased rapidly at lower concentrations. The coefficients of linearity for adsorption or/and exchange of nitrate ions ranged from 0.924 to 0.993 indicating possibility of multi-layer coverage or/and interaction between impurities that were adsorbed to neighboring sites on the clay surface. So Freundlich isotherms presented the removal of COD from MB water by Fe-montmorillonite in a very good manner. The very high degree of linearity displayed in isotherms drawn using data on COD revealed the Freundlich isotherms were highly valid. For removal of COD, the linearized Freundlich isotherms shown below with constants and coefficients were obtained
Figure 10a: Effect of clay on COD at 0.2g/L clay concentration.

Figure 10b: Effect of clay on COD at 0.4g/L clay concentration.

Figure 10c: Effect of clay on COD at 0.6g/L clay concentration.

Figure 10d: Effect of clay on COD at 0.8g/L clay concentration.

Figure 10e: Effect of clay on COD at 1.0g/L clay concentration.

Figure 10f: Effect of clay on COD at 1.2g/L clay concentration.

At 0.2g/L clay concentration, lnqe = 0.6323lnCe + 2.034, R² = 0.924, 1/n=0.6323, n=1.582 KF =7.645.
At 0.4g/L clay concentration, lnqe= 1.2146lnCe + 1.3757 R² = 0.9996 1/n =1.2146, n=0.823, KF=3.958.
At 0.6g/L clay concentration, lnqe = 2.953lnCe - 3.7186, R² = 0.9496, 1/n =2.953, n=0.339, KF =41.206.
At 0.8g/L clay concentration, lnqe= 1.2677Ce + 0.5354, R² = 0.9926, 1/n =1.2677, n=0.7888, KF =1.708.
At 1.0g/L clay concentration, lnqe= 1.2679lnCe + 0.3166 R² = 0.9882, 1/n =1.2679, n=0.789, KF=1.372.
At 1.2g/L clay concentration, lnqe = 1.2862lnCe + 0.089, R² = 0.9858, 1/n =1.2862, n=0.777 KF=1.093.
The Freundlich equation exponent constant, n, representing the characterizing quasi-Gaussian energetic heterogeneity of the adsorption surface [40]; varied from 0.339 to 1.582 revealing the intensity of adsorption was moderate. The Freundlich constant, KF, indicated the relative adsorption capacity of COD on clay varied from 1.093 to 41.206 showing that the clay had very high tendencies of eliminating COD from MB waters. The Freundlich exponent, n, should have values lying in the range of 1 to 10 for classification as favorable adsorption [41]. The Freundlich model was chosen to estimate the adsorption intensity of the sorbate on the sorbent surface. The data on variations of total nitrogen in water was used to plot Freundlich isotherms in Figures 11a-11f. The Freundlich isotherms on adsorption or/and exchange of nitrate ions in MB water revealed the high adsorptive capacity of Fe-montmorillonite. The steep slope indicated high adsorptive intensity. So, Femontmorillonite can be used to remove nitrate ions from MB water even at higher concentrations, thus lowering the risk from drinking water polluted with nitrate ions from fertilizers used in farms up land to the watershed. For TN, the linearized Freundlich isotherms on MB water are represented by the equations, constants and coefficients given here under;
Figure 11a: Effect on TN at 0.2g/L clay concentration.

Figure 11b: Effect on TN at 0.4g/L clay concentration.

Figure 11c: Effect on TN at 0.6g/L clay concentration.

Figure 11d: Effect on TN at 0.8/L clay concentration.

Figure 11e: Effect on TN at 1.0g/L clay concentration.

Figure 11f: Effect on TN at 1.2g/L clay concentration.

At 0.2g/L clay concentration, lnqe = 0.9251lnCe + 1.6809, R² = 0.9013, 1/n=0.9251, n=1.081, KL =5.370.
At 0.4g/L clay concentration, lnqe = 1.0031lnCe + 0.9098, R² = 1, 1/n=1.0031, n=0.997, KF=2.484.
At 0.6g/L clay concentration, lnqe = 0.9872lnCe + 0.5495, R² = 1, 1/n=0.9872, n= 1.013, KF=1.732
At 0.8g/L clay concentration, lnqe = 0.948lnCe + 0.1496, R² = 0.9928, 1/n=0. 948, n=1.055 KF =1.161.
At 1.0.g/L clay concentration, lnqe= 0.9329lnCe + 0.1884, R² = 0.9938, 1/n=0.9329, n= 1.072, KF= 1.207.
At 1.2g/L clay concentration, lnqe = 0.9231lnCe + 0.0384, R² = 0.99351/n=0.9231, n= 1.083, KF=1.039.
The constant n characterizing quasi-Gaussian energetic heterogeneity of the adsorption surface [40] varied from 0.997 to 1.083 revealing that adsorption and /or exchange of nitrate ions with Chelel clay was favored. As the Freundlich constant indicative, KF, for the nitrate ions varied from 1.039 to 5.370 further revealing that the relative adsorption capacity of the clay was good. The coefficients of linearity, R2 values for the Freundlich isotherms on adsorption of nitrate ions in MB waters on Fe-montmorillonite at ambient temperatures varied from 0.9013 to 0.9938 indicating multi-layer adsorption may have occurred during the purification of MB waters using the clay.
The data on variations in concentrations of iron in water treated with clay composites was used to plot Freundlich isotherms in Figures 12a -12f. The Freundlich isotherms in Figures 12a-12f have shown the adsorptive capacity of the clay for ions of iron in MB water was high enough to warrant recommending use of the clay in clarifying water. The gradients of the lines are high showing the clay had high adsorptive capacity. For adsorption or/and exchange of ions of iron in MB waters with the clay, the linearized Freundlich isotherms are presented below with the constants and coefficients;
Figure 12a: Effect on [Fe] at 0.2g/L clay concentration.

Figure 12b: Effect on [Fe] at 0.4g/L clay concentration.

Figure 12c: Effect on [Fe] at 0.6g/L clay concentration.

Figure 12d: Effect on [Fe} at 0.8g/L clay concentration.

Figure 12e: Effect on [Fe]at 1.0g/L [clay].

Figure 12f: Effect on [iron] at 1.2g/L clay concentration.

At 0.2g/L clay concentration, lnqe = 6.9614lnCe - 6.8686, R² = 0.9701, 1/n =6.961, n=0.144, KF=0.00104.
At 0.4g/L clay concentration, lnqe = 8.1475lnCe - 6.7173, R² = 0.9411, 1/n=8.147 n= 0.123 KF=0.001209.
At 0.6g/L clay concentration, lnqe = 16.74lnCe - 14.056, R² = 0.938, 1/n=16.74, n=0.0597 KF=7.862x 10⁻⁷.
At 0.8g/L clay concentration, lnqe = 2.5206lnCe - 1.7166, R² = 0.917, 1/n= 2.5206 n= 0.397, KF=0.1797.
At 1.0 g/L clay concentration, lnqe= 2.1643lnCe - 1.538, R² = 0.9932, 1/n=2.1643, n=0.462, KF=0.215.
At 1.2g/L clay concentration, lnqe = 1.4008lnCe- 0.8711, R² = 0.9687 1/n=1.4008, n=0.714, KF=0.418.
The Freundlich exponential constant, n, characterizing energetic heterogeneity of the clay surface [40] for removal of ions of iron varied from 0.059 to 0.714 revealing that adsorption of ions or iron on Fe-montmorillonite was not highly favored [42]. The Freundlich exponent, n, should have values lying in the range of 1 to 10 for classification as favorable adsorption [41]. This may have resulted from competition between ions of iron present on clay surface and those present in MB water. Freundlich constant, KF, known to indicate the relative adsorption capacity of the adsorbent for ions of iron from water varied from 7.862x 10⁻⁷ to 0.418 further revealing that the clay had very low adsorptive capacity for ions of iron from water since it also contained iron. The larger value of adsorption capacity, kf, thus the higher the adsorption [43]. The coefficient of linearity for the isotherms derived using adsorption of ions of iron varied from 0.917 to 0.9932 revealing that adsorption to multi-layer capacity occurred during the removal of ions of iron from water [44].
The obstacles to practical application of the Langmuir and Freundlich isotherm theories include the following:
I. These isotherms do not effectively address adsorption versus degradation and competitive adsorption;
II. The conclusions are not all inclusive. For example, adsorption constants and coefficients do not hold true in all cases within similar pollutant types let alone across different pollutant types;
III. The process has so many variables that the additive variance is commonly too great to prove any subtle difference between clays other than a vastly different level of activity [45].
As the Temkin isotherms assume the heat of adsorption of all the molecules in layer decreases linearly with coverage due to adsorbent-adsorbate interactions, and that the adsorption is characterized by a uniform distribution of the bonding energies, up to some maximum binding energy [34]. It was necessary to use data obtained on removal of COD, iron and nitrate by Fe-montmorillonite from MB waters. The data on variations of COD in MB waters treated with clay composites was used to plot Temkin isotherms in Figures 13a-13f. For removal of COD using Fe-montmorillonite, the Temkin linearized isotherms were represented by the equations, constants and coefficients as shown below;
Figure 13a: Effect on [COD] at 0.2g/L clay concn.

Figure 13b: Effect on [COD] at 0.4g/L clay concentration.

Figure 13c: Effect on [COD] at 0.6g/L clay concentration.

Figure 13d: Effect on [COD] at 0.8g/L clay concentration.

Figure 13e: Effect on [COD] at 1.0g/L clay concentration.

Figure 13f: Effect on [COD] at 1.2g/L clay concentration.

At 0.2g/L clay concentration, qe = 26.236lnCe - 27.476 R² = 0.9094 BT=26.24 KT=1.1676
At 0.4g/L clay concentration, y = 36lnCe - 53.12 R² = 0.8848 BT=36.0 KT=8.51
At 0.6g/L clay concentration, qe = 61.018lnCe - 123.07, R² = 0.9771 BT=61.02 KT=3.55
At 0.8g/L clay concentration, qe = 62.766lnCe- 127.86, R² = 0.9763 BT =62.77, KT=2.96
At 1.0g/L clay concentration, qe = 63.356lnCe - 129.22, R² = 0.9752 BT =63.36, KT=7.59
At 1.2g/L clay concentration, qe = 65.377lnCe - 134.13, R² = 0.997 BT=65.38 KT=5.596
For the removal of COD, the Temkin constant BT varied from 26.24 to 65.38. These very high values of BT indicated that the heat of adsorption for COD removal on Fe-montmorillonite was very high. So, the clay bound the COD reducing agents from the polluted MB water very strongly. The equilibrium binding constant, KT varied from 2.96 to 8.51 depicting that adsorption was highly favored for all clay concentrations used in this study. The linearity coefficients varied from 0.882 to 0.997 revealing that the isotherms were highly linear. Thus, removal COD reducing agents from water was very successfully followed up using Temkin isotherms. The bonding energy was higher than mere weak interactions between the clay and COD reducing agents in polluted waters. This supports chemisorption [46]. The data on variations of iron in MB waters treated with clay composites was used to plot Temkin isotherms in Figures 14a-14f. The linearized Temkin isotherms for adsorption or/and ion exchange with Fe-montmorillonite from Chelel have been presented in form of equations with the constants and coefficients below;
Figure 14a: Effect on [iron] at 0.2g/L clay concentration.

Figure 14b: Effect on [iron] at 0.4g/L clay concentration.

Figure 14c: Effect on [iron] at 0.6 g/L clay concentration.

Figure 14d: Effect on [iron] at 0.8g/L clay concentration.

Figure 14e: Effect on [iron] at 1.0g/L clay concentration.

Figure 14f: Effect on [iron] at 1.2g/L clay concentration.

At 0.2g/L clay concentration, qe = 43.424lnCe - 46.233, R² = 0.9988 BT=43.42 KT=8.34
At 0.4g/L clay concentration, qe = 2.6337lnCe - 0.7884, R² = 0.9956 BT=2.633 KT=0.454
At 0.6g/L clay concentration, qe = 35.473lnCe - 29.243, R² = 0.9167 BT=35.47 KT=1.99
At 0.8g/L clay concentration, qe = 4.8199lnCe - 2.5265, R² = 0.9553 BT=4.82 KT=0.0799
At 1.0g/L clay concentration, qe = 3.0245lnCe - 1.2137, R² = 0.9879 BT=3.024 KT=0.2970
At 1.2g/L clay concentration, qe = 2.6337lnCe - 0.7884, R² = 0.9956 BT=2.6337, KT=0.454
The Temkin constant BT for adsorption of iron varied from 2.64 to 43.42. These high values of BT indicated that the heat of adsorption for the ions of iron on Fe-montmorillonite was high. So, the clay bound the ions iron from the polluted MB water strongly. The equilibrium binding constant, KT varied from 0.0797 to 8.34 depicting that adsorption was favored for most of the clay concentrations used in this study. However, the energy of bonding between the clay and ions of iron is predicted to be low supporting physisorption and ion exchange mechanism [46]. The linearity coefficients varied from 0.917 to 0.996 revealing that the isotherms were highly linear. Thus, removal of ions of iron from water was successfully followed up using
Temkin Isotherms
The data on variations of total nitrogen in MB waters treated with clay composites was used to plot linearized Temkin isotherms in Figures 15a-15f. obtained on adsorption of nitrate ions on Femontmorillonite were highly linear depicting that adsorption was highly favored process during the clarification of MB waters. The Temkin linearized isotherms for the adsorption and/or exchange with clay composite have been presented in the equations below together with constants and coefficients;
Figure 15a: Effect on TN at 0.2g/L clay concentration.

Figure 15b: Effect on TN at 0.4g/L clay concentration.

Figure 15c: Effect on TN at 0.6g/L clay concentration.

Figure 15d: Effect on TN at 0.8g/L clay concentration.

Figure 15e: Effect on TN at 1.0g/L clay concentration.

Figure 15f: Effect on TN at 1.2g/L clay concentration.

At 0.2g/L clay concentration, qe= 10.524lnCe - 11.54, R² = 0.9771 BT=11.54, KT=1.097
At 0.4g/L clay concentration, qe= 21.025lnCe - 23.702, R² = 0.9994, BT=21.025, KT=1.127
At 0.6g/L clay concentration, qe= 13.941lnCe - 15.476, R² = 0.9996, BT=13.941, KT=1.110
At 0.8g/L clay concentration, qe= 10.524lnCe -11.54, R² = 0.9771, BT= 11.54, KT=0.912
At 1.0 g/L clay concentration, qe = 7.7008lnCe - 7.5795, R² = 0.9855 BT= 7.5795, KT=5.018
At 1.2g/L clay concentration, qe= 6.3814xlnCe- 6.1582, R² = 0.9861, BT= 6.1582 KT=1.036
The Temkin constant BT varied from 6.1582 to 21.025. These high values of BT revealed that the heat of adsorption for the nitrate ion on Fe-montmorillonite was fairly high. So, the clay strongly bound the nitrate ions from the polluted MB water. The equilibrium binding constant, KT varied from1.036 to 5.018 depicting that adsorption was favored. The linearity coefficients varied from 0.977 to 0.999 revealing that the isotherms were highly linear. Thus, removal of nitrate ions from water was successfully followed up using Temkin isotherms.
Conclusion
The optimum concentration of clay of 0.4gl-1 was observed to produce 73.5+2% fall in COD as microbes and organic waste was removed. The concentration of iron (II) fell from 3.7+0.3 to 2.5+0.2 predicting removal of heavy metal by the clays. The experimental results were analyzed using the Freundlich, Langmuir and Temkin, isotherm models. The Langmuir constant KL related to adsorption capacity of clay varied from 0.436 to 12.996 for removal of ions of iron; 0.068 to 1.161 for nitrate ions; 0.365 to 1.7295 for phosphate ions and 0.912 to 0.989 for removal of COD reducing agents. The Freundlich exponential constant, n, characterizing energetic heterogeneity of the clay surface varied from 0.059 to 0.714 for removal of ions of iron; 0.997 to 1.083 adsorption and /or exchange of nitrate ions; 0.339 to 1.582 for removal of COD reducing agents. The Temkin constant BT varied from 6.1582 to 21.025 for the nitrate, from 2.64 to 43.42 for adsorption of iron and 26.24 to 65.38 for removal of COD reducing agents. Thus Fe-montmorillonite may be used for removal of nutrients, heavy metal ions and COD reducing agents from MB water as it is of low-cost, abundant and a locally available clay composite in Uganda.
Recommendation
There is need to study behavior of polluted water interactions with kaolinite clays. The further studies could also use the Elovich and Peterson-Redman adsorption models.
References
- Aljlil SA, Fares DA (2014) Adsorption of copper and nickel on bentonite clay from wastewater. Athens Journal of Natural & Formal Sciences 1(1): 21-30.
- Al Jlil SA, Alsewailem FD (2009) Saudi Arabian Clays for Lead Removal in Wastewater. Applied Clay Science 42(3-4): 671-674.
- Environmental Protection Agency. Eutrophication, USA.
- Bellir K, Lehocine MB, Meniai AH (2013) Zinc removal from aqueous solutions by adsorption onto bentonite. Desalination Water Treatment 51: 5035-5048.
- Hecky R, Mugidde R, Ramlal P, Talbot M, Kling G, et al. (2010) Multiple stressors cause rapid ecosystem change in Lake Victoria. Freshwater Biology 55(s1): 19-42.
- Scheren P, Zanting H, Lemmens A (2000) Estimation of water pollution sources in Lake Victoria, East Africa: application and elaboration of the rapid assessment methodology. Journal of Environmental Management 58(4): 235-248.
- Machiwa PK (2003) Water quality management and sustainability: the experience of Lake Victoria Environmental Management Project (LVEMP) Tanzania. Physics and Chemistry of the Earth, Parts A/B/C 28(20-27): 1111-1115.
- Cózar A, Bergamino N, Mazzuoli S, Azza N, Bracchini L, et al. (2007) Relationships between wetland ecotones and inshore water quality in the Ugandan coast of Lake Victoria. Wetlands Ecology and Management 15: 499-507.
- Haande S, Rohrlack T, Semyalo RP, Brettum P, Edvardsen B, et al. (2011) Phytoplankton dynamics and cyanobacterial dominance in Murchison Bay of Lake Victoria (Uganda) in relation to environmental conditions. Limnologica - Ecology and Management of Inland Waters 41(1): 20-29.
- Bracchini L, Loiselle SA, Tognazzi A, Dattilo AM, Focardi S, et al. (2007) The optical qualities of shallow wetland lined bays in Lake Victoria. Wetlands Ecology and Management 15(6): 509-519.
- Ssebiyonga N, Erga SR, Hamre B, Stamnes JJ, Frette O (2013) Light conditions and photosynthetic efficiency of phytoplankton in Murchison Bay, Lake Victoria, Uganda. Limnologica-Ecology and Management of Inland Waters 43(3): 185-193.
- Akurut M, Niwagaba CB, Niwagaba, Willems P (2017) Long-term variations of water quality in the Inner Murchison Bay, Lake Victoria. Environmental Monitory Assess 189(1): 20-22.
- Foo KY, Hameed BH (2009) Value added utilization of oil palm ash: a superior recycling of the industrial agricultural waste. Journal of Hazardous Materials 172(2-3): 523-531.
- Foo KY, Hameed BH (2009) Utilization of biodiesel waste as a renewable resource for activated carbon: application to environmental problems. Renewable Sustained Energy Review 13(9): 2495-2504.
- Freundlich HZ (1906) Over The Adsorption in Solution. Journal of Physhical Chemistry 57A: 385-471.
- Marti NA, Bouzas A, Seco J, Ferrer (2008) Struvite precipitation assessment in anaerobic digestion processes, Chemical Engineering Journal 141(1-3): 67-74.
- Jiang WT, Wang CJ, Li Z (2013) Intercalation of ciprofloxacin accompanied by dehydration in rectorite. Appl. Clay Science 7: 74-80 .
- Bürger R, Concha F, Tiller FM (2000) Applications of the phenomenological theory to several published experimental cases of sedimentation processes. Chemical Engineering Journal 80(1-3): 105-117.
- Kul AR, Koyuncu H (2010) Adsorption of Pb(II) ions from aqueous solution by native and activated ben-tonite: kinetic, equilibrium and thermodynamic study. Journal Hazard Mater 179(1-3): 332-339.
- Dal Bosco SM, Jimenez RS, Vignado C, Fontana J, Geraldo B, et al. (2006) Removal of Mn(II) and Cd(II) from wastewaters by natural and modified clays. Adsorption 12(2): 133-146.
- Unuabonah EI, Khaiary MI El, Olu Owolabi BI, Adebowale KO (2012) Predicting the dynamics and performance of a polymer clay-based composite in a fixed bed system for the removal of lead (II) ion. Chemical Engineering Research Disease 90: 1105-1115.
- Nathaniel E, Kurniawan A, Soetaredjo FE, Ismadji S (2011) Organo-bentonite for the adsorption of Pb(II) from aqueous solution: temperature dependent parameters of several adsorption equations. Desalination and Water Treat 36: 280-288. Rivera Hernandez JR, Green Ruiz C (2014) Geosorption of As(III) from aqueous solution by red clays: kinetic studies. Bull. Environ. Contam. Toxicol 92(5): 596-601.
- Yuan G, Wu L (2007) Allophane nanoclay for the removal of phosphorus in water and wastewater. Sci. Technol. Adv. Mater 8(1-2): 60-62
- Elsheikh MA, Matsue N, Henmi T (2009) Effect of Si/Al ratio of allophane on competitive adsorption of phosphate and oxalate. Int. J. Soil Sci 4(1): 1-13.
- Arai Y, Sparks DL, Davis JA (2005) Arsenate adsorption mechanism at the allophane-water interface. Environ. Sci. Technol 39(8): 537-544.
- Shukla EA, Matsue N, Henmi T, Johan E (2011) Arsenate Adsorption mechanism on nano-ball allophane by Langmuir adsorption equation. Environ. Res. Eng. Manag 4(58): 5-9.
- Radwan EK, Hany H Abdel Ghafar, Ahmed S Moursy, Cooper H Langford, Ahmed H Bedair et.al., (2017) (Adsorptive removal of hazardous organic water pollutants by humic acid-carbon hybrid materials: Kinetics and isotherm study. Desalination and water treatment 80: 297-305.
- Battas A, A El Gaidoumi, A Ksakas, A Kherbeche (2019) Adsorption Study for the Removal of Nitrate from Water Using Local Clay. The Scientific World Journal 2019: 1-10.
- Goto M1, Rosson R, Wampler JM, Elliott WC, Serkiz S, Kahn B (2008) Freundlich and dual Langmuir isotherm models for predicting 137Cs binding on Savannah River Site soils. Health Phys 94(1): 18-32.
- Essington M, Melanie Stewart (2015) Influence of Temperature and pH on Antimonate Adsorption by Gibbsite, Goethite, and Kaolinite. Soil Science 180(2): 54-66.
- Shah Mohammadi Kalalagh O, Rafieyan AA, Darvishsefat, S Babaii, A MatajiSh (2011) Isotherm and Kinetic Studies on Adsorption of Pb, Zn and Cu by Kaolinite Caspian J Env Sci 9(2): 243-255.
- Lakdawala MM, Yogesh S Patel (2015) Studies on Adsorption Capacity of Zeolite for Removal of Chemical and Bio-Chemical Oxygen Demands. Chemistry Journal 1(4): 139-143.
- Temkin MJ, Pyzhev V (1940) Kinetics of ammonia synthesis on promoted iron catalysts. Acta Physicochimica 12: 217-222.
- Abdur Rahman, Zafor MA, Rahman Musherda (2013) Surface water quality and risk assessment in the vicinity of Sylhet City. International Journal of Water Resources and Environmental Engineering 5(1): 29-34.
- Gates K (2002) Mineralogy of bentonites. Clays and Clay Miner 50: 223-239.
- Murray HH (2007) Applied Clay Mineralogy: Occurrences, Processing and Application of Kaolins, Bentonites, Palygorskitesepiolite and Common Clays. Developments in Clay Science 55(6): 644-645.
- Mukasa Tebandeke IZ, Ssebuwufu PJM, Nyanzi SA, Schumann A, Nyakairu GWA, et al. (2015) The Elemental, Mineralogical, IR, DTA and XRD Analyses Characterized Clays and Clay Minerals of Central and Eastern Uganda. Advances in Materials Physics and Chemistry 5(2): 67-68.
- (1995) Standard Methods for Analysis of Water and Wastewater. American Public Health Association (APHA).
- Bansal RC and Goyal M (2005) Activated Carbon Adsorption. CRC Press Taylor Francis Group.
- Chantawong V, Harvey NW, Bashkin VN (2003) Comparison of heavy metal adsorptions by Thai kaolin and ball clay. Water Air Soil Pollut 148(1): 111-125.
- Aziz HA, Adlan MN, Ariffin KS (2008) Heavy metals (Cd, Pb, Zn, Ni, Cu and Cr (III) removal from water in Malaysia: Post treatment by high quality limestone. Bioresource technology 99(6): 1578-1583.
- Darus FM, Laiman R, Yusof MN (2007) The removal of basic dye (methylene blue) from aqueous solutions by adsorption on activated carbon prepared from palm oil fibre. Department of environmental technology.
- Karadag D, Akgul E, Tok S, Erturk F, Kaya MA, Turan M (2007) Basic and reactive dye removal using natural and modified zeolites. Journal chemical engineering, 52(6): 2436-2441.
- Proctor A, Toro Vazquez JF (1998) The Freundlich Isotherms in Studying Adsorption in Oil Processing. Journal of the American Oil Chemists’ Society 73(12): 1627-1633.
- Ho YS, Wase DAJ, Forster CF (1996) Removal of lead ions from aqueous solution using sphagnum moss peat as adsorbent. Water SA 22(3): 219-224.


-

Mark E Smith
Bio chemistry
University of Texas Medical Branch, USA -

Lawrence A Presley
Department of Criminal Justice
Liberty University, USA -

Thomas W Miller
Department of Psychiatry
University of Kentucky, USA -

Gjumrakch Aliev
Department of Medicine
Gally International Biomedical Research & Consulting LLC, USA -

Christopher Bryant
Department of Urbanisation and Agricultural
Montreal university, USA -

Robert William Frare
Oral & Maxillofacial Pathology
New York University, USA -

Rudolph Modesto Navari
Gastroenterology and Hepatology
University of Alabama, UK -

Andrew Hague
Department of Medicine
Universities of Bradford, UK -

George Gregory Buttigieg
Maltese College of Obstetrics and Gynaecology, Europe -

Chen-Hsiung Yeh
Oncology
Circulogene Theranostics, England -
.png)
Emilio Bucio-Carrillo
Radiation Chemistry
National University of Mexico, USA -
.jpg)
Casey J Grenier
Analytical Chemistry
Wentworth Institute of Technology, USA -

Hany Atalah
Minimally Invasive Surgery
Mercer University school of Medicine, USA -

Abu-Hussein Muhamad
Pediatric Dentistry
University of Athens , Greece
