Lupine Publishers Group
Lupine Publishers
Menu
ISSN: 2641-6794
Research Article2641-6794 
Fugacity Model for Predicting Phase Distribution and Biotreatment Feasibility of Mixed Organic Compounds and Non-Aqueous Phase Liquid Volume 4 - Issue 5
Pamela L Sheehan1* and Jerome J Kukor2
- 1Research Engineer, U.S. Futures Command, CCDC AC, USA
- 2School of Environmental and Biological Sciences, The state University of New Jersey, USA
Received: March 12, 2020; Published: March 31, 2020
Corresponding author: Pamela L Sheehan, Research Engineer, U.S. Futures Command, CCDC AC, USA
DOI: 10.32474/OAJESS.2020.04.000199
Abstract
Screening tools for predicting the feasibility of remediating complex mixtures of organic compounds are needed to reliably and cost effectively down-select remediation options. This study evaluates the use of a fugacity model as a tool for estimating phase distribution and bioavailability of mixed organic compounds in compost. The model is compared to field-scale composting data to validate model predictions. Fugacity calculations show that the initial mass distribution of 17 semi-volatile and volatile chemicals during a 30 day compost period is predominantly to the organic composting solids and NAPL phase compartments with a lesser distribution to the aqueous phase suggesting limited bioavailability of target compounds. A fugacity level 1 phase distribution model is therefore a useful screening tool for identifying composting limitations and engineering improvements needed for successful treatment of mixed organic compounds.
Introduction
Screening tools for predicting feasibility of hazardous waste
treatment are needed to reliably and cost effectively down-select
remediation options. Without these tools engineers must conduct
complicated and expensive field tests at large enough scale to reflect
operationally relevant conditions. This study evaluates the use of a
fugacity model for phase distribution of mixed organic compounds
as a screening tool to predict the efficacy of bio-treatment by
composting. The model is compared to field-scale composting data
to validate model predictions.
Composting is a demonstrated treatment technology for soils
contaminated with gasoline, oil, coal tar, polychlorinated biphenyls
and explosives [1-8]. Although this technology is based on the
well-documented ability of naturally occurring soil microbes to
degrade hydrocarbons [9-11], the process is characteristically
unpredictable, site specific, and often incomplete [12,13].
Recalcitrance of hydrophobic compounds in biotreatment is not
uncommon and is generally attributed to multiphase partitioning
that separates organic compounds from the degrading microbial
community. Weissenfels, et al. [14] for example, demonstrated
that recalcitrant polycyclic- aromatic hydrocarbons (PAHs) were
degraded after extraction and reinjection into the same soil thereby
showing that biodegradation was limited by compound availability
and not biodegradability. The biodegradability of compounds such
as PAHs that partition to the organic or non-aqueous phase liquid
(NAPL) fractions is controlled by mass transfer [15] at the NAPL or
organic carbon-water interface [12,16]. In this process the organic
compound dissolves out of the NAPL and repartitions into the
aqueous and soil phases where its bioavailability may be limited by
sportive reactions [17-25]. Compound recalcitrance in bio-treatment
is expected to be high when the dissolution and desorption rates
are slow. Predicting the partitioning of hydrophobic compounds
is needed to estimate compound bioavailability, especially for risk
relevant compounds, in determining treatment feasibility.
Compound bioavailability has been measured using analytical
methods based on chemical extraction limits [26,27] and by
theoretical mass transfer calculations based on sorption and
diffusion [22,28,29]. The mathematical approach has the advantage
of predicting how much of a compound introduced into the
environment partitions to the aqueous phase, where it is most likely to biotransform [16], and how much remains in the sediment
or volatilizes to the atmosphere. Fugacity based mathematical
models are commonly applied to predict the fate and transport
of pollutants in the environment [17,30,31] and recently have
been used to predict the biotreatment potential of hydrophobic
compounds in biopile remediation [15]. Four levels of the fugacity
model are defined with model complexity increasing with each
level [32]. Level I assumes system equilibrium and that chemical
loss due to biotic or abiotic transformation or mineralization does
not occur.
Fugacity is a thermodynamic principle related to chemical
potential that uses pressure rather than energy to describe the
likely movement of a compound out of a particular phase (“escaping
tendency”) [32]. In this approach compounds move along a fugacity
gradient, from high to low, and equilibrium is achieved when the
net escaping tendency between two phases is zero [33]. Fugacity
(f) is related to concentration (C) by a fugacity capacity coefficient
(Z) such that C = Zf [32]. The fugacity capacity is a function of the
partition coefficient (K) defined as the compound concentration
ratio between two phases. If C = Zf then the partition coefficient
K1, 2 (between phase 1 and phase 2) is Z1f / Z2f or K1,2 = Z1 / Z2,
since at equilibrium fugacity is constant [29]. The fugacity capacity
for air (Za) is a fixed value based on the ideal gas law and at dilute
compound concentrations Za =1/RT. The fugacity capacity for water
(Zw) is an inverse of the Henry’s Law coefficient (H) determined as
the compound liquid state vapor pressure divided by the compound
solubility [34]. The fugacity capacity for soil, sediment, or sludge
(Zs) is determined by the soil density (ρs), the soil-water partition
coefficient (Kd) and Zw such that Zs = Kd* ρs* Zw (35). The soilwater
partition coefficient is used to predict soil adsorption and is
determined as the fraction of organic carbon in the soil multiplied by
the organic carbon partition coefficient (Koc) of the compound (Kd
= foc* Koc) [35]. The soil-water partition coefficient is replaced by
the octanol-water coefficient when calculating the fugacity capacity
of NAPLs since the NAPL is a miscible solvent and partitioning is
by absorption, not adsorption. The equilibrium fugacity for all
phases is derived by Mackay [33] as f = M / Σ (ViZi) where M is
the total number of moles of a a constituent and Vi is the phase
volume. The compound concentration in each phase is obtained by
calculating the number of moles in each phase (Mi = f* Zi* Vi) and,
since molarity is mass divided by volume each phase concentration
(Ci) is obtained by the expression Ci = f* Zi [35]. The objective of
this study was to determine the relative phase distribution and
concentration of a complex mixture of chemicals in compost using
the Level 1 fugacity model. Results of the model screening analysis
inform treatment selection prior to empirical testing.
Materials and Methods
Model Data
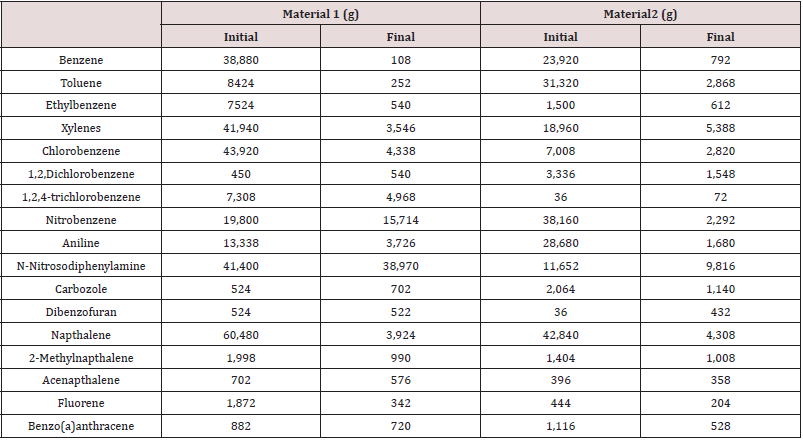
Compost data from a field -scale compost feasibility test was used for the fugacity model. Source material was collected from 2 areas at a former industrial facility. Samples were analyzed for volatile and semi-volatile organic compounds using EPA SW-846 Method 5035/8260B and EPA SW-846 Method 3550B/8270C respectively. The mass of 17 compounds at the initial (day 0) and final day (day 30) of composting are provided in Tables 1&2.
Table 2: Half -life values for compounds in two composting materials.

Data reported (dissertation) over a 49 day composing period.
ND indicates not degraded. Initial concentration was above 100.
Compost Model
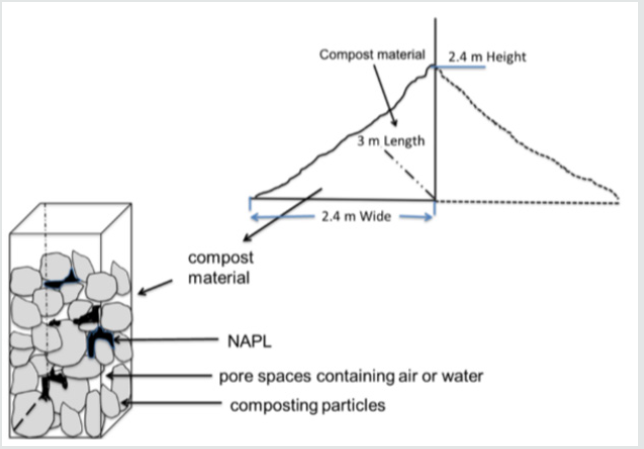
four-compartment model was used to describe separate but
inter connected phases in the compost. Compartments are defined
as pore space air, pore space water, compost solids, and NAPL as
illustrated in Figure 1.
Phase compartment volume estimates were based on a total
compost volume of 15 m3 with a 30% v/v porosity (4.5 m3 total
pore space). Water volume assumes that 30% of the total pore
space is filled with water (1.35 m3) with the remaining 70% of the
total pore space filled with air (3.15 m3). The NAPL compartment
is defined as the total mass of all 17 organic compounds identified
in the industrial waste. NAPL mass was converted to volume using
a density of 970 kg/m3 consistent with work by Pollard, et al. [15].
Material characteristics used in the model are provided in Table 3.
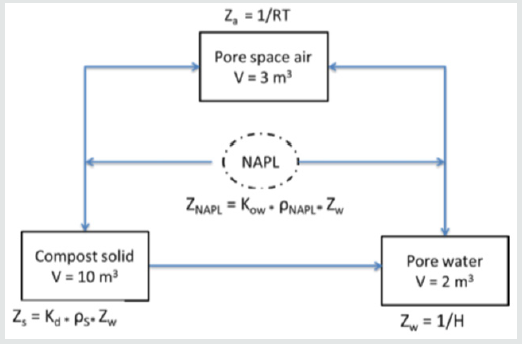
The level 1 fugacity model assumes equilibrium among all phase compartments and is valid only when the composting pile is static, and biodegradation has either not begun or has ended.
Fugacity Calculations
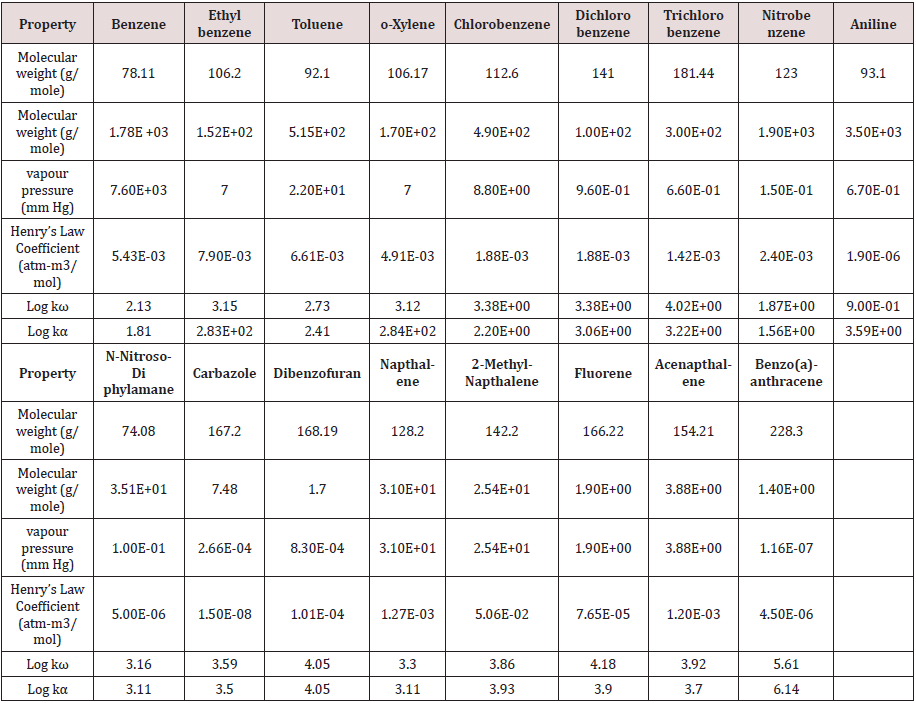
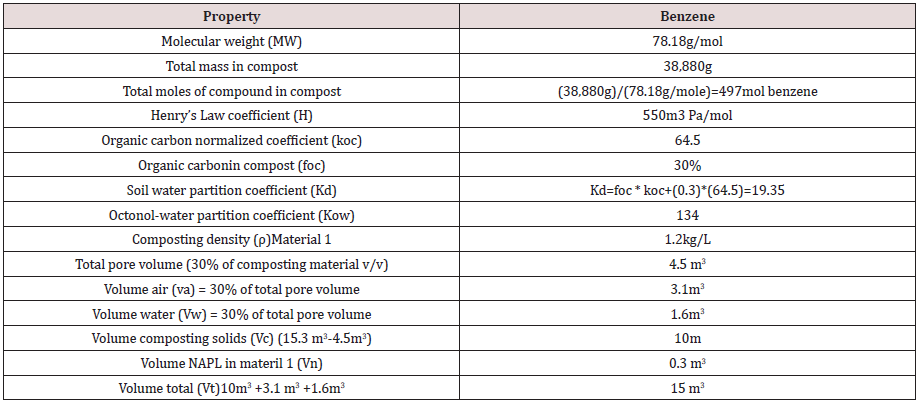
Fugacity based concentrations of the 17 chemicals in the compost material were calculated for pore space air, pore space water, composting material and NAPL phase compartments using the expression f = M/Σ(ViZi). Calculations were facilitated by an Excel spreadsheet made available by Nieman [35]. Physical properties for each compound are provided in Table 4. Phase compartments in equilibrium have equal fugacities as determined by the fugacity capacity and illustrated in Figure 2.A fugacity calculation for benzene is provided as an example using parameters in Table 5.
Za = 1/RT = 1/(8.3145)(293 oK) = 0.00041 mol/m3-Pa
Zw = 1/H = 1/550 = 0.00182 mol/m3-Pa
Zs = Kd*ρs*Zw = (19.35)*(1.2)*(0.00182) = 0.042 mol/m3-Pa
Zn = Zw * Kow = (0.00182)*(134) = 0.24 mol/m3-Pa
The fugacity equation f = M / Σ ZiVi for benzene between
compartments was calculated using fugacity capacity and
compartment volumes.
f = M / (Za*Va) + (Zw*Vw) + (Zs*Vs) + (Zn*Vn)
f = 497 / (0.00041 * 3.1) + (0.00182 * 1.6) + (0.042 * 10) + (0.24
* 0.3)
f = 497 / 0.0013 + 0.0029 + 0.42 + 0.072
f = 497 / 0.4962
f = 1,001.6 Pa
Benzene concentration in each compartment is calculated as:
f = M /Zi*Vi rearranged to:
M = f *Zi*Vi since M = concentration *volume:
Ci = f * Zi
The fugacity of air, water, composting solids and NAPL is
assumed to be equal for Level 1 fugacity calculations. Thus the
concentration of benzene in each phase is given by:
Air: M benzene = f * Za * Va = 1001.6 * 0.00041* 3.1 = 1.27
moles
Ca = f * Za = (1001.6*0.0004) = 0.4812 moles/m3 * 78.18 g/
mole = 32 mg/L in air
Water: M benzene = f * Zw * Vw = 1001.6 * 0.00182 * 1.6 = 3.5
moles
Cw = f * Zw = (1001.6 * 0.00182) = 1.8 moles/m3 * 78.1 g/mole
= 142 mg/L in water
Solid: M benzene = f * Zs * Vs = 1001.6 * 0.042 * 10 = 420.7
moles
Cc = f * Zc = (1001.6 * 0.042) = 42 moles/m3 * 78.18 g/mole =
3,285 mg/L in solids
M benzene = f * Zn * Vn = 1001.6 * 0.24 * 0.3 = 72 moles
Cn = f * Zn = (1001.6 * 0.24) = 240 moles/m3 * 78.18 g/mole =
18,774 mg/L in NAPL
Thus the relative phase distribution of benzene to each
compartment at equilibrium is:
Mass distribution to air = (1.27 moles / 497 moles) * 100 = 0.26%
Mass distribution to water = (3.47 moles / 497 moles) * 100 =
0.70%
Mass distribution to composting solids = (421 moles / 497 moles)
* 100 = 84.7%
Mass distribution to NAPL = (72 moles / 497 moles) * 100 = 14.5%
The relative importance of including a NAPL phase separate from the organic carbon content of composting solids was determined by calculating fugacity concentration for pore water in the absence and presence of a NAPL phase and comparing changes in distribution results.
Results
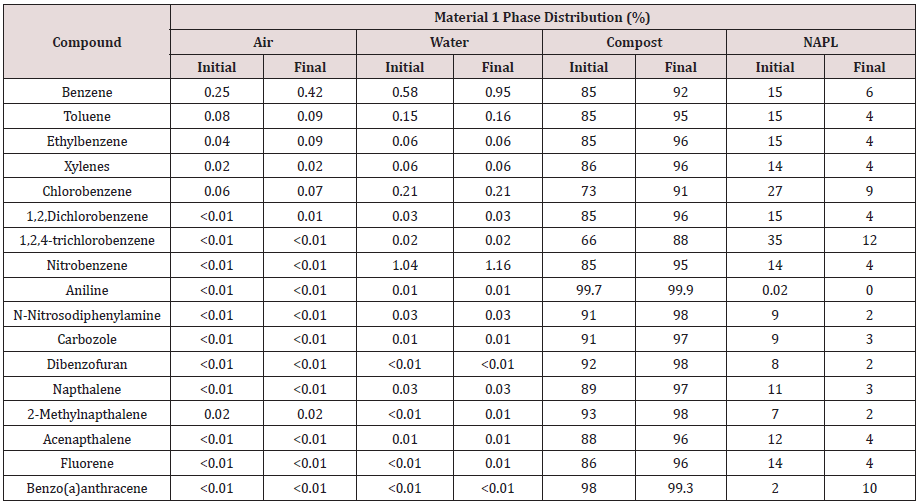
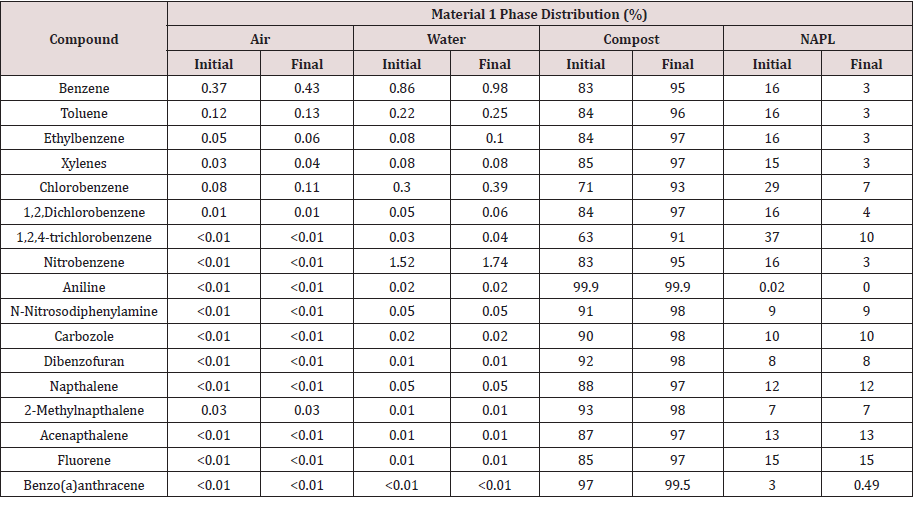
Relative partitioning
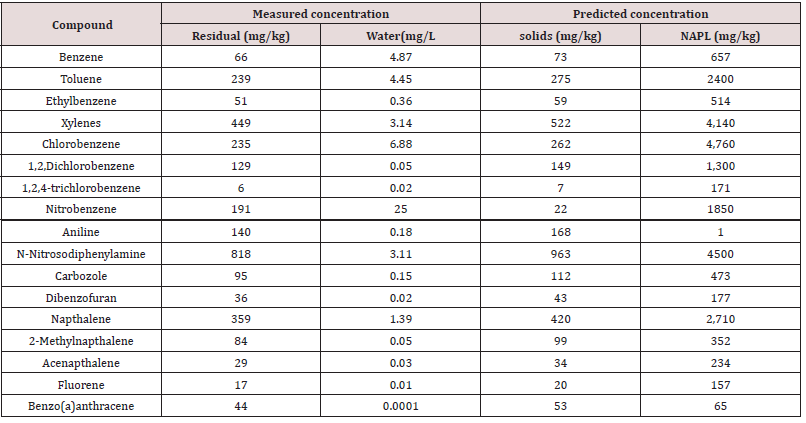
Fugacity calculations show that the initial mass distribution of chemicals was predominantly to the organic composting solids and NAPL phase compartments with a minor distribution to the pore air and water (Tables 6&7). Aniline and benzo (a)anthracene (and to a lesser extent N-nitrosodiphenylamine, carbazole, dibenzofuran, and 2-methylnaphthalene) are distinguished by a relatively low affinity for NAPL whereas chlorobenzene and 1,2,4-trichlorobenzene show a relatively high affinity for NAPL. These distributions generally reflect differences in physical properties and mass transfer coefficients. Compounds with relatively high Koc values tend to partition to organic carbon while those with high Kow coefficients tend to partition to NAPL. Although Koc and Kow are correlated, Koc describes adsorption and Kow describes absorption into a miscible liquid.
Fugacity calculations show that at the completion of composting the measured residual concentration and the predicted compost organic carbon concentration are directly correlated (R2 = 0.99) in both test materials (Tables 8&9). Due to the relatively small NAPL volume remaining at the end of composting, compounds shown to partition to the NAPL phase are highly concentrated.
Table 8: Comparision of measured residual compound concentration with predicted concentration in other phase compartments in Material 1.
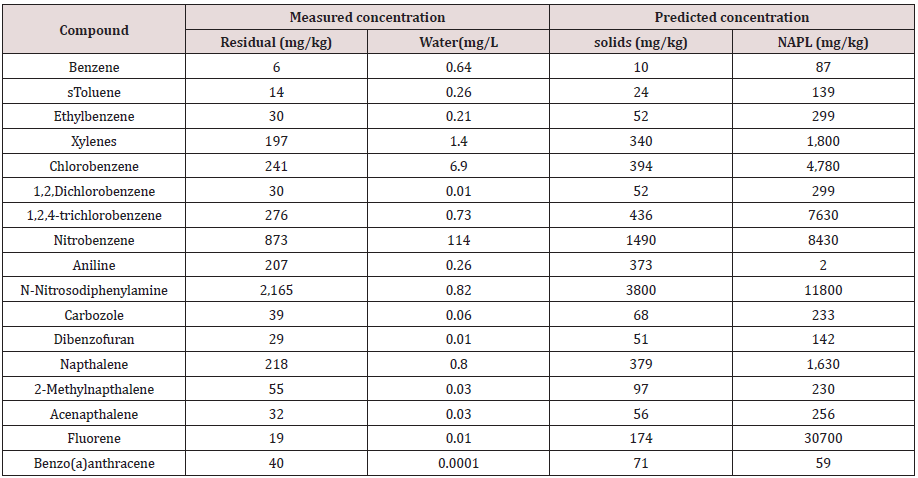
Table 9: Comparison of measured residual compound concentration with predicted concentration in other phase compartments in Material 2.
Bioavailability
The initial and residual mass of each compound in the compost were used in fugacity calculations to predict compound concentrations in pore space water (Table 10). Solubility is a key factor in determining partition distribution to the water phase and although it was not used directly in calculating fugacity it was used (with vapor pressure) to calculate Henry’s Law coefficient and the fugacity capacity of the water phase.
Table 10: Fagucity predicted concentration in pore space water.
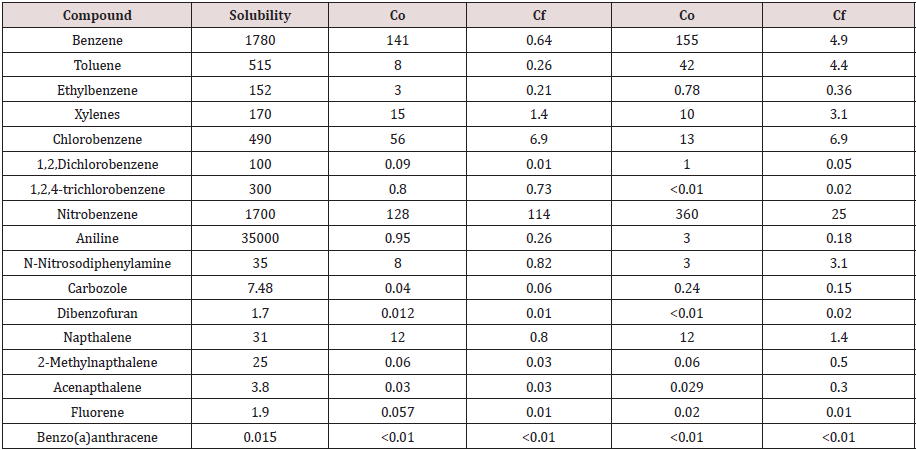
Co=initial concentration Cf= final concentration 1Final compost concentration is above regulatory threshold for non-residential soils.
Figure 3: Correlation between compound solubility and predicted initial concentration in composting material pore water (aniline excluded).
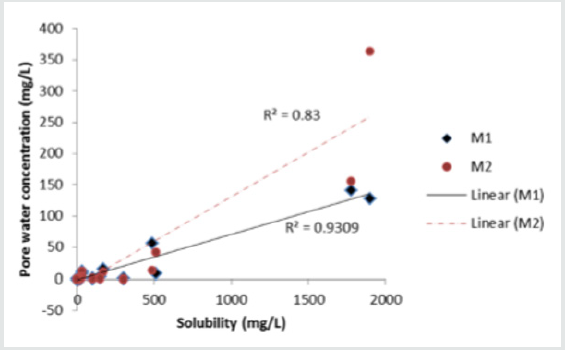
Compound solubility and pore water concentration correlate (R2 = 0.83 - 0.93) only if aniline is removed from the analysis (Figure 3). Including aniline in the analysis resulted in poor overall correlation between pore water concentration and compound solubility in both materials (R2< 0.01). Aniline is anomalous due its relatively high solubility but low predicted concentration in the pore water. Unlike other compounds virtually all of the aniline (99.8%) partitions to the compost organic carbon due to its relatively high Koc. Compounds are most available to microbes in soluble form and biodegradation is expected to occur mainly in the water phase of the compost. Compound concentration in pore water, however, did not correlate well (p < 0.05) with half-life data (Table 2) for Material 1 (R2 = 0.31) or Material 2 (R2 = 0.22) (Figure 4).
Figure 4: Correlation between pore water concentration and degradation half-life in Materials 1 and 2 (excluding aniline).
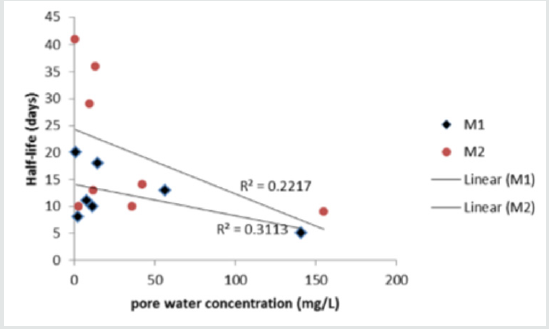
Table 11: Comparison of measured residual compound concentration with predicted concentration in other phase compartments in Material 2.
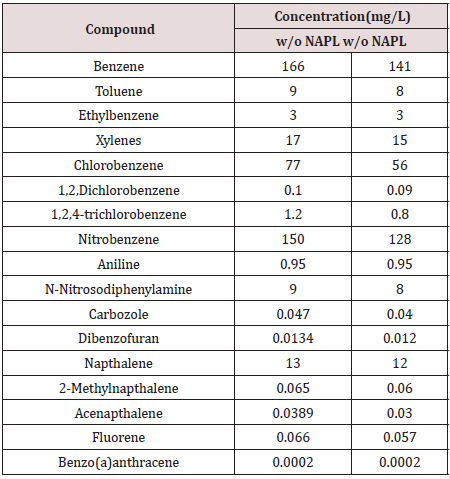
Fugacity calculations that excluded NAPL as a separate phase predicted an increase in pore water concentration (Table 11). An independent samples t-test was used to determine if including a NAPL phase in the fugacity model significantly (ρ < 0.05) influenced the pore water compound concentration. No significant difference is indicated between predicted concentrations when the model included or excluded NAPL df = 35, ρ < 0.05).
Discussion
The Level 1 fugacity model used in this analysis is a simple
screening method for quantifying chemical partitioning in a
heterogeneous matrix. Others have used fugacity to estimate the
fate and transport of chemical pollutants, particularly hydrophobic
organic compounds, in the environment [36,37]. This is the first
study to apply fugacity analysis to predict the phase distribution
of a complex mixture of hydrophobic compounds in compost. This
study modifies the basic environmental model defined by Mackay,
et al. [38] to include a NAPL phase in addition to air, water and
solids leaving out biota, sediment and aerosols.
An identified NAPL phase representing the total mass of
contaminants and considered separately from the organic
compound concentration is not common in ex situ treatment.
Pollard, et al. [15] used this approach in a fugacity analysis of
biopile treatment of benzene and PAHs. The results of the present
study are consistent with the observations of Pollard et al. that
NAPL and soil organic carbon are the main distribution phases
with minor distribution to pore space air or water. Zemanek, et al.
[19] demonstrated that 71% of PAHs (by weight) distributed to
oil present at 2% of the soil mass. Results presented here predict
that when the contaminant mass is approximately 2% of the total
compost mass (Material 2), 85 to 98% of the PAHs distribute to the organic compost and only 3 to 13% to NAPL. Pollard, et al. [15]
showed that as the percent carbon increased in bio piles from 9%
to 15%, PAH distribution to NAPL decreased from 58% to 32% for
benzene, 62% to 36% for anthracene and 13% to 5% for benzo(a)
pyrene. The present study is consistent with these results showing
by extension that a further increase in organic carbon to 30%
results in only 16% distribution to NAPL for benzene, 13% for
acenaphthene and 3% for benzo(a)anthracene. Thus, identifying
a NAPL phase separate from the organic carbon content becomes
increasingly important as the percent carbon in the treatment
material decreases. Residual concentrations partitioned to the
NAPL phase are typically a long-term source of contamination and
mass transfer from NAPL to the water phase is the rate limiting
reaction for compound bioavailability. Thus, not including NAPL
as a separate phase from organic carbon in highly contaminated
materials may result in an overestimation of treatment potential.
Since the bulk of the compounds distribute to the NAPL
and compost organic carbon, limited biodegradation might be
expected. Guerin and Boyd [39], however, observed degradation
rates and extents for naphthalene that exceeded predictions
based on bioavailability assays and cautioned that bioavailability
can be influenced by microorganisms not accounted for in phase
distribution models. The opposite is also true and not all compounds
with predicted bioavailability are biodegraded, since this also
depends on the metabolic capacity of indigenous microorganisms.
Results of the present study predict that nitrobenzene is available
for biodegradation based on fugacity concentrations in the pore
water of 128 mg/L in Material 1 and 360 mg/L in Material 2 at the
start of composting. A final concentration of 114 mg/L in Material 1
pore water suggests compound availability but not biodegradability
whereas a final concentration of 25 mg/L in Material 2 pore
water suggests both bioavailability and biodegradability. This
observation is consistent with biodegradation half-life data (Table
2). The significance of this finding is that treatment improvement
may require two different compost management strategies: one
to improve growth and specific metabolic activity of indigenous
microbes and the other to improve compound bioavailability.
Conclusion
The fugacity Level 1 model is a useful screening tool to identify potential treatment limitations due to phase distribution of complex mixtures of organic compounds. NAPL and organic carbon are the predominant partition phases for hydrophobic compounds. The importance of including a NAPL phase in the fugacity model is increasingly important in materials with a low natural organic carbon content. Excluding a NAPL phase from the fugacity model may result in an underestimate of risk relevant compounds in residual materials. The presence or absence of a NAPL phase in the fugacity distribution model did not significantly (ρ < 0.05) influence the predicted pore water concentrations of target compounds. Water phase concentrations appear to correlate with compound solubility but not to biotransformation rates quantified by degradation half-life. Thus, compound bioavailability, indicated by the pore water concentration, does not necessarily indicate compound biodegradability. A comparison of soluble compound concentrations of recalcitrant compounds before and after composting provides additional information for distinguishing between bioavailability and biodegradability limitations. A fugacity Level 1 phase distribution model is therefore a useful screening tool for identifying composting limitations and improvements needed for a more complete treatment of hydrophobic chemicals.
References
- Semple KT, Reid BJ, Fermor TR (2001) Impact of composting strategies on the treatment of soils contaminated with organic pollutants. Environmental Pollution 112(2):269-283.
- Al-Daher R, Al-Awadhi N,Yateem A, Balba MT, Einawawy A, et al. (2001) Compost soil piles for treatment of oil-contaminated soil. Soil & Sediment Contamination 10(2):197-209.
- Antizar-Ladislao B, Lopez-Real J, Beck AJ (2005) In-vessel composting-bioremediation of aged coal tar soil: effect of temperature and soil/green waste amendment ratio. Environment International 31(2):173-178.
- Antizar-Ladislao B, Lopez-Real JM, Beck AJ (2004) Bioremediation of polycyclic aromatic hydrocarbon (PAH)-contaminated waste using compositing approaches. Critical Reviews in Environmental Science and Technology 34(3):249-289.
- Sasek V, Bhatt M, Cajthaml T, Malachová K, Lednická D(2003)Compost-mediated removal of polycyclic aromatic hydrocarbons from contaminated soil. Archives of Environmental Contamination and Toxicology 44:336-342.
- LoickN, Hobbs PJ, Hale MDC, Jones DL(2009) Bioremediation of poly-aromatic hydrocarbon (PAH)-contaminated soil by composting. Critical Reviews in Environmental Science and Technology 39:271-332.
- Michel FC, Jr.Quensen J, Reddy CA (2001) Bioremediation of a PCB-contaminated soil via composting. Compost Science & Utilization 9:274-284.
- Brown KW, Thomas JC, Seago OJ (1995) Degradation of explosive propellants by invessel composting. BioCycle 36:56.
- Atlas RM, Cerniglia CE (1995) Bioremediation of petroleum pollutants. Hydrocarbon Biodegradation 45:332-338.
- Gallego JL, García-Martínez MJ, Llamas JF, Belloch C, Peláez AI, et al.(2007) Biodegradation of oil tank bottom sludge using microbial consortia. Biodegradation 18(3):269-281.
- Heitkamp MA, Cerniglia CE (1989)Polycyclic aromatic hydrocarbon degradation by a Mycobacterium sp. in microcosms containing sediment and water from a pristine ecosystem. Applied and Environmental Microbiology 55(8):1968-1973.
- Lin T-C, Pan P-T, Young C-C, Chang J-S, Chang T-C, Cheng S-S(2011) Evaluation of the optimal strategy for ex situ bioremediation of diesel oil-contaminated soil. Environmental Science and Pollution Research International 18(9):1487-1496.
- Gallego JL, Sierra C, Permanyer A, Peláez AI, Menéndez-Vega D, et al.(2011) Fullscale remediation of a jet fuel-contaminated soil: assessment of biodegradation, volatilization, and bioavailability. Water, Air and Soil Pollution 217:197-211.
- Weissenfels WD, Klewer H-J,Langhoff J(1992) Adsorption of polycyclic aromatic hydrocarbons (PAHs) by soil particles: influence on biodegradability and biotoxicity. Applied Microbiology and Biotechnology 36(5):689-696.
- Pollard SJT, Hough RL, Kim KH, Bellarby J, Paton G, et al.(2008) Fugacity modelling to predict the distribution of organic contaminants in the soil: oil matrix of constructed biopiles. Chemosphere 71(8):1432-1439.
- Ramaswami A, Luthy RG (1997) Mass transfer and bioavailability of PAH compounds in coal tar NAPL - slurry systems. 1. model development. Environmental Science & Technology 31:2260-2267.
- Prabhakar TC, Gautam TR, Kang Kun L, Truex MJ, Davis GBet al. (2004) Modeling of DNAPL-dissolution, rate-limited sorption and biodegradation reactions in groundwater systems. Bioremediation Journal 8(1-2):47-64.
- Ghoshal S, Luthy RG (1996) Bioavailability of hydrophobic organic compounds from nonaqueous-phase liquids: the biodegradation of naphthalene from coal tar. Environmental Toxicology and Chemistry 15:1894-1900.
- Zemanek MG, Pollard SJT, Kenefick SL, Hrudey SE (1997) Multi-phase partitioning and co-solvent effects for polynuclear aromatic hydrocarbons (PAH) in authentic petroleum- and creosote-contaminated soils. Environmental Pollution 98(2):239-252.
- Nam K, Kim J (2002) Persistence and bioavailability of hydrophobic organic compounds in the environment. Geosciences Journal 6:13-21.
- Gobas F, Maclean LG(2003) Sediment-water distribution of organic contaminants in aquatic ecosystems: the role of organic carbon mineralization. Environmental Science & Technology 37(4):735-741.
- Lee J, Hundal LS, Horton R, Thompson ML(2002) Sorption and transport behavior of naphthalene in an aggregated soil. Journal of Environmental Quality 31(5):1716-1721.
- Pan B, Ning P, Xing B (2008) Part IV--sorption of hydrophobic organic contaminants. Environmental Science and Pollution Research International 15(7):554-564.
- Lu X-Y, Zhang T, Fang H, H-P(2011) Bacteria-mediated PAH degradation in soil and sediment. Applied Microbiology and Biotechnology 89(5):1357-1371.
- Peters CA, Wammer K, Knightes CD(2000) Multicomponent NAPL solidification thermodynamics. Transport in Porous Media 38:57-77.
- Hickman ZA, Swindell AL, Allan IJ, Rhodes AH, Hare R, et al.(2008) Assessing biodegradation potential of PAHs in complex multi-contaminant matrices. Environmental Pollution 156(3):1041-1045.
- Mahmoudi N, Slater GF, Juhasz AL(2013) Assessing limitations for PAH biodegradation in long-term contaminated soils using bioaccessibility assays. Water, Air and Soil Pollution 224:1-11.
- Knightes CD, Peters CA (2006)Multisubstrate biodegradation kinetics for binary and complex mixtures of polycyclic aromatic hydrocarbons. Environmental Toxicology and Chemistry 25(7):1746-1756.
- Baek J-M, Park S-J(2000) Tracking the distribution of organic compounds using fugacity model. Korean J ChemEng17:12-16.
- Koprivnjak J-F, Poissant L(1997) Evaluation and application of a fugacity model to explain the partitioning of contaminants in the St. Lawrence river valley. Water, Air and Soil Pollution 97:379-395.
- Clark B, Henry JG, Mackay D (1995) Fugacity analysis and model of organic chemical fate in a sewage treatment plant. Environmental Science & Technology 1;29(6):1488-1494.
- Mackay D(2004) Finding fugacity feasible, fruitful, and fun. Environmental Toxicology and Chemistry 23(10):2282-2289.
- Mackay D (1979) Finding fugacity feasible. Environmental Science & Technology 13:1218-1223.
- Fugacity models. Access date (2013).
- Nieman KC(2003) How to use a level I fugacity model to estimate contaminant partitioning in the subsurface.
- Golding CJ, Gobas FAPC, Birch GF(2008) A fugacity approach for assessing the bioaccumulation of hydrophobic organic compounds from estuarine sediment. Environmental Toxicology and Chemistry 27(5):1047-1054.
- Mackay D, Arnot JA(2011)Theapplication of fugacity and activity to simulating the environmental fate of organic contaminants. Journal of Chemical & Engineering Data 56(4):1348-1355.
- Mackay D, Joy M, Paterson S (1983) A quantitative water, air, sediment interaction (QWASI) fugacity model for describing the fate of chemicals in lakes. Chemosphere 12:981-997
- Guerin WF, Boyd SA (1997) Bioavailability of naphthalene associated with natural and synthetic sorbents. Water Research 31(6):1504-1512.

Top Editors
-

Mark E Smith
Bio chemistry
University of Texas Medical Branch, USA -

Lawrence A Presley
Department of Criminal Justice
Liberty University, USA -

Thomas W Miller
Department of Psychiatry
University of Kentucky, USA -

Gjumrakch Aliev
Department of Medicine
Gally International Biomedical Research & Consulting LLC, USA -

Christopher Bryant
Department of Urbanisation and Agricultural
Montreal university, USA -

Robert William Frare
Oral & Maxillofacial Pathology
New York University, USA -

Rudolph Modesto Navari
Gastroenterology and Hepatology
University of Alabama, UK -

Andrew Hague
Department of Medicine
Universities of Bradford, UK -

George Gregory Buttigieg
Maltese College of Obstetrics and Gynaecology, Europe -

Chen-Hsiung Yeh
Oncology
Circulogene Theranostics, England -
.png)
Emilio Bucio-Carrillo
Radiation Chemistry
National University of Mexico, USA -
.jpg)
Casey J Grenier
Analytical Chemistry
Wentworth Institute of Technology, USA -
Hany Atalah
Minimally Invasive Surgery
Mercer University school of Medicine, USA -

Abu-Hussein Muhamad
Pediatric Dentistry
University of Athens , Greece

The annual scholar awards from Lupine Publishers honor a selected number Read More...


