Lupine Publishers Group
Lupine Publishers
Menu
ISSN: 2641-6794
Research Article2641-6794 
Evaluating the Soil Qulaity of Three Sub-Watersheds in Udayapur District, Nepal Volume 5 - Issue 2
Manisha Ghimire, Ram Asheshwar Mandal* and Ajay Bhakta Mathema
- School of Environment Science and Management, Nepal
Received: June 05, 2020; Published: June 29, 2020
Corresponding author: Ram Asheshwar Mandal, School of Environment Science and Management, Nepal
DOI: 10.32474/OAJESS.2020.05.000209
Abstract
The soil health of sub-watershed indicates the function of the soil which can be evaluated using the soil quality index (SQI) but research regarding this so far limited. Thus, this research was objectively done to assess the soil nutrient status and soil quality index according to soil depth and compare these values in sub-watersheds. Three sub-watersheds namely Baruwa Khola, Puware Khola and Chituwa Khola of Udayapur district were selected as the study area. The soil was extracted from 0-10, 10-20 and 20- 30 cm depths so total 108 samples, 36 from each catchment were collected in W shape. The soil parameters N, P, K, C, pH, and soil texture were analysed using Kjeldahl method for nitrogen, Olsen’s and Somers method for phosphorous, Flame photometric method for potassium, Walkley and Black method for carbon and pH metre for pH. The SQI was calculated by using the formula proposed by Bajracharya. The result showed that soil was moderately acidic to nearly neutral with 5.95 and 7 pH at different soil depth. The dominant textures were sandy loam and loam. Soil quality index of three sub-watersheds were fair having the values 0.73 (0-10 cm), 0.67 (10-20 cm) and 0.69 (20-30 cm) in Baruwa Khola whereas 0.71 (0-10 cm), 0.71 (10-20 cm) and 0.78 (20-30 cm) in Puware Khola, similarly, 0.65 (0-10 cm), 0.67 (10-20 cm) and 0.69 (20-30 cm) in Chituwa Khola. Available Phosphorus was high at bottom, available Potassium at 20-30 and total Nitrogen was high at the top soil associated with values 4.9 kg/ha ,252.90 kg/ha and 0.126 % respectively in Baruwakhola followed by 11.34kg/ha 360.41kg/ha and 0.197 % in Puwarekhola followed by 2.81 kg/ha, 295.68 kg/ha and 0.89% in Chituwakhola. One-way ANOVA showed that there was no significant difference in nitrogen (p=0.013) in Baruwa Khola sub-watershed. The value of SQI was found to be fair in all sub-watersheds Baruwakhola, Puware Khola and Chituwa Khola with 0.7, 0.73 and 0.67 respectively. This study will be useful for researcher for the further work in soil science.
Keywords: Organic Matter; Soil Nutrient Level; Soil Quality Index
Introduction
The term watershed and catchment are used when referring to
broader management issues across an entire watershed, while the
term sub watershed is used to refer assessment level studies and
specific projects within the smaller sub watershed units. Watershed
and sub watershed units for local plans are the most practical.
Each watershed consists of many individual sub watersheds that
can have their own distinctive targets for water resources. A
catchment is an area in which water falling on or flowing across
the land surface drains into a particular stream or river and flows
ultimately through a single point or outlet. As the water flows over
the landscape it finds its way into the streams and down into the
soil, eventually feeding the river. A catchment for water is simply
described as a land region around a river, lake, or other water body.
Living in a catchment with healthy water can help a better quality
of life for a community. A good catchment of water offers drinking
water of high quality and promotes livelihoods such as agriculture,
recreational fishing, and water sports.
Soil quality can be defined as the capacity of specific kind of
soil to function, within natural or managed ecosystem boundaries,
to sustain plant and animal productivity, maintain or enhance
water and air quality, and support human health and habitation [1].
Soil quality is an energetic interaction between various physical,
chemical, and biological soil properties, which are influenced by
many external factors such as land management, land use, the
environment, and socio-economic priorities. “The SQI may also be
an indicator of the potential for soil quality to change because of
the influence of environmental stressors (for example, atmospheric
deposition, changes in global cycles, and so forth)” [2]. Soil quality is considered a key element of sustainable agriculture Warkentin
[3] because it is essential to support and sustain crop, range and
woodland production and helps maintain other natural resources
such as water, air, and wildlife habitat.
“Soil quality is a complex functional concept and cannot be
measured directly in the field or laboratory. A mathematical or
statistical framework was put forward in early 1990s to estimate
soil quality index” [4]. Soil quality index (SQI) helps to evaluate
changes in the dynamic characteristics of soil induced by external
variables [5]. It is used to evaluate the general soil condition and
management reaction, or resilience to natural and anthropogenic
forces.
Soil, water, and plants are vital natural resources that help
to produce food and fiber for human. They also maintain the
ecosystems on which all life on Earth ultimately depends. Soil serves
as a medium for plant growth; a sink for heat, water, and chemicals;
a filter for water; and a biological medium for the breakdown of
wastes. In a developing country such as Nepal, where the bulk of
the population is still dependent on forests and agriculture, soil
quality maintenance and enhancement is a major problem. Plant
growth depends directly on good soil functions. Knowledge of the
spatial characterization of soil properties is required in order to
find homogeneous regions for sustainable management.
The soil quality index is the significant dimension to indicate
the characteristics of the soil. Good health of soil assures the water
and vegetation quality as well. The healthy sub-watershed and
watershed assures the healthy condition of vegetation, soil quality,
nutrients, and water recharge. There is research gap to show
whether, the health of the watershed and sub-watershed bad or
good. Soil health parameter especially N, P, K, pH and C are very
important to indicate the condition of the watershed and sub-water,
but such studies are very limited in Nepal. The soil quality index
is important tool to show the status of the watershed and subwatershed.
Therefore, this study was needed.
Materials and Methods
Study area
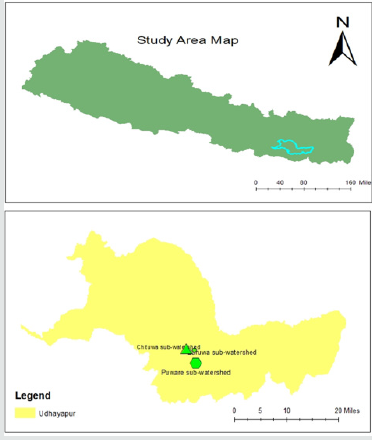
Udayapur is one of the 14 districts in Eastern Nepal’s No. 1 province which lies in the Chure range. It is encircled by mountains of Mahabharat from the north and Shiwalik from the south, whereas both hills meet from the west, forming a valley of Udayapur. The latitude, longitude and altitude of the district is 26° 54’ 59.99” N, 86° 39’ 59.99” E and 1049m.Forest cover accounts for 67% of the district’s complete land region Figure 1. The district’s main source of water remains small and large rivers and ponds. The district’s main water resources are ponds such as Rauta Pokhari, Suke Pokhari, Tapli Pokhari, Jogidaha Chure Forest Pond and Jhilke Pokhari. Triyuga is the district’s largest river. According to the census of 2011 the total population of Udaypur district is 317,532. Baruwa Khola, Chituwa Khola and Puware Khola sub-watersheds of Triyuga watershed which lies in similar altitude (1049m), latitude 26° 54’ 59.99” N and longitude 86° 39’ 59.99” E was selected as the study sites.
Data collection
The plots were allocated on the map. The coordinates of sample plot were uploaded in GPS receiver. Altogether 108 samples 36 from each catchment were gathered. Those soil samples extracted from simple random sampling method were taken from 0-10 cm soil profile up to 30 cm depth at interval of 10 cm and 20 cm. About 500 gm of soil was excavated and collected in polythene bag.
Lab analysis
Nitrogen was analyzed using Kjeldahl method (Bremner
and Mulvaney, 1986) and Potassium was analyzed using
Flame photometric method (Toth and Prince, 1949). Similarly,
Phosphorous, pH, Organic carbon and Texture analysis was done
using Olsen’s and Somers method (1982), pH meter, Walkley and
Black method and Hydrometer method, respectively.
Soil quality index was calculated by using the formula proposed
by Bajracharya et al., (2006).
SQI = [(a x RSTC) + (b x RpH) + (c x ROC) + (d x RNPK)]
Where,
RSTC = assigned ranking values for soil textural class,
RpH = assigned ranking values for soil pH,
ROC=assigned ranking values for organic carbon,
RN=assigned ranking values for nitrogen,
RP=assigned ranking values phosphorus,
RK=assigned ranking values for potassium,
And a=0.2 b=o.1 c=0.4 and d=0.3 are weighted values
corresponding to each of the parameter.
Statistical analysis: The result showed that the data were normally distributed so, parametric test; One way ANOVA was used to analyze the determined data.
Scoring method
The scoring method developed by NARC (1993) was used to interpret SQI Table 1. For commonly used soil parameters in Nepal were:
Where,
C- Clay, S-Sand, CL-Clay loam, SC- Sandy Clay, SiC- Silty Clay, Si-
Silt, LS-Loamy sand, SiL- Silty loam, SL-Sandy loam, LS Loamy Sand,
SiL-Silty loam, SL-Sandy loam, SiCL -Silty Clay loam, SCL- Sandy Clay
loam, SQI-Soil Quality Index.
Interpretation table for Soil pH
Strongly acidic is <4.5 pH but the pH values 4.5-5.5, 5.5-6.5,
6.5-7.5 and >7.5 pH wer weakly acidic, moderately acidic, nearly
neutral, and alkaline, respectively.
Soil fertility ranking was done using NARC guideline Table 2.
Results and Discussion
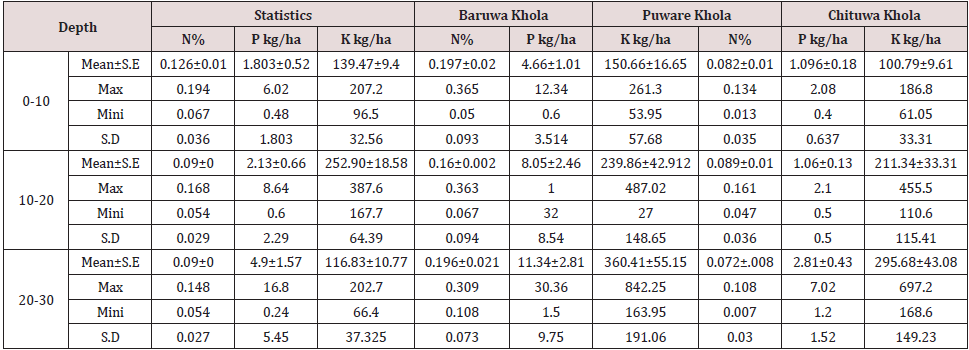
Status of soil nutrient according to soil depth in subwatersheds The soil nutrients were varied according to sub watersheds.
The Table 3 showed that the Baruwa Khola sub-watershed had the highest value of nitrogen in 0-10 cm soil depth with the value 0.126%, maximum 0.194% and minimum 0.067% whereas the lowest was 0.09% in 10-20 cm and 20-30 cm depth, respectively. The highest phosphorous was 4.9% in 20-30 cm depth and lowest was 1.803% in 0-10 cm soil depth. Similarly, the highest potassium was 252.90% at 10-20 cm soil depth and lowest was 116.83% in 20-30 cm soil depth.
The Puware Khola sub-watershed had the highest value of nitrogen in 0-10 cm soil depth with the value 0.197%, maximum 0.365% and minimum 0.05% whereas the lowest was 0.16% in 10- 20 cm depth. The highest phosphorous was 11.34% in 20-30 cm depth and lowest was 4.66% in 0-10 cm soil depth. Similarly, the highest potassium was 360.41% at 20-30 cm soil depth and lowest was 150.66% in 0-10 cm soil depth.
The Chituwa Khola sub-watershed had the highest value of nitrogen in 0-10 cm and 10-20 cm soil depth with the value 0.08%, whereas the lowest was 0.07% in 20-30 cm depth. The highest phosphorous was 2.81% in 20-30 cm depth and lowest was 1.06% in 10-20 cm soil depth. Similarly, the highest potassium was 295.68% at 20-30 cm soil depth and lowest was 100.79% in 0-10 cm soil depth Table 3. Similar study was done by Nepal and Mandal [6] where research was objectively carried out to identify the variation of different soil properties as AK, AP, TN, Soil Organic Matter and soil pH according to depth. Available Phosphorus, Available Potassium and total Nitrogen was high at the top soil associated with values 31.31 kg/ ha ,435.74 kg/ha and 0.15 % respectively in Bade khola catchment of Doti district followed by 10.67 kg/ha 370.24 kg/ha and 0.234 % in Brindaban catchment of Baitadi district. Total Nitrogen, available Potassium and available Phosphorus were gradually decreased with increasing in soil depth at both districts of catchments.
Soil texture in sub watersheds according to its depth
The Table 4 showed that the highest clay was 23.62% at 10-20 soil depth whereas the lowest clay was 21.28% at 0-10 cm soil depth in Baruwa Khola sub-watershed. The highest sand in Baruwa Khola was 46.63% at 0-10cm depth and lowest was 43.88% at 20-30 cm depth. Similarly, the highest silt was 32.08% at 0-10 cm depth and the lowest silt was 30.50% at 10-20 cm soil depth. The highest clay in Puware Khola sub-watershed was 7.04% at 0-10 cm depth and the lowest was 3.37% at 20-30 cm depth. Similarly, the highest sand was 84.21% at 20-30 cm depth and the lowest sand was 81.38% at 0-10 cm depth. Likewise, the highest silt was 12.50 at 10-20 cm depth and lowest was 11.58% at 0-10 cm depth. The highest clay in Chituwa Khola sub-watershed was 25.54% at 20-30 cm depth and the lowest was 20.12% at 0-10 cm depth. Similarly, the highest sand was 46.46% at 0-10 cm depth and lowest was 43.29% at 10-20 cm soil depth. Likewise, the highest silt was 33.42% at 0-10 cm soil depth and lowest was 30.58% at 20-30 cm depth.
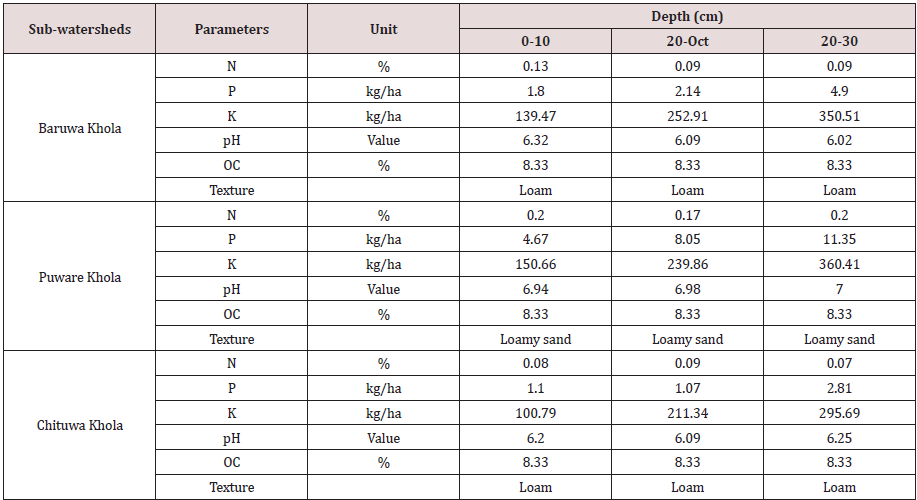
N, P, K, pH, OC and texture of three sub-watersheds according to its depth
The Table 5 showed that the highest nitrogen in Baruwa Khola sub-watershed was 0.13% at 0-10 cm depth and lowest was 0.09 at 10-20 and 20-30 cm depth. Similarly, the highest phosphorous was 4.90kg/ha in 20-30 cm depth and lowest was 1.80kg/ha at 0-10 cm depth. Likewise, the highest potassium was found to be 350.51kg/ha at 20-30 cm depth and lowest was 139.47kg/ha at 0-10 cm depth. Moreover, the OC was 8.33% at all the depth. The pH value was highest at 0-10 cm depth with 6.32 and lowest was 6.02 at 20-30 cm depth. The soil texture showed the loam in nature. The highest nitrogen in Puware Khola sub-watershed was 0.20% at 0-10 cm and 20-30cm depth and lowest was 0.17 at 10-20 cm depth. Similarly, the highest phosphorous was 11.35kg/ha in 20-30 cm depth and lowest was 4.67kg/ha at 0-10 cm depth. Likewise, the highest potassium was found to be 360.41kg/ha at 20-30 cm depth and lowest was 150.66kg/ha at 0-10 cm depth. Moreover, the OC was 8.33% at all the depth. The pH value was highest at 20-30 cm depth with 7 and lowest was 6.94 at 0-10 cm depth. The soil texture showed the loamy sand in nature.
The highest nitrogen in Chituwa Khola sub-watershed was 0.09% at 10-20cm depth and lowest was 0.07 at 20-30 cm depth. Similarly, the highest phosphorous was 2.81kg/ha in 20-30 cm depth and lowest was 1.07kg/ha at 10-20 cm depth. Likewise, the highest potassium was found to be 295.69kg/ha at 20-30 cm depth and lowest was 100.79kg/ha at 0-10 cm depth. Moreover, the OC was 8.33% at all the depth. The pH value was highest at 20-30 cm depth with 6.25 and lowest was 6.09 at 10-20 cm depth. The soil texture showed the loam in nature.
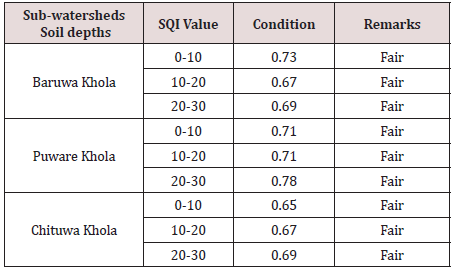
Soil Quality Index
The Table 6 showed that the Soil Quality Index value of Baruwa Khola was highest with 0.73 in 0-10 cm soil depth and lowest was 0.67 at 10-20 cm soil depth. Similarly, the SQI value of Puware Khola sub-watershed was highest with 0.78 at 20-30 cm soil depth and lowest was 0.71 at 0-10 cm and 10-20 cm depth. Moreover, the SQI of Chituwa Khola sub-watershed was highest with the value 0.69 at 20-30 cm soil depth and lowest was 0.65 at 0-10 cm soil depth.
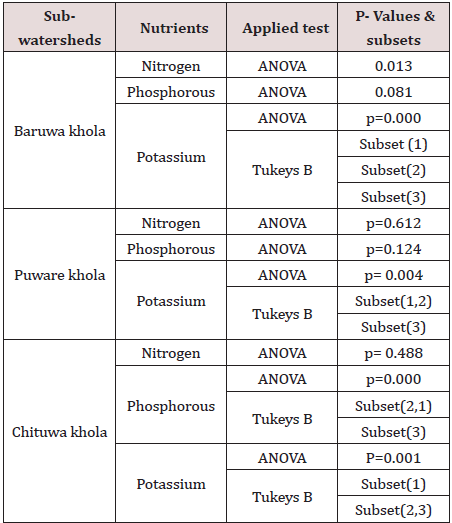
One way ANOVA showed that there was no significant difference
in nitrogen (p=0.013) in Baruwa Khola sub-watershed, since p
was greater than 0.005 and there was no significant difference in
phosphorous (p=0.081) as well, since p was greater than 0.005
but there was significant difference in potassium (p=0.000), since p<0.005. On the other hand there was no significant difference in
nitrogen (p=0.612) and phosphorous (p=0.124) in Puware Khola
sub-watershed since p value is greater than 0.005 but it was
significant difference in potassium (p=0.004), since p<0.005. In case
of Chituwa Khola sub-watershed, it was no significant difference in
nitrogen (p=0.488), since p value is greater than 0.005 while there
was significant difference in phosphorous and potassium (p=0.000)
and (p=0.001) respectively Table 7.
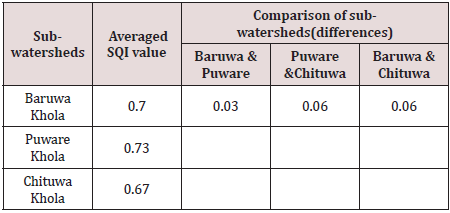
The Table 8 showed the comparison of SQI among subwatersheds.
The differences in SQI values between Baruwa Khola
and Puware Khola was 0.03 whereas this was 0.06 between Puware
Khola and Chituwa Khola and similar difference was between
Baruwa Khola and Chituwa Khola.
Similar study was done by Ghimire, Bhatta, Pokhrel, & Shrestha
[7] where Soil quality index (SQI) was determined on the basis of
the soil physiochemical parameters. Soil properties like soil pH,
organic matter (OM), available potassium (AK), total nitrogen (TN)
and available phosphorous (AP) were significantly affected by land
uses types. Forest soil had the highest soil quality index (0.82)
followed by khet (0.64), bari (0.66) and degraded land (0.40).
Comparing the SQIs between the forest lands, agriculture land,
Kharland land, alluvial soil colluvial soil according of their soil depth
0-10 cm and 10-30 cm the results validated that anthropogenic
disturbances and heavy grazing could be reason of significantly
lower the soil quality levels. Awasthi, Singh, & Sitaula [8] reported
that SQI value was the highest at undisturbed forest land (0.69) and
lowest at Khet land (0.17) in Mardi watershed of Middle Mountain.
Forest was about twice as high as that of forest with free grazing,
because in the latter forest category people extract firewood, timber,
leaf litter and fodder leading to the negative impact on soil quality
[9-21]. 10-30 cm lands with lowest SQI score of 1.03 indicated
immediate need for soil restoration and fertility management
practices for sustainable productivity [22-36].
Similar study was done by Nepal & Mandal [6] showed that the
soil quality index of were the best having the values nearly 1.39
(0-10 cm) and 1.06 (10-30 cm) in Bade khola catchment of Doti
district where as 1.3 (0-10 cm) and 1.432 (10-30 cm) in Brindaban
catchment of Baitadi district [37].
Conclusion and Recommendation
The highest amount of soil nutrient (N and P) was found in 0-10 cm soil depth, getting decrease in 10-20cm and 20-30 cm depth respectively whereas the highest potassium was found in (20-30) cm depth followed by (10-20) cm and (0-10) cm respectively. The soil texture of Baruwa Khola and Chituwa Khola sub-watershed was found to be loam whereas the texture of Puware Khola subwatershed was found to be loamy sand. The percentage of sand was found to be highest in Puware Khola among the sub-watersheds but less clay % in Puware Khola. The soil quality index of Puware Khola was the highest and it was followed by Baruwa Khola and Chituwa Khola sub-watersheds. This all indicated the fair soil quality. The soil quality index tools shall be used to assess the quality of soil in different sub-watersheds in Nepal. The soil quality index and forest condition can be used together for the option of the sub-watershed management.
References
- Karlen DL, Mausbach MJ, Doran JW, Cline RG, Harris RF, and et al., (1997) Soil Quality: A Concept, Definition, and Framework for Evaluation (A Guest Editorial). Soil Science Society of America Journal 61(1): 4-10.
- Amacher MC, O’Neill KP, Perry CH (2007) Soil vital signs: A new soil quality index (SQI) for assessing forest soil health. USDA Forest Service - Research Paper RMRS-RP.
- Warkentin BP, Fletcher HF (1977) Soil quality for intensive agriculture. Proceedings of the International Seminar on Soil Environment and Fertility Management in Intensive Agriculture .
- Mukherjee A, Lal(2014) Comparison of soil quality index using three methods. Plosone 9: 8.
- Doran JW, Parkin TB (1994) Defining and assessing soil quality. Defining Soil Quality for a Sustainable Environment. Proc. Symposium, Minneapolis MN 35.
- Nepal S, AsheshwarMandal R (2018) Soil quality index and nutrient in Badekhola and Brindaban catchments, Nepal. MOJ Ecol Environ Sci 3(1): 54-57.
- Ghimire P, Bhatta B, Pokhrel B, Shrestha I (2018) Assessment of soil quality for different land uses in the Chure region of Central Nepal. Journal of Agriculture and Natural Resources 1(1).
- Awasthi KD, Singh BR, Sitaula BK (2005) Profile carbon and nutrient levels and management effect on soil quality indicators in the Mardi watershed of Nepal. ActaAgriculturaeScandinavica Section B: Soil and Plant Science 55(3):192-204.
- Awasthi KD, Tiwari KR, Balla MK, Sitaula BK, Singh BR,Pandit K (2007) Plot level runoff, soil and nutrient loss in upland rainfed terraces (Bari) and aspect-wise soil quality of different land uses in PokhareKhola watershed, Nepal. International Journal of Ecology and Environmental Sciences 32(2):105-114.
- Bouma J (1997) Soil Environmental Quality: A European Perspective. Journal of Environmental Quality.
- Burns RG, Nannipier P, Benedetti A, Hopkins DW (2009) Defining soil quality. In Microbiological methods for assessing soil quality.
- De la Paz Jimenez M, De la Horra AM, PruzzoL,Palma RM (2002) Soil quality: A new index based on microbiological and biochemical parameters. Biology and Fertility of Soils 35: 302-306.
- Dexter AR (2004) Soil physical quality: Part I. Theory, effects of soil texture, density, and organic matter, and effects on root growth. Geoderma 120(3-4): 201-214.
- Drobnik T, Greiner L, Keller A, Grêt-Regamey A (2018) Soil quality indicators -From soil functions to ecosystem services. Ecological Indicators 91: 151-169.
- Friedman D, Hubbs M, Tugel A, Seybold C, Sucik M (2001) Guidelines for soil quality assessment in conservation planning. In Natural Resources Conservation Service Soil Quality Institute.
- Glover JD, Reganold JP,Andrews PK (2000) Systematic method for rating soil quality of conventional, organic, and integrated apple orchards in Washington State. Agriculture, Ecosystems and Environment 80(1-2): 29-45.
- Islam KR, Weil RR (2000) Land use effects on soil quality in a tropical forest ecosystem of Bangladesh. Agriculture, Ecosystems and Environment 79(1): 9-16.
- Karlen DL, Mausbach MJ, Doran JW, Cline RG, Harris RF, and et al., (1997) Soil quality: a concept, definition, and framework for evaluation. Soil Science Society of America Journal.
- Karlen D, Andrews SS, Doran JW (2001) Soil quality: Current concepts and applications. Advances in Agronomy 74: 1-40.
- Karlen DL, Stott DE (1994) Defining Soil Quality for a Sustainable Environment - A Framework for Evaluating Physical and Chemical Indicators of Soil Quality. In Soil Science Society of America.
- Karlen DL, Wollenhaupt NC, Erbach DC, Berry EC, Swan JB, and et al., (1994) Long-term tillage effects on soil quality. Soil and Tillage Research 32(4): 313-327.
- Karlen Douglas L, Ditzler CA, Andrews SS (2003) Soil quality: Why and how? Geoderma 114(3-4): 145-156.
- Lal R (2000) Soil erosion and carbon dynamics on grazing land. In the Potential of U.S. Grazing Lands to Sequester Carbon and Mitigate the Greenhouse Effect.
- Lal R (2002). Soil carbon dynamics in cropland and rangeland. Environmental Pollution 116(3): 353-362.
- Lal R (2004) Soil carbon sequestration to mitigate climate change. Geoderma 123(1-2): 1-22.
- Larson WE, Pierce FJ (1994) The dynamics of soil quality as a measure of sustainable management. Defining Soil Quality for a Sustainable Environment. Proc. Symposium, Minneapolis.
- Nortcliff S (2002) Standardisation of soil quality attributes. Agriculture, Ecosystems and Environment 88(2): 161-168.
- PhamTG, Nguyen HT, Kappas M (2018) Assessment of soil quality indicators under different agricultural land uses and topographic aspects in Central Vietnam. International Soil and Water Conservation Research 6(4): 280-288.
- Raiesi F, Kabiri V (2016) Identification of soil quality indicators for assessing the effect of different tillage practices through a soil quality index in a semi-arid environment. Ecological Indicators 71: 198-207.
- Santorufo L, Van Gestel CAM, Rocco A, Maisto G (2012) Soil invertebrates as bioindicators of urban soil quality. Environmental Pollution 161: 57-63.
- Van Es HM (1995) Soil and Water Quality: An Agenda for Agriculture. Journal of Environmental Quality.
- Wang X, Gassman PW, Williams JR, Potter S,Kemanian AR (2008) Modeling the impacts of soil management practices on runoff, sediment yield, maize productivity, and soil organic carbon using APEX. Soil and Tillage Research 101(1-2): 78-88.
- Wang Xiaoju, Gong Z (1998) Assessment and analysis of soil quality changes after eleven years of reclamation in subtropical China. Geoderma 81(3-4): 339-355.
- Wienhold BJ, Andrews SS,Karlen DL (2004) Soil quality: A review of the science and experiences in the USA. Environmental Geochemistry and Health 26(2-3): 89-95.
- Yan S, Singh AN, Fu S, Liao C, Wang S, et al. (2012) A soil fauna index for assessing soil quality. Soil Biology and Biochemistry 47: 1-220.
- Andrews SS, Karlen DL, Mitchell JP (2002) A comparison of soil quality indexing methods for vegetable production systems in Northern California. Agriculture, Ecosystems and Environment 90(1): 25-45.
- Armenise E, Redmile-Gordon MA, Stellacci AM, Ciccarese A, Rubino P (2013) Developing a soil quality index to compare soil fitness for agricultural use under different managements in the mediterranean environment. Soil and Tillage Research 130:91-98.

Top Editors
-

Mark E Smith
Bio chemistry
University of Texas Medical Branch, USA -

Lawrence A Presley
Department of Criminal Justice
Liberty University, USA -

Thomas W Miller
Department of Psychiatry
University of Kentucky, USA -

Gjumrakch Aliev
Department of Medicine
Gally International Biomedical Research & Consulting LLC, USA -

Christopher Bryant
Department of Urbanisation and Agricultural
Montreal university, USA -

Robert William Frare
Oral & Maxillofacial Pathology
New York University, USA -

Rudolph Modesto Navari
Gastroenterology and Hepatology
University of Alabama, UK -

Andrew Hague
Department of Medicine
Universities of Bradford, UK -

George Gregory Buttigieg
Maltese College of Obstetrics and Gynaecology, Europe -

Chen-Hsiung Yeh
Oncology
Circulogene Theranostics, England -
.png)
Emilio Bucio-Carrillo
Radiation Chemistry
National University of Mexico, USA -
.jpg)
Casey J Grenier
Analytical Chemistry
Wentworth Institute of Technology, USA -
Hany Atalah
Minimally Invasive Surgery
Mercer University school of Medicine, USA -

Abu-Hussein Muhamad
Pediatric Dentistry
University of Athens , Greece

The annual scholar awards from Lupine Publishers honor a selected number Read More...


