Lupine Publishers Group
Lupine Publishers
Menu
ISSN: 2641-6794
Research Article2641-6794 
Evaluating Ecological Values and Carbon Stock in Trees Outside Forests (TOFs) in Terai Region of Nepal Volume 5 - Issue 4
Yogendra Yadav1,2*, BirBahadurKhanal Chhetri3, Santosh Raymajhi3, Krishna RajTiwari3, Bishal K Sitaula4 and Bikram Singh5
- 1Tribhuvan University, Institute of Forestry, Office of the Dean, Pokhara, Nepal
- 2Tribhuvan University, Institute of Forestry, Hetauda Campus Hetauda, Nepal
- 3TribhuvanUniversity, Institute of Forestry, Pokhara Campus, Nepal
- 4Norwegian University of Life Sciences, Norway
- 5Tribhuvan University, Institute of Forestry, Hetauda Campus Hetauda, Nepal
Received: July 21, 2020; Published: August 04, 2020
Corresponding author:YogendraYadav, Tribhuvan University, Institute of Forestry, Office of the Dean, Pokhara, Nepal
DOI: 10.32474/OAJESS.2020.05.000216
Abstract
The ecological and environmental functions performed by Trees Outside Forests are less concern in scientific community. Thus, this research was objectively conducted to assess importance value index (IVI), tree species diversity and carbon stock density. Dhangadimai Municipality of Siraha District, Nepal was selected as study site. The map of TOF was prepared and further categorized it into Group and Scattered plantation. Altogether 60 samples, specifically each 30 from Group and Scattered plantation, were collected using stratified random sampling measuring the diameter and height of the plants. Moreover, 240 soil samples were collected from 0-10, 10-30, 30-60 and 60-100 cm depths. The importance value index was estimated summing the value of relating basal area, density, and dominancy as well as Shannon wieners index, Simpson’s diversity and Sorensen’s Similarity Index were calculated. The biomass was calculated using equation of Chave et al., and it was converted into carbon. Walkley and Black Method was used to soil carbon. Total 22 and 33 tree species were found in Group and Scattered plantations, respectively. Mangifera indica, Eucalyptus camaldulensis, Dalbergia sissoo and Artocarpus lakoocha were prime tree species found in plantation site. The estimated IVI of Mangifera indica was the highest with 102.32 while this was the lowest 7.98 of Syzium cumunii in Group plantation but this value was the highest 64.46 of Dalbergia sissoo in scattered plantation. The Simpson and Shannon Wiener indices were 0.70 and 0.90 respectively in group plantation which were 0.84 and 2.45 correspondingly in scattered plantation. The biomass and carbon were approximately 447.14 ton/ha and 210.15ton/ha respectively in Group plantation. Calculated soil carbon was higher 51.49 ton/ha in scatter plantation. The highest soil carbon was about 16.63±2.14 ton/ha in 0-10 cm depth in scatter plantation and it was decreasing according to soil depth in scattered plantation. The study will be useful for policy formulation regarding biodiversity in TOF.
Keywords:Biomass, Carbon stock, Index of Value Index, Trees Outside Forests, Tree species diversity
Introduction
The life on the earth is interlinked with the available natural
resources on the earth. Thus, natural resources are the key
ornament. Tree resource whether it is inside the forest or outside
the forest is one of the key components of natural resources because
it performs several functions. Some vital functions are ecological
importance, biodiversity conservation and carbon sequestration
Trees available on lands but that is not considered as ‘forests’ or
‘other wooded land’ according to definition of forest is known
as TOF (FAO 2005; Kumar 2006)[1,2]. Importantly, productive,
and protective functions are major categories which a forest of TOF performs as a broad. More specific, productive functions of
TOF are production of fruits and timber, firewood and fodder in
orchards, fields, and other agroforestry systems. On the other
hand, protective functions comprise ecological and beautifying
the landscape for instance trees around in parks, cities, and urban
areas and even around the houses. Generally, the TOF is designed
as discontinuously on farmland preferably known as scattered
plantation while continuous planting pattern of trees literally
considered as group and strip plantation (Alexandre et al. 1999)[3].
On the other hand, another important aspect of TOF forms the
linkage and inter linkage with the disciplines. The most popular
disciplines of TOF are agroforestry, Tongya considering the
agronomy, silvipasture, horticulture, in home garden, etc in global
context. Basically, the TOFs are one of crucial part of subsistence
farming systems in developing country in particular including
Nepal (Regmi and Garforth 2010)[4]. It TOF has ignorable role
and that is environmental balance in rural areas at local, national,
and global scales (Singh and Chand 2012; de Foresta et al. 2013)
[5,6]. Another fact related TOF is land available or coverage or
range, it is more growing in rural farmland in Asia to meet their
requirement of timber, firewood, and fodder in certain level. . The
forest resource assessment includes the TOF as important natural
resource basically defining this term like in less than 20 m wide
and available on the land 0.5 ha area in Nepal’s context (Gurung
et al. 2015)[7]. It is realizable fact about the common use of forest
and TOF in Asian continents India, Pakistan, Bangladesh, Nepal,
Bhutan, and Sri Lanka in particular. In this context, the TOFs in this
content contribute significant whether it is about the ecological
value including biodiversity and carbon sequestration. In fact, total
area of this continent is of 4.13 million sq km with huge population
1,000 million approximately (Gurung and Temphel 2015)[8]. The
acceptable fact is only 20 percent area is under the forest in this
continent and minimum and maximum forest covering is 3.8 and 70
percent in Pakistan and Bhutan respectively. So, function of TOFs as
ecological and environment is necessarily and importantly valuable
(Schroeder 1994; Rawat et al. 2004Zhu et al. 1991)[9,10].
TOF is highly precious where the forest resource is scare and
local people access on it is limitedly or probably restricted. This
theory is applied in some districts in Terai, Nepal Amatya [11] and
Siraha is one of best example in Nepal. Therefore, government Nepal
continuously conducted the private plantation (TOF) promotion
programme especially in Siraha district to meet the major demand
of timber, fuelwood, and fodder (Gilmour1997; Garforth et al.
1999; Regmi1988)[12-14]. Planting the trees as TOFs performs
ecological role and carbon sequestration in any part of the world
FAO, Singh, and Chand& Herrera [ 5,15&16] including Nepal even in
Siraha district as well and which has great scientific value. However,
research regarding importance value index, tree species diversity,
and carbon stock in TOF is not so far done. Therefore, this study
was objectively done to evaluate the importance value index, tree
species diversity index and carbon stock density in TOF.
Materials and Methods
Study Area
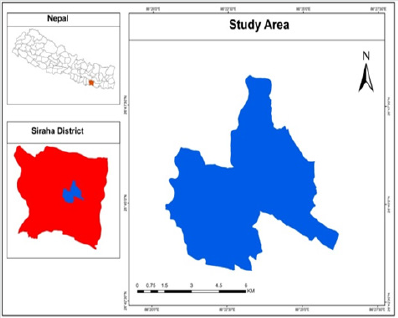
The ward no. 4, 5, 6 , 9,10 and 11of Dhangadimai Municipality of Siraha District of Nepal was selected as the study site Figure 1.The Latitude and Longitude range from 26.720 to 26.80° South and 86.34° to86.43° East respectively but area of study site was 8,034.7Km2. The overall climate is tropical having average annual temperature of 24.4 °C and total rainfall of 1275 mm [17]. In total approximately 22644 people are living in the study area (CBS, 2011)(Figure 2&3).
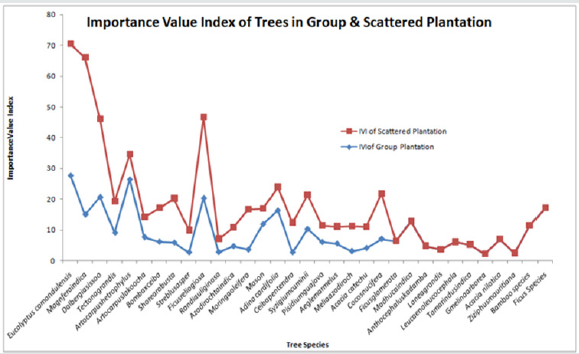
Figure 2: Calculation of IVI of TOFs species in Group and scattered plantation
Source: Field Survey, 2018.
Methods
The preliminary survey, sampling design, data collection and its analysis were performed to accomplish this task. Preliminary survey was done to find TOF area so more specific some farmlands, roadside plantation, village woodlot, plantation on bank, orchard, and home garden were visited and sites were noted. Next, participatory map was prepared to identify and show TOF areas. Furthermore, the areas were surveyed using GPS receiver and maps were prepared accordingly. Then, the sites were stratified FSI, Rawat & FAO [10,18 & 19] into group and scattered according to nature of plantation.First of all, 30 samples were allocating on the each maps of Group and scattered plantation. Furthermore, the GPS coordinates of all sample plots were uploaded in GPS receiver to navigate in the field. The plots having 32 X 32 m2 area were laid in group plantation and these plots 50 X 50m2 were established in scattered plantation for biophysical measurement which were and counting. So, Diameter at Breast Height (DBH >5 cm) and height were recorded, plant species were noted, and their number were counted. The soil corer was used to soil samples from 0-10, 10-30, 30-60, 60-100cm depths Chabbra [20]. Total 240 soil samples were collected from the Centre of laid plot.
The importance value was calculated summing the relative density, basal area, and dominance.
Importance value index (IVI) was calculated using:
IVI = Relative density ( N/ha)+ Relative BA/ha +Relative
dominance (CA/ha)..................(i)
The total value of IVI is 300. The value of total p percentage
N/ha, percentage BA/ha and percentage CA/ha is 100% each [21].
The biodiversity indexes, Shannon wieners index, Simpson’s
diversity and Sorensen’s Similarity Index were calculated using
following equation.
Shannon wieners index (H’) = -Σ Pi log (pi)........................................
................................. (ii)
Simpson’s diversity, (D) = 1- Σ Pi2...........................................................
..............................(iii)
Sorensen’s Similarity Index, SSI = 2c/ (S1 + S2)................................
................................... (iv)
Whereas, Pi= the relative abundance of each species, i.e.; the
proportion of individuals of a given species relative to the total no.
of individual in the community, S1= total no. of species recorded in
the first community and S2= the total no. of species recorded in the
second community,
c =the no. of species common to both communities (Baral and
Katzensteiner2009; Balmer2002).
The basal area, volume and biomass was calculated.
Basal area= pD2´……………………………………………………………………
……….(v)
Volume= pD2´h ´¦¦/4………………………………………………………………
……… (v)
Whereas p= 3.14,D = diameter at breast height (cm),h = height
of the tree (m),¦¦ = form factor (0.5) ,Tree per ha = Total no. of tree
/ Total area [22].
The equation given by Chave [23] was applied to estimate above
ground biomass and carbon stock of the TOF:
Above ground tree biomass in kg (AGTB) =
0.0509´r*D2*h……………………………….(vi)
Above ground carbon content =
0.475×AGTB……………………………………………… (vii)
Where, r=Dry wood Density (gc / m3), D=Diameter at breast
height (cm), H= height of tree (m)
Carbon = Biomass x carbon %...................
………………………………………………… (viii)
The calculated biomass was further estimated using the default
value 0.47 (MacDicken1997).
Soil Organic Carbon (SOC):
Soil organic carbon was analysed using Walkley and Black in
the lab [24].
SOC = ρ* D* C%
Whereas SOC = soil organic carbon stock per unit area [t /ha], ρ
= soil bulk density [g cm-3],
D = the total depth at which the sample was taken [cm], and
%C = carbon concentration [%].
Results
Importance Value Index (IVI) of TOFs species in Group and Scattered plantation
The importance value index was varying according to tree species recorded in TOF. Total 22 and 33 tree species were recorded in group and scattered plantations respectively and 20 species were common in both plantations. The Mangifera indica performed the highest IVI with 51 but it was lowest of Mason having 5.0 in group plantation. On the other hand, it was the highest IVI of Eucalyptus comandulensis with 27.8 but the least IVI was only 2.2 of Gmelina arborea. Furthermore, the first rank of recorded of Mangifera indica in group plantation while the first rank was of Eucalyptus comandulensis in scattered plantation Table 1.
Tree species richness in Group and scattered plantation
The scattered plantation was rich in plant diversity as compared
to group plantation. Specifically, Simpson’s and Shannon Wiener
indices were 0.84 and 2.45 respectively in scattered plantation and
these indexes were 0.70 and 0.90 respectively in group plantation.
The Mann- Whitney U and Wilcoxon test showed that there were
significant differences in values of Simpson Index and Shannon
Wiener Index between group and scattered plantation at 95%
confidence level since P-value was less than 0.05 (P=0.00).Besides
this, the Sorensen similarity index used to assess the similarity
in both types of plantation (group and scattered plantation). The
calculated SSI value of group plantation and scattered plantation
was 0.020.
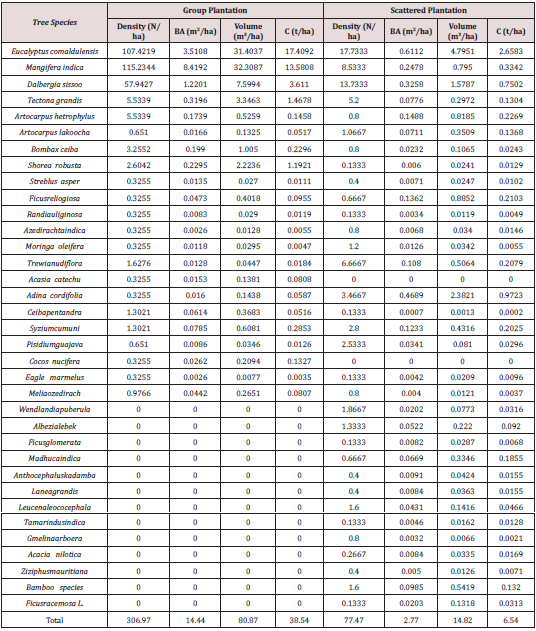
The density, basal area, volume, and carbon stock were varied
according to species in group and scattered plantation in TOF. The
highest density was recorded 115.23/ha having basal area 8.42
m2/ha of Magnifera indica in group plantation It was followed
by density107per ha having basal area 3.51 m2/ha of Eucalyptus
camaldulensis. So, the volume was also highest around 32.31 m3/ha
of Mangifera indica in group plantation. But the estimated biomass
and carbon stock was the highest of Eucalyptus comaldulensis with
37.041 Ct/ha and 17.409 Ct/ha respectively in group plantation
(Tables 2 & 3).
The highest density was around 17.73/ha with basal area 0.61 m2/ha of Eucalyptus camaldulensis which was followed by Dalbergia sissoo having the density and basal area 13.73 per ha and 0.33 m2/ha respectively in scattered plantation, So, the stem volume, biomass and carbon stock was found to be highest of Eucalyptus camandulensis with 4.79 m3/ha, 5.6559 ton/ha and 2.6583 ton/ ha respectively. The mean ± SE of biomass and carbon were 74.52 ± 20.39 and 35.03 ± 9.58respectively in group plantation which were only 1.33 ± 0.47 and 0.63 ± 0.22 respectively in scattered plantation.
Soil Organic Carbon
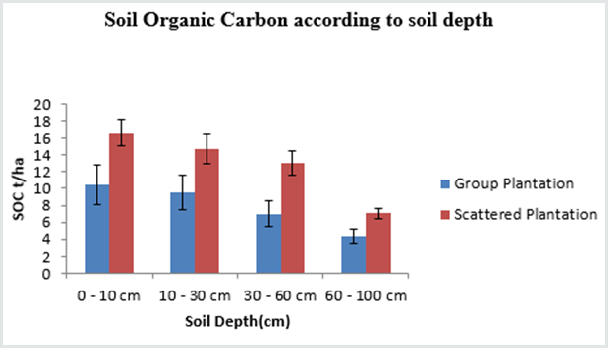
The soil carbon was varying according to group plantation and scattered plantation. The soil carbon was higher 51.5 ton/ ha in scattered plantation, but it was only 31.28 ton/ ha in group plantation . The highest record of soil carbon was approximately 16.63±1.15 ton/ha in 0-10 cm but it was the lowest only 7.06±0.64 ton/ha 60-100 cm soil depth in scattered plantation.
Statistically, t-test showed that, there was a significant difference in soil carbon at 0-10 and 10-30 cm depths between group and scattered plantation at 95% level of confidence which was slightly insignificant at higher depths. One-way ANOVA and Tokey’s showed that, that there was a significant difference in the average SOC (p < 0.05) according to soil depths.
Discussions
Tree Importance Value Index (IVI) and Species Diversity
The IVI record of Mangifera indica species was found to be
102.32 the highest in group plantation but this of Dalbergia sissoo
was found to be 64.46 the highest IVI in scattered plantation. The
reason behind this was preference of the species by the farmers
in group and scattered plantation. The study done by Mandal
[25] in collaborative forest showed that the highest IVI was of
Shorea robusta. The authors specified, the IVIs in Tuteshwarnath
Bardibash – Gadhanta and Banke Mahara CFMs they were 68.59,
62.22, 61.65 respectively. Another study done in India showed that
the Importance value index of (IVI) of Acacia catechu was 46.47,
Albizia amara was 53.63, Anogeiss uslatifolia was 24.10 [26]. The
IVIs of Ficus ovate was some species were 43.56, and this value of
Eucalyptus camaldulensis was 10.11[27].
Singh [28] did research on IVI and carbon stock separately
ignoring rank of IVI in the forest. Another study done by Balinga
[29] in Africa showed that, the IVIs of Alstonia boonei, Strychnos
innocua and Albizia adianthifolia were 16.86, 17.46 and 17.33,
respectively. Another study done by Meng [30] in China showed
that the IVIs of Lannea grandis,Dillenia pentagyna and Syzygium cumini was 19.78, 16.71 and16.58, respectively. The study done
in Nepal showed IVI of Shorea robusta was 259.2, IVI of Bombax
ceiba was 96.84 [31]. However, it was quite gap in ranking of forest
species based on IVI and carbon of plant species in Tarai, Nepal.
The record of DFO [17] showed that Dalbergia sissoo, Melia
azedarach, Albizia spp. and Mangifera indica (Mango) are the most
common plantation species in Terai. Diverse planted tree species
in TOF add valuable diversity to sustain the farming system in long
term [13,32]. Same principles were supported in Nepal’s private
plantation as well Gilmour, Regmi & Garforth [12-14] so there is
increasing trend of plantation in as an agro-forestry model [33,34].
The tree biodiversity TOF in our study sites. The research done by Bashar [35] showed that Shanon diversity index was very high 3.24 of fruit species in Bangladeshi homegardens. Another research done by Sellathurai [36] revealed that for Sri Lanka this index was 3.93. Similar research done by Das [37] depicted that there were more than 60 species in farmland of eastern Nepal. Similar research done by Carter [33] revealed 101 tree species in a study conducted in middle hills of Nepal. There were 127 tree species in the midhills and simply reveals that farmland in the hilly region conserve more tree species than other region like Terai Kharal and Oli [38]. The study done by Goenster [39], showed that there were 103 plant species in agroforestry in Africa. The authors found that, mean Shannon index was 1.32 but this index was 0.8 in indigenous fruit tree species. The values were very close with the findings of our research. .These values were differed from our study. The reason behind this may be because of limit choice of farmer to plant the tree species. The farmers are more interested to plant Mangifera indica in group plantation while they are planting more Eucalyptus camaldulensis for fruits and getting timber fastly respectively. However, the study done by Amatya and Shresth [40] stated that farmers in Terai have planted fruits species as Mangifera indica, Artocarpus heterophyllus and Syzium cumuni in their farm while Eucalyptus camaldulensis and Dalbergia sissoo, Tectona grandis are as forest tree and timber species in Tarai, this finding is matching with our study. The previous study showed that total number of species was 35 in agro-forestry system in India [41].The reasons of similarity and differences in the findings, may be because of the effect of bioclimatic and geographical factors too Nicolas [42]. Another reason may, hilly farmers have more choice to fodder trees in Nepal because they have more cattle [43].
Growing Stocks, Biomass and Carbon stocks
The growing stock (volume) of TOF was varied according to number of stem/ha, age of stem, soil condition, species characteristic and silvicultural operations carried out for the TOF. The estimated growing stock was 178 m3/ha (DFRS, 2014), according to national inventory which is contrary to our finding. The research done by Mandal [25] stated that 148ton/ha,77.71ton/ ha and 30.34 ton/ha carbon biomass of 8 years of Eucalyptus camaldulensis in Sita community plantation forest, Shreepur public plantation and Bisbitty public plantation forest respectively. Another study showed that the carbon stock of 7 year plantation of Eucalyptus camaldulensis was 35t·ha-1 in a very good site [40]. The study done by Sah [44] showed that the carbon stock was varied particularly 57 ton/ha in Newardanda community forest, 81.28 ton/ha in Markawura community forest and 50.03 ton/ha in Galtar community forest, these findings are somehow similar to our research work.
Soil Organic Carbon (SOC)
The soil carbon was found higher in scattered plantation compared to group plantation; the probable reason behind this may be due to use of compost fertilizers as well as no or limit collection of litter. Another important aspect of this research showed that the soil carbon is decreasing according to soil depths which are supported by several studies such as findings of Shukla [45] and IPCC [46] were similar. Moreover, the soil carbon is rich in agroforestry system than it in agriculture areas [32]. Some studies done by Gautam [47] showed that organic carbon content ranges from 33.2 to 55.5 t ha-1 and from 35 to 74.6 t ha-1 in annual cropping system and in the plantation orchard respectively [46-53]. More specific, soil organic carbon was the highest in naturally grown forest with 53.2 t per ha which was followed by this in vegetable grown field having 52.6 t ha-1. Additionally, it was 34 t ha-1 soil carbon at 0-10 cm depth in grazing land which was followed by the value 20 t ha-1 in cultivated upland (Bari), (14 t ha-1 in forestland and only 12 t ha-1 in level terraces (Khet) Gautam [45]. Some of these findings are matching with our research result may be due to similar geographical and climatic condition [54-56].
Conclusion
More tree species diversity was found in scattered plantation than it in group plantation. Major tree species of group plantation were Mangifera indica, Dalbergia sisoo, Tectona grandis and Eucalyptus camaldunsis. The tree diversity was higher in scattered plantation than it in group plantation. The IVI record of Mangifera indica was found to be highest in group plantation and this of Eucalyptus camaldulensis was the highest in scattered plantation. The basal area, volume and carbon stock was found to be higher in group in comparison to scattered plantation. The soil carbon was rich in agroforestry system and it was also found high in scattered plantation. Therefore, this study will be useful document for policy maker and scientific community especially interest of TOF. However, intensive studies are required in agroforestry system in other parts of Nepal.
References
- FAO (2005) Tree outside forest; Food and Agricultural Organization of the United Nations.
- Kumar O (2006) Valuation and evaluation of trees outside forest (TOF) in India. Forest Survey of India, Kaulagarh Road PO: IPE Dehradun, India.
- Alexandre C, Lecourtois M, Vincent J (1999) Wingless and Hedgehog pattern Drosophila denticle belts by regulating the production of short-range signals. Development 126(24): 5689-5698.
- Regmi BN, Garforth C (2010) Trees outside forests and rural livelihoods: a study of Chitwan District, Nepal. Agroforestry systems, 79(3): 393-407.
- Singh K, Chand P (2012) Above-ground tree outside forest (TOF) phytomass and carbon estimation in the semi-arid region of southern Haryana: A synthesis approach of remote sensing and field data. Journal of earth system science 121(6): 1469-1482.
- Deforesta H, Temu A, Boulanger D, Feuilly H, Gauthier M (2013) Towards the assessment of trees outside forests: a thematic report prepared in the Framework of the Global Forest Resources Assessment 2010. Food and Agriculture Organization of the United Nations.
- Gurung MB, Bigsby H, Cullen R, Manandhar U (2015) Estimation of carbon stock under different management regimes of tropical forest in the Terai Arc Landscape, Nepal. Forest Ecology and Management 356: 144-152.
- Gurung T, Temphel KJ, (Eds.), ( 2015) Technological advancement in agroforestry systems: Strategy for climate smart agricultural technologies in SAARC Region. Natundhara Printing Press.
- Schroeder PW (1994) The transformation of European politics, 1763-1848.Oxford University Press.
- Rawat JK, Dasgupta S, Kumar R, Kumar A, Chauhan KVS (2000) Trainning Mannual on Assessment of Trees Outside Forests (TOF).Forest Survey of India. Dehradun, India.
- Amatya SM, Cedamon E, Nuberg I (2018) Agroforestry systems and practices in Nepal. Agriculture and Forestry University (AFU).
- Gilmour D (1997) Rearranging trees in the landscape in the middle hills of Nepal. Farms, Trees and Farmers: Responses to Agricultural Intensification 21-42.
- Garforth CJ, Malla YB, Neopane RP, Pandit BH (1999) Socioeconomic factors and agroforestry improvements in the hills of Nepal. Mountain Research and Development 19(3): 273-278.
- Regmi BN (1998) Program dynamics of the Nepal Agroforestry Foundation in Majhitar of Dhading District, Nepal.
- FAO (1999) State of the world’s Forest 1999. Rome, Italy, FAO of the United Nations.
- Herrera B (2003) Classification and modeling of trees outside forest in Central American landscapes by combining remotely sensed data and GIS.
- DFO (2004) Private forest monitoring and evaluation report (2004/2005). District Forest Office, Siraha, Nepal.
- FSI (2011) India State of Forest Report. Dehradun, India: Forest Survey of India.
- FAO (2010) Global Forest Resources Assessment 2010. FAO forestry paper 163: 10-15.
- Chhabra A, Palria S, Dadhwal VK (2003) Soil organic carbon pool in Indian forests. Forest Ecology and Management 173(1-3): 187-199.
- Kurtis JT, Mclntosh RP (1950) Importance value index of tree species. Ecology 31: 434-455.
- DOF (2005) Forest Cover Change Analysis of the Tarai Districts. Department of Forests, Kathmandu, Nepal.
- Chave J, Andalo C, Brown S, Cairns MA, Chambers JQ, and et al., (2005) Tree allometry and improved estimation of carbon stocks and balance in tropical forests. Oecologia 145(1): 87-99.
- Walkley AE, BlackJ A (1934) An Examination of the Method for Determining Soil Organic Method, and Proposed Modification of the Chromic Acid Titration Method. Soil Science 37: 29-38. 00003.
- Mandal RA, Yadav BK, Jha SK, Giri RK ( 2014) Evaluating Carbon Stocks and Plant Biodiversity in Tree Outside Forests of Tarai, Nepal, Proceedings of International Conference on Forests, Soil and Rural Livelihoods in a Changing Climate.
- Devagiri GM, SantoshHubballi, GirishPujar MSR, Murthy, ShivamTrivedi, and et al., (2012). Mapping and Characterization of Bio-rich Areas Using Satellite Remote Sensing in Southern Karnataka, India. International Journal of Environmental Sciences 1 (2): 105-117.
- Abebe W, Dessalegn F (2014) Floristic Composition and Structure of Woody Vegetation along Lagadara River in South Ethiopia, Research Journal of Pharmaceutical, Biological and Chemical Sciences 5(2): 381-395.
- Singh H, Kumar K, Sheikh M ( 2009) Distribution pattern of Oak and Pine along altitudinal gradients in Garhwal Himalaya. Nature and Science 7(11): 81-85.
- Balinga MP, Zida MB, Dourma M, Batawila K, Akpagana K (2013) Woody species diversity and important value indices in dense dry forests in Abdoulaye Wildlife Reserve (Togo, West Africa) International Journal of Biodiversity and Conservation 5(6): 358-366.
- Meng J, Lu Y, Lei X, Liu G (2011) Structure and floristics of tropical forests and their implications for restoration of degraded forests of China's Hainan Island .Tropical Ecology 52(2): 177-191.
- Dangol CM, Shivakoti P (2001) Species composition and dominance of plant communities of in western Chitwan, Nepal. Nepal Journal of Science and Technology 3: 69-78.
- Nair PKR (1993) An introduction to agroforestry. Kluwer, Dordrecht.
- Carter EJ (1992) Tree Cultivation on Private Land in the Middle Hills of Nepal: Lessons from Some Villagers of Dolkha District. Mountain Research and Development 12(3): 241-255.
- Gilmour DA, Nurse MC (1995) Farmer initiatives in increasing tree cover in Central Nepal. In: Saxena NC, Ballabh V (Eds.), Farm forestry in South Asia. Sage, New Delhi pp. 87–103.
- Bashar MA (1999) Homegarden Agroforestry: Impact on Biodiversity Conservation and Household Food Security. A Case Study of Gazipur district, Bangladesh. M. Sc. Thesis. Agricultural University of Norway.
- Sellathurai P (1997) Homegarden Agroforestry and Sustainability in Kandy District, Sri Lanka. Agricultural University of Norway.
- Das AN (1998) Socioeconomics of Bamboos in Eastern Nepal. Ph.D. thesis.Aberdeen University, Scotland, UK.
- Kharal DK, Oli BN (2008) An estimation of tree species diversity in rural farmland of Nepal. BankoJanakari 18(1): 3-10.
- Goenster S, Wiehle M, Kehlenbeck K, Jamnadass R, Gebauer J and et al., (2009) Indigenous fruit trees in homegardens of the Nuba Mountains, Central Sudan: tree diversity and potential for improving the nutrition and income of rural communities. In I All Africa Horticultural Congress 911: 355-364.
- Amatya SM, Shresth KR (2002) Nepal Forestry Handbook. Forestry Research Programme for Asia and the Pacific. Food and Agriculture Organization of the United Nations, Bangkok publication No.32.
- Tynsong H, Tiwari BK (2010) Plant diversity in the homegardens and their significance in the livelihoods of War Khasi community of Meghalaya, North-east India. Journal of Biodiversity 1(1): 1-11.
- Nicolas MPB, Barchyn (2009) Williston Basin Project (Targeted Geoscience Initiative II): Summary Report Mesozoic Stratigraphy, Mapping and Hydrocarbon Assessment, Southwestern Manitoba. Manitoba Geological Survey.
- Pandit BH, Shrestha KK, Bhattarai SS (2014) Sustainable local livelihoods through enhancing agroforestry systems in Nepal. Journal of forest and Livelihood 12(1): 47-63.
- Sah SP, Sharma S, Mandal RA (2019) Comparison of Carbon Stock in Chure, Bhawar and Terai,Nepal. International Journal of Scientific & Engineering Research 10(12).
- Shukla MK, Lal R, Ebinger M (2006) Determining soil quality indicators by factor analysis. Soil and Tillage Research 87(2): 194-204.
- IPCC (2000) The intergovernmental panel on Climate Change, Special Report on Land Use, Land use change and Forestry. Cambridge University Press, Cambridge, UK.
- Gautam KR (2002) Carbon sequestration in agro forestry and annual cropping system in Inner Tarai, central Nepal. (M ScDesertation), Agriculture University, Norway.
- Arnold JEM (1997) Framing the issues. In: Arnold JEM, Dewees PA (Eds.), Farms, trees, and farmers: responses to agricultural intensification. Earthscan, London. p 1–17.
- Balmer O (2002) Species lists in ecology and conservation: abundances matter. Conservation Biology 16(4): 1160-1161.
- Baral SK, Katzensteiner K (2009) Diversity of vascular plant communities along a disturbance gradient in a central mid-hill community forest of Nepal. BankoJanakari 19(1): 3-10.
- Karki MB (1988) Impact of multipurpose trees on small-farm systems of Nepal. A Case Study of Karmaiya
- MacDicken KG (1997) A guide to monitoring carbon storage in forestry and agroforestry projects.
- MacDicken KG (1997) A Guide to Monitoring Carbon Storage in Forestry and Agroforestry Project, Forest Carbon Monitoring Program, Winrock International Institute for Agriculture Development.
- Mandal RA, Dutta IC, Jha PK, Karmacharya S, Haque SM (2013) Evaluating public plantation and community planted forests under the CDM and REDD+ Mechanism for carbon in Nepal. International Journal of Conservation Science 4(3).
- Rawat JK, Dasgupta S, Kumar R, Kumar A, Chauhan K (2004) Assessment of tree resources outside forest based on remote sensing satellite data. Proceedings of Map India.
- Zhu Zhaohua, Maoyi Fu, Sastry CB (1991) Agroforestry in China - An Overview. international Development of Research Center (Asian Regional Office), Singapore.

Top Editors
-

Mark E Smith
Bio chemistry
University of Texas Medical Branch, USA -

Lawrence A Presley
Department of Criminal Justice
Liberty University, USA -

Thomas W Miller
Department of Psychiatry
University of Kentucky, USA -

Gjumrakch Aliev
Department of Medicine
Gally International Biomedical Research & Consulting LLC, USA -

Christopher Bryant
Department of Urbanisation and Agricultural
Montreal university, USA -

Robert William Frare
Oral & Maxillofacial Pathology
New York University, USA -

Rudolph Modesto Navari
Gastroenterology and Hepatology
University of Alabama, UK -

Andrew Hague
Department of Medicine
Universities of Bradford, UK -

George Gregory Buttigieg
Maltese College of Obstetrics and Gynaecology, Europe -

Chen-Hsiung Yeh
Oncology
Circulogene Theranostics, England -
.png)
Emilio Bucio-Carrillo
Radiation Chemistry
National University of Mexico, USA -
.jpg)
Casey J Grenier
Analytical Chemistry
Wentworth Institute of Technology, USA -
Hany Atalah
Minimally Invasive Surgery
Mercer University school of Medicine, USA -

Abu-Hussein Muhamad
Pediatric Dentistry
University of Athens , Greece

The annual scholar awards from Lupine Publishers honor a selected number Read More...


