


Lupine Publishers Group
Lupine Publishers
ISSN: 2641-6794
Research Article2641-6794 
Effect of Oak Ecosystems Degradation on the Carbon Storage in the Southern Mediterranean Forests Volume 4 - Issue 2
Received: November 22, 2019; Published: December 12, 2019
Corresponding author: Hafida Zaher, Soil Water Biodiversity Department, National School of Forest Engineers, Morocco
DOI: 10.32474/OAJESS.2019.04.000185
Abstract
Human population pressures upon land resources have increased the need to assess impacts of land use change on soil quality. In order to assess effects of land use changes on soil quality properties and carbon storage in Oak forest ecosystem of Morocco, soil samples were collected from two types of stands (green oak and cork oak) with three levels of degradation (natural forest, matorral and cereals crops) or six land uses. For each land use, we estimated carbon stocks in four reservoirs, i.e., aboveground biomass (trees, shrubs and herbaceous plants), belowground biomass (roots), necromass (litter and deadwood) and the soil. Various physicobiochemical characteristics (structural stability, bulk density and soil organic carbon were also evaluated. The results have shown that the cultivation of forests have resulted in the percentage loss of water stable aggregates > 1mm in 59% and 45%, a decline of 76% and 77% in soil organic carbon and an increase of 8% and 10% in the bulk density under green oak and cork oak respectively. The degradation of natural forest by grazing (matorral) is responsible of approximately half carbon stock decreases. Forests are able to store five times more carbon than the cultivated area. The natural cork oak forest store 2.5 times more carbon than in the natural green oak forest. The quantification of carbon stock in different reservoirs (biomass, necromass and soil) showed that the soil has the biggest potential to sequester carbon under six land uses studied. Indeed, the carbon stocks vary from 65 to 95% in soils against 5 to 30% in biomass and only 1 to 11% in necromass.
Keywords: Land use; oak; soil; biomass; necromass; carbon sequestration
Introduction
Forests are present all over world continents and cover about
one-third of earth’s surface [1] and are responsible for about twothirds
of global photosynthesis [2]. They play an important role in
consuming and regeneration cycles of atmospheric carbon dioxide.
Many investigations have shown that the conversion of forest to
cropland, pastures and grazing land contributes to the climate
change effects [3,4]. Land use and land cover change releases
significant amounts of CO2 to the atmosphere. It is estimated that
on average, deforestation has caused the loss of about 25% of soil
organic C over the years [5,6] largely due to oxidation of soil organic
carbon as well as soil erosion. Crop and livestock production
are the main causes of deforestation [7]. Forests can sequester
a significant amount of carbon in different reservoirs such as
biomass, necromass and soil to remove exceeding concentrations
of CO2 from the atmosphere [8-10]. Primarily deforestation was
responsible for 20% of anthropogenic CO2 emissions during the
1990s [11]. This carbon sequestered in the different reservoirs of
the forest ecosystem plays both a role in mitigating climate change
and in increasing forest production [12]. Many studies have pointed
out that the amount of carbon stored in the different reservoirs
largely depends on land use change [13-15]. Sequestered carbon,
particularly in soil, may have impacts on soil quality. It improves,
i.e., soil structure, capacity for water retention and its biodiversity
expression [16,17]. Thus, the data acquisition on carbon storage is
important to understand ecosystems functioning according to their
mode of management and to estimate the relative contribution of
different reservoirs to the carbon sequestration phenomena. In
this regard, there is a significant lack of data in Morocco and other
countries of the southern Mediterranean shore on the quantification
of carbon stocks in the different reservoirs in response to land use
changes.
The studies on the storage potential of different reservoirs
(soil, biomass and necromass) under two types of oak stands with
different levels of degradation simultaneously in the same study have not been carried out yet. Furthermore, effect of transformation
of oak forest into others land uses on soil physical properties
remains scarcely studied under semiarid Morocco’s environment.
Thus, the objectives of this study are 1/ to investigate the effect
of the conversion of oak forest ecosystems on some physical and
chemical properties of the soil; 2/ to quantify the carbon storage
capacity in different reservoirs including biomass, necromass
and soil for green oak and cork oak woodlands having undergone
different levels of degradation.
Materials and Methods
Study area
This study was carried out in the Bou Regreg watershed of Oulmes region, which is one of the main courses in the Moroccan river system. The Bouregreg wadi forest is an integral part of the Plateau Central National Park, which is an area of protection and conservation of the biodiversity of the Oak and thuja ecosystems. The first site based on green oak (Quercus rotundifolia) is located in the Ait Ichou East forest (latitude: 33° 21’ 15”- 33° 25’ 27”N, longitude : 5° 46’ 51”- 5° 54’21”E) and the second site; cork oak (Quercus suber) is located in the El Harcha forest (latitude: 33° 24’ 49”- 33° 25’ 26”N, longitude : 6° 8’ 7”- 6° 22’38”W) (Figure 1). At each site, three types of land uses at different stages of forest degradation were chosen. They correspond to the natural forest, matorral and a growing area (cereal culture) for a total of six lands uses to be studied. Climate is one of the main factors influencing soil degradation and vegetation. The temperature controls the spatial distribution and growth of the vegetation, mainly the minimum temperature of the coldest month and the maximum temperature of the hottest month. Maximum temperatures vary between 10.9 °C and 31.7 °C. The months of July and August are the hottest months in the year. Minimum temperatures vary between 2.7 °C and 15 °C. The months of December and January are the coldest. The average annual precipitations in the studied region vary between 413 and 647 mm during the last 36 years with peaks recorded in December and January. The study area benefits from a subhumid bioclimatic zone with a fresh variant.
Figure 1: Land use; oak; soil; biomass; necromass; carbon sequestration.

Physico-chemical Characterization of Soils
For each land use, samples were collected at a depth of 30 cm at the edge of the quadrat 0.2 m x 0.2 m as reported by Figure 2. We carried out 3 repetitions for each land use sample to determine texture, pH and organic carbon content. Soil texture was measured using the hydrometer method [18]. The pH of the soil was determined by the potentiometric method using a pH meter. However, soil moisture is determined by the gravimetric method. The soil samples are collected in air tight aluminum containers from 30cm depth. They are weighed and they are dried in an oven at 105 °C for about 24 hours until all the moisture is driven off. After removing from oven, they are cooled slowly to room temperature and weighed again. The difference in weight is amount of moisture in the soil.
Figure 2: Sampling plan for different carbon pools and some physicochemical characteristics of the soils.

Soil Organic Carbon
Disturbed and undisturbed soil samples were taken for determination of soil organic carbon content (SOC) and bulk density respectively, and at the same time at the edge of the quadrat 0.2 m x 0.2 m as reported by Figure 2. SOC assessment was realized according to the Walkley and Black method [19]. which consists of cold oxidation of organic carbon by a mixture of potassium and bichromate (K2Cr2O7) in sulfuric medium (H2SO4). The SOC was calculated as the difference between the total volume of dichromate added and the amount of unreacted dichromate determined through titration with iron sulfate.
Soil bulk density
Soil bulk density (ρb) at 30 cm depth was measured by the core method [20] using 7 cm Ø and 10 cm deep cores. The intact soil core was obtained from the middle of the superficial layer and weighed in the lab. The cylinders with segmented cores were put in an oven at 105 °C for dry weight determination. The bulk density was determined using the following formula.
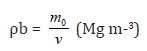 (1)
(1)With : m0 : oven dry weight of soil (Mg) ; v : cylinder volume (m3).
Soil Aggregate Stability Measurement
The water stable aggregates (WSA) > 1mm of different soils from various land uses studied were estimated using the method of Pojasok and Kay [21]. Five grams of <6-mm aggregates was used for measurements of WSA. The aggregates were poured into 40 mL of distilled water in 100mL test tubes, and then stirred for 5 min at 56 oscillations min−1 on a horizontal shaker. After sieving, the residual material was dried at 105 °C for 24 hours and its weight determined. The dried aggregates were dispersed in a sodium hexametaphosphate solution at 50 g L-1 and then stirred at a high speed. Thus, the percentage of water-stable aggregate (WSA) > 1mm to water sieving is calculated according to the following formula (2) :
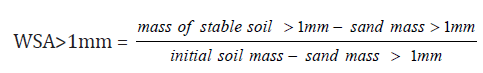 (2)
(2)Sampling strategies and measurements of carbon pools
The sampling to estimate the carbon stock in each reservoir has been done during the spring season characterized by mean seasonal precipitation of 150 mm and the minimum and maximum temperatures in Seasonal were 6 °C and 17 °C respectively. Our sampling method is based on the work of many authors [22-25]. The carbon reservoirs (sometimes also called stocks or pools) sampled are : aboveground biomass (trees, shrubs and herbaceous species), deadwood and soil litter representing necromass, belowground biomass (roots up to 30 cm deep), and soil. Figure 2 illustrates our sampling plan. According to Pearson and Brown [25], in each land use, we installed three circular plots of 12m radius and all standing trees and dead wood within each plot were sampled. The circumference at 1.30m breast height of all tree trunks (alive and dead) with a diameter greater than 5cm was measured using a tape measure [21]. Live and dead wood samples were collected to determine the density of the wood that will be used in the biomass estimation. We installed a subplot of 2m2 (2m* 1m) in each of the circular plots and cut all undergrowth vegetation (shrubs and herbaceous plants) with pruning shears (Figure 2). The sample was weighted on site and a subsample collected. The litter (coarse and fine) was taken in quadrat of 0.50m x 0.50m (0.25 m2) installed inside the plot of 2 m2. Roots were obtained by digging an area of 0.2 m x 0.2 m in the quadrat of 0.25 m2 to a depth of 30 cm (Figure 2) [24]. Sub-samples of undergrowth taken from the field were dried at 80 °C, until the stabilization of their weight corresponding to the dry weight. The litter was washed, screened, and then dried on the same conditions and weighed. The large roots were sorted and washed, while the rest of the sample was dissolved in water and passed through a 2 mm sieve [23]. They were also dried at 80 °C and finally weighed to obtain the dry weight. The dry mass of the undergrowth is obtained by the ratio between the dry mass of the subsample and the fresh mass of the subsample multiplied by the fresh mass of the whole sample [25]. The dry masses of litter and roots are obtained directly after oven drying. The conversion of dry matter to carbon in biomass and necromass was carried out, making the product of the dry mass by 0.5 [22]. The soil organic carbon (SOC) pool contained per unit area (Mg ha-1 for a 30cm depth) was computed by multiplying the SOC concentration (kg Mg- 1) with bulk density (Mg m-3) and depth (0.30 m) :
C pool (Mg ha-1) = Ccontent (kg Mg-1) × ρb (Mg m-3) × depth (m) ×10 -3 Mg kg-1 × 10⁴ m2 hs-1 (3)
Statistical analysis
All statistical analyzes were performed with SAS 6.12 software for Windows [26]. The analysis of the variance (ANOVA) of the data was carried out according to a completely random experimental design comprising six land uses. To differentiate between different land uses, the test of the Least Significant Difference (LSD at a probability P ≤5%) was done [27].
Results and Discussion
The results of the physico-chemical characterization of soils are presented in Table 1. Most of the changes after conversion of forests to arable land have soil moisture that is shown as a result of this work. Soil moisture at forest sites is higher and averages 17.7 and 19.3 kg kg-1 for all green oak (GO) and cork oak (CO) sites, respectively. Soil moisture in cultivated areas shows the lowest values with an average of 15 and 16 kg kg-1 under GO and CO respectively. In addition, matorral zones have soil moisture values intermediate between those recorded in forest and in cereal fields, confirming the results obtained by Deng et al. [28]. These authors noted that, soil moisture decreased significantly when land use was changed to growing trees, shrubs, or grasses, but the changes were also influenced by soil depth. Earlier studies of the effects of trees on moisture levels in the topsoil (<20cm) have reported the effects to be either significantly negative [29], significantly positive [30] or negligible [31]. Our results can be explained probably by the roots of cereal crops are mainly confined to the surface layer [32]. Which increase water uptake by roots and decrease volumetric soil content.
Table 1: Characteristics of the soil according to different land uses.

0: Soil moisture
The data presented is an average of three repetitions.
Soil organic carbon under different land uses
Soil organic carbon (SOC) strongly impacts, amongst others, soil quality (better resistance to degradation, mainly to erosion) and environment (fixation of pollutants). Its estimate is of great importance. According to Table 2, SOC content modified significantly after natural forest land transformed into matorral and cultivated land. Soil analyzes in the green oak forest area showed that the SOC contents were 0.99% for its natural state (NG), 0.46% for matorral (MG) and 0.24% for the forest converted into cereal growing zone (CG). Furthermore, in the territory of the cork oak forest, its undegraded state (NC) has the highest carbon contents (2.99%), the matorral (MC) (1.59%) and the forest transformed into the cereal crops zone (CC) has the lowest levels (0.70%). SOC contents in various land use were significantly different (P=0.0028 and P=0.0024 for green oak and cork oak forests respectively). It’s approximate 54% and 76 % less in SOC for MG and CG respectively compared to NG under green oak area.
Table 2: Variation of land use effects on some soil physico-chemical properties.

Treatments followed by different letters indicate significant statistical differences at ≤ 0.05.
The highest carbon contents are recorded under natural forest in both oak stands. Similar trends are also recorded after transformation of the cork oak forest area into matorral and agricultural area. SOC levels are respectively 46% and 77% lower in MC and CC compared to NC. The data in Table 2 showed clearly that due to forest degradation, the average of SOC in cultivation area is decreased about 4 times in comparison with soil under forest vegetation. These results are consistent with those of Spaccini et al. [33] who found that SOC content was two to four times higher in the forested than the cultivated soils. The SOC losses can be explained by the reduction of organic matter inputs when converting from natural forest either into grazing area [34,35] or into agricultural ecosystem [36] and the decrease of SOC physical protection by the tillage practices [37].
Aggregates structural stability
Soil aggregation is considered a soil quality indicator that
provides information on the soil’s ability to function as a basic
component of the ecosystem. Soil aggregation influences the
transportation of liquids, gases, and heat, as well as physical
processes such as infiltration and aeration [38]. Soil aggregation
integrates edaphic properties (physical, chemical, and biological),
it is easy to measure, and it is sensitive to variations due to weather
and land use [39]. In addition, it is a good indicator of soil erosion
and degradation [40]. Consequently, it is considered an excellent
tool to evaluate soil quality. Although the fertility of the forest soil is
a subject that has been widely explored by the research, the same is
not true of its physical characteristics. However, the functioning of
the soil and the good development of forest stands depend largely
on it. Among these physical characteristics that we will investigate
during this study, would be the structural stability of the soil and its
bulk density. Structural stability is the ability of a soil to maintain
its arrangement between solid and void particles when subjected
to stress such as the impact of raindrops or wetting [41,42]. It is
recognized as a better indicator of soil quality and its sensitivity
to erosion and compaction [43,44]. Water Stable Aggregates
(WSA >1mm) percentages range from 24.7%, 28.7% and 10%,
respectively, for natural forest of green oak, matorral and cereal
growing at Site 1 (Table 2). It appears that land use has a significant
effect on aggregate stability at this site. However, multiple
comparison of WSA averages indicated a nonsignificant difference
between NG and MG, although WSA >1mm rates were higher under
MG. On the other hand, in site 2, the NC has the highest stable
aggregate rate (37.7%), followed by matorral (32%) and cereals
(20.7%). Multiple comparisons between averages also revealed
that degradation of the cork oak forest into matorral did not have a
significant effect on the percentage of WSA >1mm. Otherwise, the
transformation of forests into cereals led to a significant decrease in
stable aggregates of 59% and 45% respectively in the green oak and
in the cork oak areas. According to Ashagrie et al. [45], aggregation
is influenced by land use and land use change in the way that the
proportion of water stable macroaggregates is reduced in the order
forest > pasture/grassland > arable land. Our results are consistent
with those of these authors who noted that the cultivation
decreased the proportion of water stable macroaggregates from
70 to 50 %, in comparison with natural forest. Many authors have
noted that structural stability is negatively influenced by tillage
[46,47]. Cultivation areas, periodically subject to tillage, have
macroaggregates breakdown and the topsoil layers disintegration
[48]. Similarly, in pasture areas trampling by animals compacts the
soil surface and alters the arrangement between the particles and
subsequently the structural stability of soils [49]. The results of
the statistical analysis on the experimental data showed that the
structural stability and the organic carbon of the soils both under
forest soil and on cultivated soil (Figure 3) were strongly positively
correlated (r = 0.81 and r = 0.93 respectively).
This study confirms, once again, the link that exists between
organic matter and the structural stability of soils. This stability
increases with the increase of soil organic carbon content. Many
previous studies have clearly underlined the biological temporal
effects of organic matter on the stability of soil aggregates [50].
The tendency of the decrease of water-stable aggregates following
the transformation of the forest into a farmland was established by
Ashagrie et al. [4]. The main cause of the decrease of the content of
water stable aggregates after the conversion of native vegetation to
cropland is the decrease of the content of organic matter [51], and
some of its components [52].
Bulk density
The purpose of this study is, among other things, to study the influence of the degradation of forest areas on certain physical properties, particularly the bulk density of the soil. Bulk density estimation can give indications on physical disturbance by settlement. From the analysis of our data, it appears that the conversion of forest lands into agricultural zones causes soil compaction. At the level of the forest of the green oak site, Table 2 shows that the forest has the lowest bulk density (ρb = 1.37 Mg m-3), followed by the matorral (1.42 Mg m-3). The highest density is recorded in cereal lands (1.48 Mg m-3). The same trend is observed in the cork oak site with the lowest ρb (1.22 Mg m-3) followed by the matorral (1.30 Mg m-3) and the cereal crop (1.34 Mg m-3). These data clearly show that the degradation of forest ecosystems leads to an increase in the bulk density of soils, as an evidence of compaction. Our results are consistent with those of Desyatkin et al. [53] who clearly have made it that ρb of forest soils is significantly lower than soils of arable land. In many studies, it is recognized that forest soils with bulk densities greater than 1.3 Mg m-3 are compacted soils [54]. For agricultural soils, the work of Lal and Shukla (2004) pointed out that the optimum levels of bulk densities are those less than 1.4 g cm-3. From our bulk density data, we can say that the green oak site is an area with compaction problems because it records the highest values on both forest and agricultural soils. The effect of land use on ρb is very highly significant (P=0.0001). Thus, the forest areas, both under green oak and cork oak, showed the lowest soil bulk densities. Moreover, this bulk density is lower in cork oak forest rich in organic carbon than on green oak soil. The correlation of the soil organic carbon data with its bulk density (Figure 3) revealed that the correlation between the two measurements is good (R2=0.75). Bulk density shows a negative correlation with soil organic carbon. Such links are of interest because they could be used as a quick and easy way to evaluate the concentration of organic carbon and the bulk density of the soil. Since the bulk density estimate for forest soils, especially those that are stony, is very laborious, the use of models to predict bulk density from soil organic carbon concentrations could be an attractive alternative [55,56].
Figure 3: Relationship between structural stability, bulk density and organic carbon content in forest soils and agricultural soils.

Total carbon stock and carbon distribution in reservoirs
The carbon stocks in the different reservoirs obtained after data analysis based on wood density values are recorded in Table 3. The quantity of carbon stored in each of the reservoirs studied, i.e., aboveground, belowground biomass, necromass (deadwood and litter) and soil, as well as the total amount of carbon in the different reservoirs are significantly affected by land use change. The natural green oak forest stored a total of 63.51 Mg C ha-1 of which 30% was in biomass (15.15% in aboveground biomass and 14.85% in roots), 6% in necromass (1% in dead wood and 5% in litter) and 64% in soil. As for the matorral, it sequestered 26.68 Mg C ha-1 with 16.6% in the biomass (7.88% in the aboveground biomass and 8.72% in the roots). 10.6% in the necromass and 72.8% in the soil. As a result, only 11.77 Mg C ha-1 was stored in cereal ecosystem, 7.6% of which was in biomass (2.3% in aboveground biomass and 5.3% in belowground biomass), 1.4% in necromass and 91% in soil. Moreover, the natural cork oak forest stored 2.5 times more carbon than in the natural green oak forest, i.e., 163.99 Mg C ha-1, whose 29.4% of stored carbon was registered in the biomass (24.6% in the aboveground biomass and 4.8% in the roots), 4% in the necromass (1% in the dead wood and 4% in the litter) and 66.6% in the soil.
Table 3: Variation of land use effects on some soil physico-chemical properties.

AG: aboveground; BG: belowground
Treatments followed by different letters indicate significant statistical differences at P≤ 0.05.
This high carbon storage potential in cork oak forests should
challenge us to make more efforts to preserve these ecosystems,
which are clearly in regression in Morocco. Its area has declined over
the last decades, from 1.53 million ha in 1947 to 425 000 ha in 1980
[57]. Future forest management should focus on the conversion
of forest type and the selection of the species in reforestation to
maximize the C sequestration potential of forest ecosystem in
Morocco witch located at south of the Mediterranean known as a
region highly vulnerable to climate change. MC stored only 68.08 Mg
C ha-1, divided into 5.3% in biomass (2.5% aboveground and 2.8%
belowground biomass), 3.6% in necromass and 91.1% in soil. Cereal
crops stored 29.73 Mg C ha-1, 4.1% in biomass (1.8% in aboveground biomass and 2.3% in roots), 1.4% in necromass and 94.5% in soil.
We note that for agricultural areas, soil represents a large reservoir
of carbon exceeding 90% of stored carbon compared to forest land
that their soils store only 60%. These results are close to those of US
[58] and French [59] researchers who noted that soils store 54% of
the total carbon stored in the forest. So to mitigate climate change
in agricultural areas, we should adopt techniques that allow more
carbon storage in the soil reservoir as stipulated ‘4 per thousand’
initiative adopted in COP 21 (e.g. improving soil quality by addition
organic amendments, N fertilization, minimum tillage and fighting
against erosion). Furthermore, in forest ecosystems, to sequester
more carbon, it is necessary to act by adopting management and
management approaches that allow the storage of carbon both in
the soil reservoir and in the biomass reservoir.
It can be seen from Table 3 that regardless of the studied
sites, the forest stores more carbon than the matorral and cereal
crops land. At each site, the forest sequesters more than twice the
carbon stored in the matorral and more than five times more than
the cereal crop. These results confirm the importance of forests in
carbon storage, and any reduction in forestland area would lead to
the carbon stock decline [60,61]. Several previous studies have also
noted that forests immobilize much more carbon per unit area than
grasslands and agricultural lands [62- 64].
Concerning the potential of carbon storage of different sinks
studied, soil appears to be the most important carbon reservoir
for all land uses. Stocks in the soil are around 65% for forest lands
in both sites, ranging from 72.8 to 91% for matorral and from 91
to 94.5% for agricultural lands. Considering the total carbon stock
for different land uses studied, we note that the transformation of
the green oak forest into matorral and cereal crops area caused
carbon losses of 58% and 81.5% respectively. Similar trends were
also noted for the Cork oak area. These results are close to the data
recorded by Houghton’s work [65], pointing out a loss of about 77%
of carbon in tropical Asia following the transformation of forests
into permanent crops.
Conclusion
Assessment of soil properties upon conversion of natural forests for varying pasture or agricultural purposes is of utmost importance to detect early changes in soil quality. This study showed that the effect of land-use change is significant on the physicochemical properties of the soil. Grazing and cultivation of forested lands resulted in deterioration of soil properties compared to soils under natural forest. Cultivated soils had lower aggregate stability, reduced organic carbon contents and higher bulk density. The determination of the carbon stock in the green oak and cork oak woodlands reveals that forests stores more than twice the carbon stored in the matorral and more than 5 times more than the cereal crops. The data from this study also showed that the natural forest of the cork oak stores more than twice carbon that in the green oak. Natural forest area is expected to support carbon storage and improve soils quality. Therefore, Changes in land use and ecosystem must take into consideration in public policies. The transformation of forests into matorral under the effect of overgrazing leads to a reduction of 58% in the total carbon stock for the two oak ecosystems. Although the conversion of forests to cultivated land caused losses of carbon stocks of 81.5% and 81.9% under green oak and cork oak respectively. The distribution of carbon in the different reservoirs studied reveals a significant contribution of soil in carbon storage followed by biomass and necromass for all land uses studied. The carbon stock in the soil is about 64 and 67% under natural forests, 73% and 91% under matorrals and 91% and 95% under cereal crops for the green oak and cork oak area respectively. In forest areas, soil and biomass are the largest sinks of carbon, while in agricultural lands, soil is the largest reservoir.
Acknowledgement
The authors gratefully acknowledge the financial support of the International Foundation for Science (IFS) and the Committee for Scientific and Technological Cooperation (COMSTECH).
References
- Kramer PJ (1981) Carbon Dioxide Concentration, Photosynthesis, and Dry Matter Production. Bioscience 31: 29-33.
- Watson RT, Rodhe H, Oeschger H, Siegenthaler U (1990) GreenhouseGases and AerosolsIn: Houghton JT, GJ Jenkins, JJ Ephraums (Eds.), Climate Change : The IPCC Scientific Assessment. Cambridge UniversityPress, Cambridge. England, UK.
- Kaplan JO, Krumhardt KM, Ellis EC, Ruddiman WF, Lemmen C, Klein Goldewijk K (2011) Holocenecarbonemissions as a result of anthropogenic land cover change. The Holocene 21(5): 775-791.
- Lopez S, Wright C, Costanza P (2017) Environmental change in the equatorial Andes : Linkingclimate, land use, and land cover transformations. RemoteSensingApplications Society and Environment 8: 291-303.
- Guo LB, Gifford RM (2002) Soilcarbon stocks and land use change : a metaanalysis. Glob Chang Biol 8(4): 345-360.
- Murty D, Kirschbaum MUF, McMurtrie RE, McGilvray A (2002) Does conversion of forest to agricultural land change soilcarbon and nitrogen ? A review of the literature. Glob Chang Biol 8(2):105-123.
- Ussiri, DAN, Lal, R (2017) Carbon Sequestration for Climate Change Mitigation and Adaptation, pp. 554.
- Locatelli B, Karsenty A, (2004). Beyond tropical deforestation : from tropical deforestation to forest cover dynamics and forestdevelopment. Babin D (ed). UNESCO pp.525.
- Jonard M, Nicolas M, Coomes DA, Caignet I, Saenger A, Ponette Q (2017) Forest soils in France are sequesteringsubstantialamounts of carbon. Sci Total Environ 574: 616-628.
- Vachnadze G, Tiginashvili Z, Tsereteli G, Aptsiauri B, Basilidze L (2018) Carbon Stock Sequestered in the phytocenosis of oakforests in Georgia. Annals of Agrarian Science 16(4): 476-480.
- Denman KL, Brasseur G, Chidthaisong A, Ciais P, PM Cox, Dickinson RE, et al., (2007) Couplingsbetween changes in the climate system and biogeochemistry. In : Intergovernmental panel on climate change (Edn.),Climate Change : the physical science basis. Cambridge UniversityPress, England,UK.
- Sedjo RA (2001) Forest Carbon Sequestration : Some Issues for Forest Investments. Discussion Paper p. 1-34.
- Oliver GR, Beets PN, Garrett LG, Pearce SH, Kimberly MO, et al.,(2004) Variation in soilcarbon in pine plantations and implications for monitoring soilcarbon stocks in relation to land-use change and forest site management in New Zealand. ForEcolManage 203(1-3): 283-295.
- Hoare AL (2007) Clouds on the horizon : The Congo Basin’sForests and Climate Change,central Africa.
- Wilson BR, Growns, Ivor, Lemon J (2008) Land-use effects on soil properties on the north-western slopes of New South Wales : Implications for soil condition assessment. SoilRes46: 359-367.
- Lal R, Kimble J, Follett RF (1997) Pedospheric Processes and the Carbon Cycle. In : Lal R, JM Kimble, RF Follett, BA Stewart (edn.),SoilProcesses and the Carbon CycleSeries: Advances in Soil Science CRC Press, Boca Raton, Floride, USA.
- Rudel TK, Coomes OT, Moran E, Archard R, Angelson A, J Xu etal., (2005) Forest transitions : towards a global understanding of land use change. Global Environmental Change 15(1): 23-31.
- Day PR (1965) Particlefractionation and particle-size analysis In : Black CA (ed).) Methods of SoilAnalysis. Part 1. Physical and mineralogical properties pp. 545-567.
- Walkley J, Black W(1934) An examination of the degtjareffmethod for determiningsoilorganicmatter, and a proposed modification of the chromicacid titration methodSoilSci 37(1): 29-38.
- Blake GR, Hartge KH (1986) Bulk density. In : Klute A (ed) Methods of soilanalysis. Part 1. Physical and mineralogicalmethods. (2nd ),AgronMonogr9(1):363-382.
- Pojasok T, Kay BD (1990) Assessment of a combination of wetsieving and turbidimetry to characterize the structural stability of moistaggregates. Can J of Soil Science 70(1): 33-42.
- MacDicken KG (1997) A Guide to Monitoring Carbon Storage in Forestry and AgroforestryProjects. Winrock International.
- Hairiah K, Sitompul SM, van Noordwijk M, Palm C (2001) Methods for sampling carbon stocks above and belowground.
- Woomer PL, Tieszen LT, Tschakert P, Parton WJ, A Toure (2001) Landscape Carbon Sampling and Biogeochemical Modeling. A two-weekskillsdevelopment workshop conducted in SenegalSACRED Africa.
- Pearson T, Brown S (2005) Sourcebook for land use, land-use change and forestryprojects. Winrock International.
- SAS Institute (1996) Release 6.12. SAS InstitudeInc Cary NC, USA.
- Snedecor GW, Cochran WG (1980) Statistical Methods. 7th Edition, Iowa State UniversityPress, Ames.
- Deng L, Yan W, Zhang Y, Shangguan Z (2016) Severedepletion of soilmoisturefollowing land-use changes for ecologicalrestoration : Evidence fromnorthern China. For EcologyManag366: 1-10.
- Breshears DD, Myers OB, Johnson SR, Meyer CW, Martens SN (1997) Differential use of spatiallyheterogeneoussoilmoisture by twosemi-aridwoodyspecies : Pinus edulis and Juniperusmonosperma J Ecol85: 289-299.
- Joffre R, Rambal S (1998) Soil water improvement by trees in the rangelands of southern Spain. Acta Oecol9: 405-422.
- Maestre FT, Bautista S, Cortina J, Bellot J (2001) Potential of using facilitation by grasses to establishshrubs on a semi-ariddegraded steppe. EcolAppl 11(6): 1641-1655.
- Fan J, McConkey B, Wang H, Janzen H (2016) Root distribution by depth for temperate agricultural crops. Field CropsRes189: 68-74.
- Spaccini R, Zena A, Igwe CA, mbagwu JSC, Piccolo A (2001) Carbohydrates in water-stable aggregates and particle size fractions of forested and cultivatedsoils in twocontrasting tropical ecosystems. Biogeochemistry 53(1): 1-22.
- Oliva FG, Lancho JFG, Montano NM, Islas P (2006) Soil Carbon and Nitrogen Dynamics Followed by a Forest-to-pasture Conversion in Western Mexico. AgroforestrySystems 66(2): 93-100.
- Zaher H, Sabir M, Benjelloun H, Hounzandji PI (2019) Effect of forest land use change on carbohydrates, physicalsoilquality and carbon stocks in Moroccancedar area. J Environmental Management 254 : 109544.
- Don A, Schumacher J, Freibauer A (2011) Impact of tropical land-use change on soilorganiccarbon stocks - a meta-analysis. Global Change Biol 17(4): 1658-1670.
- Balesdent J, Chenu C, Balabane M (2000) Relationship of soilorganicmatterdynamics to physical protection and tillage. Soil Till Res 53(3,4): 215-230.
- Nimmo JR (2004) Aggregation:physical aspects. In : Hillel D (edn.), Encyclopedia of Soils in the Environment. Academic Press, London,U
- Seybold CA, Herrick JE (2001) Aggregatestability kit for soilqualityassessments. Catena 44(1): 37-45.
- Sinoga, JDR, Murillo JFM (2009) Effects of soil surface components on soil hydro-logicalbehaviour in a dry Mediterraneanenvironment (Southern Spain). Geomorphology 108 (3-4): 234-245.
- Le Bissonnais Y (1996) Aggregatestability and assessment of soilcrustability and erodibility: I. Theory and methodologyEur J Soil Sci 47(4): 425-437.
- Zaher H, Caron J, Ouaki B (2005) Modellingaggregateinternal pressure evolutionfollowing immersion to quantify pore occlusion and hydrophobicity. SoilSci Soc Am J 69: 1-12.
- Le Bissonnais Y, Cros-Cayot S, Gascuel-Odoux C (2002) Topographicdependence of aggregatestability, overland flow and sediment transport. Agronomie 22(5): 489-501.
- Chenu C, Abiven S, Annabi M, Barray S, Bertrand M, et al., (2011) Mise au point d'outils de prevision de levolution de la stabilitede la structure de sols sousl effet de la gestion organique des sols. Etude et Gestion des Sols 18 (3): 161-174.
- Ashagrie Y, Zech, G Guggenberger W, Mamo T (2007) Soilaggregation, and total and particulateorganicmatterfollowing conversion of native forests to continuous cultivation in EthiopiaSoil Till Res 94(1):101-108.
- Elustondo J, Angers DA, Laverdiere MR, Dayegamiye A N (1990) Etude comparative de l'agregation et de la matiere organique associee aux fractions granulometriques de sept sols sous culture de maïs ou en prairie. Can J SoilSci 70(3): 395-402.
- Angers DA, Samson N, Legere A (1993) Early changes in water-stable aggregationinduced by rotation and tillage in a soilunderbarley production. Can J SoilSci 73(1): 51-59.
- Xu D, Mermoud A (2001) Topsoil properties as affected by tillage practices in North China. Soil Till Res 60(1-2): 11-19.
- Bilotta GS, Brazier RE, Haygarth PM (2007) The Impacts of Grazing Animals on the Quality of Soils, Vegetation, and Surface Waters in IntensivelyManagedGrasslands. Advances in Agronomy94: 237-280.
- Zaher H, Caron J, Angers DA (2007) Pore occlusion by sugars and lipids as a possible mechanism of aggregatestability in amendedsoils. SoilSci Soc Am J 71 : 6.
- Ciric V, Manojlovic M, Nesic LJ, Belic M (2013) Soilorganiccarbonlossfollowing land use change in a semiaridenvironment. Bulgarian Journal of Agricultural Science 19(3): 461-466.
- Spohn M, Giani L (2010) Water-stable aggregates, glomalin-relatedsoilprotein, and carbohydrates in a chronosequence of sandyhydromorphicsoils. Soil Biol. Biochem. 42(9): 1505-1511.
- Desyatkin AR, Iwasaki S, Desyatkin RV, Hatano R (2018) Changes of Soil C Stock under Establishment and Abandonment of Arable Lands in Permafrost Area-Central YakutiaAtmosphere. 9(8): 308.
- Ampoorter E, Van Nevel L, De Vos B, Hermy M, Verheyen K (2010) Assessing the effects of initial soilcharacteristics, machine mass and trafficintensity on forestsoil compaction. For Ecol Manage 260(10):1664-1676.
- Perie C, Ouimet R (2008) Organiccarbon, organicmatter and bulk densityrelationships in borealforestsoils. Can J Soil Science 88 (3): 315-325.
- AL-Shammary AAG, Kouzani AZ, Kaynak A, Khoo SY, Norton M, Gates W (2018) Soil Bulk Density Estimation Methods : A Review. Pedosphere 28(4): 581-596.
- Hammoudi A (2002) La suberaie : biodiversite et paysage. HautCommissariat aux Eaux et Forets a Lutte contre la Dé VIVEXPO 2002, VIVES 30 Mai-2 Juin 2002, MCEF, Maroc.
- Buchholz T, Friedland AJ, Hornig CE, Keeton WS, Zanchi G, Nunery JS (2014) Mineralsoilcarbon fluxes in forests and implications for carbon balance assessments. GCB Bioenergy 6(4): 305-311.
- Luyssaert S, Schulze ED, Borner A, Knohl A, Hessenmoller D, Law BE, Ciais P, Grace J (2008) Old-growthforests as global carbonsinks. Nature 455(7210): 213-215.
- Lal R (2005) Forest soils and carbonsequestration. For. Ecol. Manage. 220(1-3): 242-258.
- Zaher H, Sabir M, Benjelloun H, Hounzandji PI (2019) Effect of forest land use change on carbohydrates, physicalsoilquality and carbon stocks in Moroccancedar area. J. EnvironmentalManag.ement 254, 109544.
- Waring RH, Schlesinger WH (1985) Forest Ecosystems : Concepts and Management, AcademisPress. pp. 340.
- Recous S, Balesdent J, Barrois F, Coppens F, Dambrine E, Garnier P, Grehan E, Loiseau P, Personeni E, Zeller B (2005) Rapport final des travaux. Programme Gestion et Impacts du Changement Climatique. Projet n° 07-C/2002 Biodegradation des litieres et sequestration du carbone dans les ecosystemes cultives et pérennes p .46.
- Hairiah K, Dewi S, Agus F, Velarde S, Ekadinata A, Rahayu S, van Noordwijk M (2011) Measuringcarbon stocks across land use systems. World Agroforestry Centre (ICRAF), SEA Regional Office.
- Houghton RA (2002) Temporal patterns of land-use change and carbonstorage in China and tropical Asia. Science in China (Series C) 45: 10-17.


-

Mark E Smith
Bio chemistry
University of Texas Medical Branch, USA -

Lawrence A Presley
Department of Criminal Justice
Liberty University, USA -

Thomas W Miller
Department of Psychiatry
University of Kentucky, USA -

Gjumrakch Aliev
Department of Medicine
Gally International Biomedical Research & Consulting LLC, USA -

Christopher Bryant
Department of Urbanisation and Agricultural
Montreal university, USA -

Robert William Frare
Oral & Maxillofacial Pathology
New York University, USA -

Rudolph Modesto Navari
Gastroenterology and Hepatology
University of Alabama, UK -

Andrew Hague
Department of Medicine
Universities of Bradford, UK -

George Gregory Buttigieg
Maltese College of Obstetrics and Gynaecology, Europe -

Chen-Hsiung Yeh
Oncology
Circulogene Theranostics, England -
.png)
Emilio Bucio-Carrillo
Radiation Chemistry
National University of Mexico, USA -
.jpg)
Casey J Grenier
Analytical Chemistry
Wentworth Institute of Technology, USA -

Hany Atalah
Minimally Invasive Surgery
Mercer University school of Medicine, USA -

Abu-Hussein Muhamad
Pediatric Dentistry
University of Athens , Greece
