Lupine Publishers Group
Lupine Publishers
Menu
ISSN: 2641-6794
Research Article2641-6794 
Demarcation of Groundwater Prospect Zones in Lower Reaches of Daraudi River Basin, Western Nepal Volume 4 - Issue 1
Dinesh Pathak1* and Menuka Gautam2
1Central Department of Geology, Tribhuvan University, Kathmandu, Nepal
2Birendra Multiple Campus, Tribhuvan University, Chitawan, Nepal
Received: September 24, 2019; Published: October 21, 2019
Corresponding author: Dinesh Pathak, Central Department of Geology, Tribhuvan University, Kathmandu, Nepal
DOI: 10.32474/OAJESS.2019.04.000176
Abstract
In spite of the fact that Nepal is rich in water resources, majority of the mountain settlements faces scarcity in domestic water supply. Springs are the primary source of water for the sustainability of livelihood in mountain. The springs are becoming dry and the water availability has been further decreased leading to migration of entire village in some cases. Therefore, there is need to identify groundwater prospect area for further exploitation. This study proposes the methodology for delineating the groundwater prospect zone in the mountainous terrain at lower reaches of Daraudi River basin in west Nepal. Spring inventory was carried out collecting relevant information like spring type, discharge etc. together with surrounding geology and geomorphology. Thematic layers of different parameters like geology, slope, land use, geomorphology, drainage density, lineament density was prepared. Based on the field condition, weight and rank values were assigned to respective themes and their classes. Groundwater prospect map was prepared through weighted overlay of the thematic layers. The map was verified through comparing with the spring inventory and it is observed that most of the springs fall in high groundwater prospect zone while few in moderate zone and negligible in low prospect zone. This suggests that the methodology adopted to groundwater prospect map in this study well reflects the field condition and hence can be replicated in other mountain region with similar geologic and geomorphic as well as climatic condition.
Keywords: Groundwater Prospect; Nepal Himalaya; Hilly region; Factor Maps; GIS
Introduction
Nepal is mountainous country that has 83% area covered by mountainous and hilly region while 17% area is covered by plain land of Terai. Groundwater is sufficiently available in the Terai region while the mountain aquifer is least explored in spite of its great significance for sustaining the livelihood of people. The rapid increase in human population has increased the groundwater resources demand primarily for drinking and then for agricultural purposes. Delineating groundwater prospect zones in mountainous area is primary task for assessing the groundwater occurrence leading towards further site-specific exploration using geophysical methods followed by drilling. Remote sensing and Geographic Information System (GIS) are widely used in identification of the groundwater prospect zone and recharge areas considering geomorphology, slope, aspect, lineament density, drainage density, lithology, land use etc. as effective factors. Groundwater prospect mapping using remote sensing and GIS has been carried out by many authors considering various parameters [1-8]. The groundwater occurrence depends on the porosity of the media. Higher surface runoff is depicted by high relief, steep slopes and high drainage density, whereas low drainage density, high lineament density and topographical depressions are favorable for increased infiltration.
Present study has been carried out in the lower reaches of Daraudi River basin in west Nepal that occupies an area of 32 km2 (Figure 1). The people in the region are heavily relying on the natural springs to meet their domestic water demand. The area was severely affected by Mw7.8 Gorkha earthquake of 2015 and there was pronounced impact to the groundwater [9]. Further, the effect of climate change at global scale is also expected to have significant effect to the water resources of Himalayan region [10-13].
The main objective of the present study is to delineate groundwater prospect zone in the study area. The method applied could be useful while acquiring similar task in terrain with similar geological, geomorphological and climatic condition. This map can be used to carry out detailed groundwater investigation in the high groundwater prospect zone to identify suitable site for drilling water well for enhanced supply of the domestic water demand of the people living in the area. The method followed in this study is especially important in view that the weight and ranks for different parameter maps are not standardized because it could vary for different watersheds in the hilly region of Himalaya that is represented by varying geological, geomorphological and microclimatic conditions. Therefore, the present research output is aimed to establish groundwater prospect zoning in the mid-hill region of west Nepal.
Materials and Methods
The study was initiated through the collection of geological map, topographic maps and satellite image to extract basic information of the study area. Field questionnaire and checklists for data collection was prepared. Geological hammer, GPS (Garmin Colorado 300), and dilute hydrochloric acid (HCL) were used in the field for geological study and spring inventory. The dilute HCL was used to confirm the presence of calcium carbonate in rocks while the coordinates of spring locations were obtained through the GPS measurement. Likewise, the hammer and compass were used to identify the rock type and measure the orientation of rocks. Spring inventory with relevant data collection was carried out using the field check list and information on the spring discharge fluctuation as well as the use of spring was collected through questionnaire survey. In addition, geology and geomorphological mapping was carried out and assessed with respect to spring occurrence. The land use map as of digital topographic map of Department of Survey prepared on 1995 was updated with the help of satellite imageries and also in the field. Lineament map was prepared from the visual image interpretation. The primary and secondary data were compiled to form GIS database. Thematic layers like geology, geomorphology, slope, land use, lineament density and drainage density were prepared. Weights to the thematic layer and rank to classes were assigned based on the field observation. The thematic layers with weights and rank values assigned was overlain using the weighted sum method and the resulting map was classified into three classes, namely high, moderate and low groundwater prospect zone using the equal interval method. This method classifies the range of values of the cells of output map into zones of equal interval. It is common practice that the integrated map are divided into different zones based on the score range [7,14]. The classified map was validated through crossing with the spring occurrence in the area. If higher number of springs falls into the high and moderate prospect zone, it is an indication that the analysis is reasonable and the output map is representing the real field condition. The natural spring occurrence reflects the fact that the area is already having groundwater resources and hence groundwater can be further exploited in the area through drilling wells. There is both trend that the resulting groundwater prospect maps are either validated [1,15] or presented without validation [7, 14,16].
Results and Discussion
Factor Maps for Groundwater Occurrence
Lithology is primary factor to be considered for the groundwater occurrence in an area. Geological study covering the study area has been carried out by many authors [17-28]. The study area consists of two sequence, the Lesser Himalaya sequence and Higher Himalayan sequence separated by Main Central Thrust – MCT (Figure 2a). The geological formations are interpreted to lithological units to ease the groundwater occurrence in the study area. The Lesser Himalaya consists of high-grade metamorphic rock such calcareous quartzite, calcareous metasandstone, psammatic schist, graphitic schist. The Formation 1 of higher Himalaya is exposed in the study area that is consisting of banded gneiss with quartzite. Five lithological units of lesser Himalaya, namely calcareous metasandstone and marble, psammatic schist, calcareous quartzite and psammatic schist, calcareous quartzite and marble, and graphitic schist, are exposed in the study area.
The land use classes identified in the study area are forest, cultivation, bushes, sand and gravel, settlement and water bodies (Figure 2b). The maximum land is covered by cultivation followed by forest, bushes and settlement. Geomorphology has significant implication to the occurrence of groundwater, which is dealt through hydrogeomorphology [27-31]. Geomorphologically, the study area can be divided into low, medium and high dissected area (Figure 2c). The highly dissected area act as a greater runoff and low recharge zone whereas low dissected area has less runoff and greater recharge zone. The maximum area has been occupied by low dissected area followed by medium and high dissected area.
Figure 2: Factor maps used for groundwater prospect mapping: (a) Lithological units; (b) Land use; (c) Geomorphology; (d) Drainage density (km/km2); (e) Lineament density (km/km2); and (f) Slope.
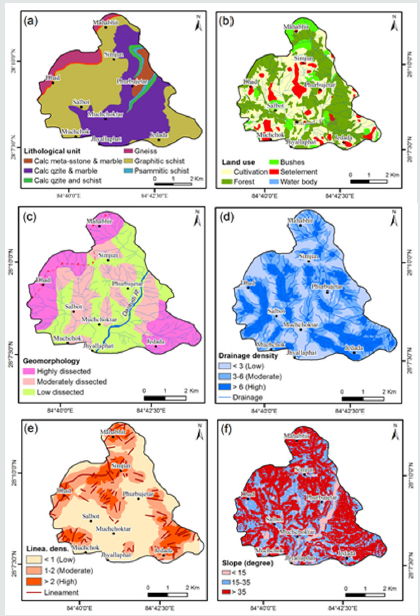
Drainage density is another important parameter for the groundwater occurrence. The higher drainage density reflects greater runoff whereas groundwater recharge is favorable when the drainage density is low. The study area is divided in to three classes, low (<4), moderate (4-8) and high (>12) drainage density (Figure 2d). Lineaments are the linear features that express the zones of weakness in the surface of the earth. The linear features are represented by faults, fractures and joints. Lineament allows the open spaces within the rocks suitable to store water and acts as conduits to transmit the groundwater.
Thus, higher lineament density would increase the chance of occurrence and movement of groundwater, which has been suggested by various studies [32-37]. In the present study, the linear features are interpreted from the satellite image to prepare lineament map for the study area (Figure 2e). Lineament density map has been prepared from the lineament map and classified into low lineament density followed by moderate and high lineament density. The high lineament density mostly lies in the rock exposed areas. Slope is another principle factor that has control in the groundwater recharge and movement. The steep slope cause rapid runoff and doesn’t store water easily hence there is sufficient duration for rainwater to percolation when the slope is gentle and surface runoff is low. Slope map of the study area is divided into three classes, i.e. <15o, 15o-35o and > 60o as presented in Figure 2f.
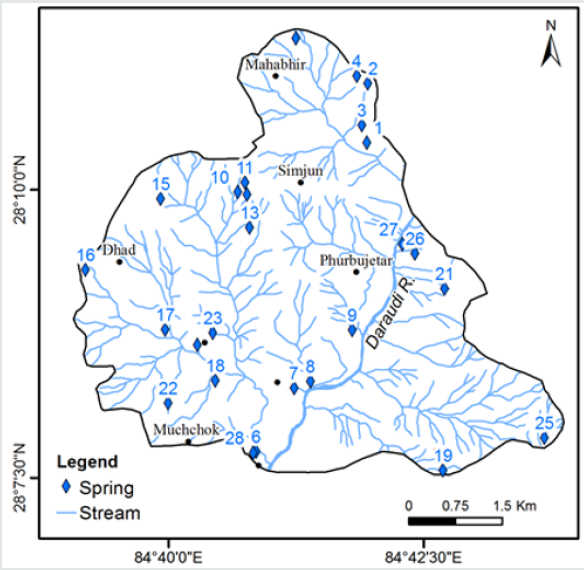
Spring inventory was carried out to assess natural groundwater discharge so that the occurrence of groundwater in different geophysical condition, like geology, land use, geomorphology, drainage density, lineament density and slope could be evaluated. Twentyeight springs were observed and mapped in the study area (Figure 3).
Most of the springs are depression and fractured types [38]. Out of 28 springs, 16 are of fracture type, 10 springs are of depression type and only one is of contact type. The depression type of springs is distributed mostly in the colluvial deposits overlying the bed rocks while the jointed rocks are represented by fracture springs.
Preparation of Groundwater Prospect Map
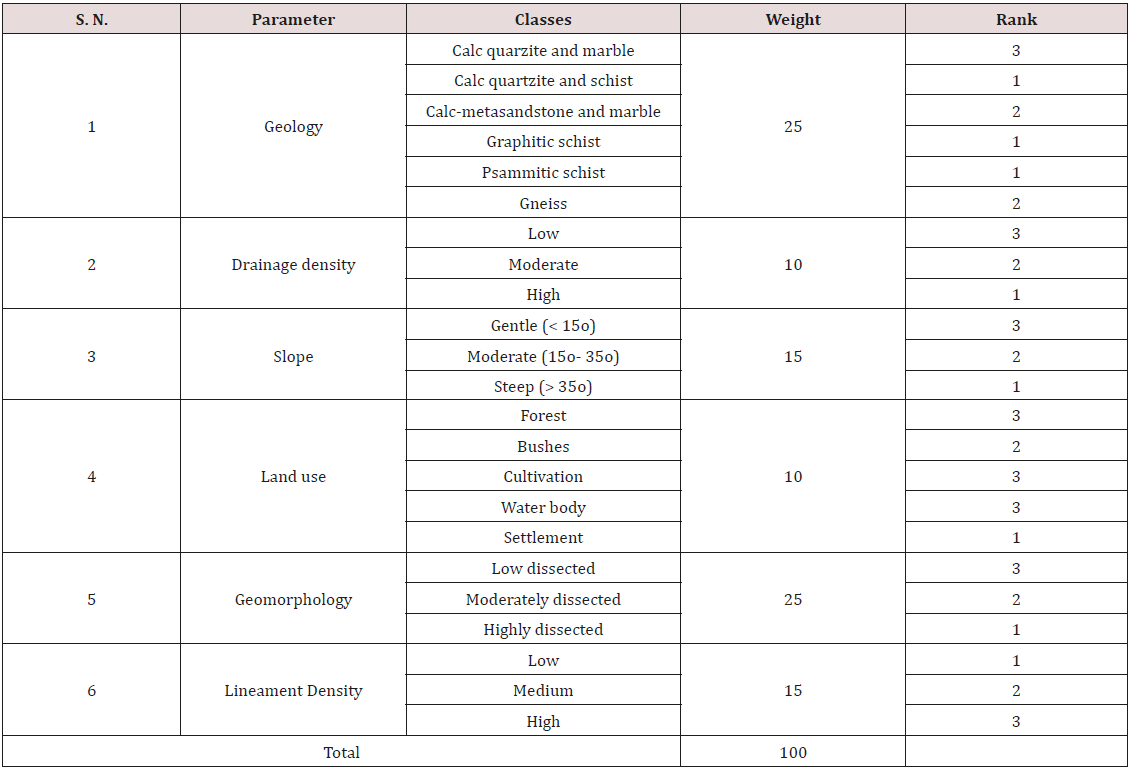
In order to demarcate the groundwater prospect zones, the factors maps were assigned weight values, while rank values were assigned for the classes of each factor maps depending upon its influence on groundwater occurrence. As per the importance of these parameters to the occurrence of groundwater, the total weight (100) was distributed among the six factors. Likewise, rank for each class of the factor maps was defined in the range of 1 to 3; where 1 represents the lowest suitability and 3 as the highest suitability for groundwater occurrence (Table 1).
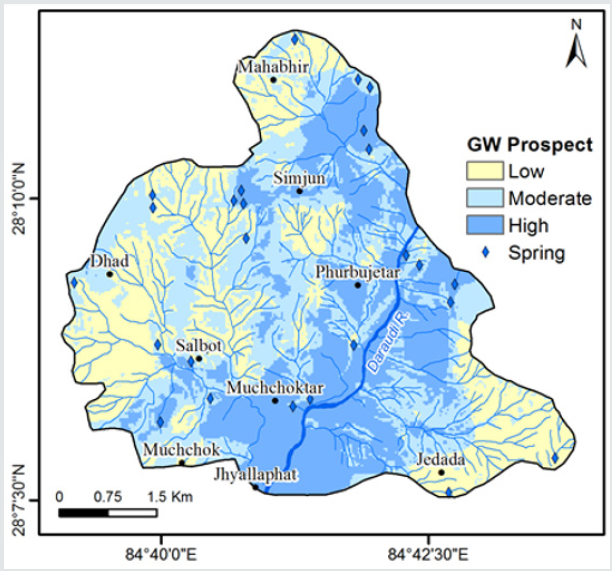
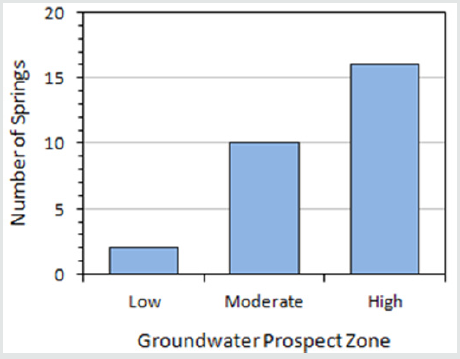
Weighted overlay method was carried out to integrate the factor maps to demarcate groundwater prospect zones and the resulting output map was further classified into three classes namely, low, moderate and high prospect zones using equal interval method (Figure 4). Most of the study area is represented by moderate prospect zone (35.43%) followed by high prospect zone (33.24%) and low prospect zone (31.33%). The classified groundwater prospect zones were validated through crossing with the spring occurrences. Out of 28 mapped springs, 16 springs fall on high groundwater prospect zone, 10 springs fall on moderate prospect zone, while only 2 springs fall in on low groundwater prospect zone (Figure 5).
Different authors have used different combinations of factor maps. Some authors have used five thematic layers of drainage density, lineament density, slope, land use/land cover and lithology [39]. However, some authors have used ten factors like, altitude, average slope, geology, lineament density, geomorphology, soil type, land use/land cover, mean annual precipitation, drainage density, and distance from river [15]. In the present study six factors (Geology, drainage density, slope, land use, geomorphology, and lineament density) that have pronounced control on the occurrence of groundwater in the area have been considered. Likewise, there are various methods for assessing groundwater prospect zones, like quantitative, semi-quantitative and knowledge driven [15,40- 48]. In the present study, the knowledge driven technique has been used, which yields reasonable output as thorough knowledge of the field area is achieved during the field investigation.
Conclusion
The study area consists of Lesser Himalayan and Higher Himalayan rocks. The Higher Himalayan rocks are characterized by Formation I represented by banded gneiss and the five litho-units of the Lesser Himalaya represented by Calcareous Metasandstone, Marble, Schist and Quartzite. Total of 28 springs were mapped during spring inventory in the study area. Lithology, land use, geomorphology, drainage density, lineament density and slope were considered as the controlling factors for groundwater occurrence in the study area. The factor maps were assigned weight and rank values to obtain score of each map then integrated to obtain groundwater prospect map for the study area. The resulting map was validated using and 28 springs that were mapped. The high prospect zone consists of 16 springs, moderate prospect zone consists of 10 springs and low prospect zone consists of only 2 springs. The groundwater prospect zones demarcated in the present study reasonably represents the field condition of groundwater occurrence and the map can be used for detailed exploration at specific site for groundwater exploitation to meet the growing demand of water in the area. This is specifically important in view of climate change that is supposed to change the future precipitation pattern and depletion of groundwater table thereby limiting the water availability through natural springs and streams. Further, the method proposed to assess groundwater availability in the mountainous terrain of west Nepal can be replicated in other areas of the region.
Acknowledgement
This study was partially supported by the research grant received by first author for the project entitled “Marsyangdi River Basin Water Induced Disaster Triggered by Climate Change and its Prognostic Projection” (RGP-004) under the climate change research grants program implemented by Nepal Academy of Science and Technology (NAST) and financed by the climate investment funds, administered by the Asian Development Bank (TA 7984-NEP).
References
- Pathak D, Shrestha SR (2016) Delineation of groundwater potential zones in rocky aquifers in the mountainous area of Central Nepal. Journal of Nepal Geological Society 50: 161-169.
- Magesh NS, Chandrasekar N, Sounddranayagram JP (2012) Delineation of groundwater potential zones in Theni district, Tamil Nadu, using remote sensing, Geographic Information system (GIS) and Multi Influencing Factor (MIF) techniques. Geoscience frontiers 3(1): 189-196.
- Preeja KR, Joseph S, Thomas J, Vijith H (2011) Identification of Groundwater Potential Zones of a Tropical River Basin (Kerala, India) Using Remote Sensing and GIS Techniques. Journal of Indian Society of Remote Sensing 39(1): 83-94.
- Sitender R, Rajeshwari S (2011) Delineation of groundwater potential zones in Mewat District. Haryana, international journal of geomatics and geosciences 2(1): 270-281.
- Rao PJ, Harikrishna P, Srivastava SK, Satyanarayana PVV, Rao BVD (2009) Selection of Groundwater Potential Zones in and around Madhurawada Dome, Visakhapatnam District A GIS Approach. The Journal of Indian Geophysical Union 13(4): 191-200.
- Sener E, Davraz A, Ozcelik M (2005) An integration of GIS and remote sensing in groundwater investigations: A case study in Burdur, Turkey. Hydrogeology Journal 13(5-6): 826-834.
- Rao YS, Jugran DK (2003) Delineation of groundwater potential zones and zones of groundwater quality suitable for domestic purposes using remote sensing and GIS. Hydrological Sciences Journal 48(5): 821-833.
- Krishnamurthy JN, Venkatesa K, Jayaraman V, Manivel M (1996) An approach to demarcate ground water potential zones through remote sensing and geographical information system. International journal of Remote Sensing 17(10): 1867-1884.
- Gautam M, Pathak D (2019) Spring inventory and impact of Gorkha Earthquake in spring in lower part of Daraudi basin, Gorkha district, western Nepal. In: Proceedings of International (SAAARC) Youth Scientific Conference (IYSC) 2019. Ministry of Industry, Tourism, Forest and Environment Government of Nepal and Central department of Hydrology and Meteorology, Tribhuvan University Nepal, pp: 316-325.
- Bajracharya AR, Bajracharya SR, Shrestha AB, Maharjan SB (2018) Climate change impact assessment on the hydrological regime of the Kaligandaki Basin, Nepal. Science of the Total Environment 625: 837-848.
- Khadka D, Pathak D (2016) Climate Change projection for the Marsyangdi river basin, Nepal using statistical downscaling of General Circulation Model (GCM) and its implications in Geodisasters. Geoenvironmental disaster 3: 15.
- Vörösmarty CJ, Green P, Salisbury J, Lammers RB (2000) Global water resources: Vulnerability from climate change and population growth. Science 289(5477): 284-288.
- Shrestha AB, Wake CP, Mayewski PA, Dibb JE (1999) Maximum Temperature Trends in the Himalaya and its vicinity: An analysis based on temperature records from Nepal for the Period 1971- 94. Journal of Climate 12(9): 2775-2786.
- Deepika B, Avinash K, Jayappa KS (2013) Integration of hydrological factors and demarcation of groundwater prospect zones: Insights from remote sensing and GIS techniques. Environ Earth Science 70(3): 1319-1338.
- Maity DK, Mandal S (2019) Identification of groundwater potential zones of the Kumari river basin, India: an RS & GIS based semi quantitative approach. Environment, Development and Sustainability 21(2): 1013-1034.
- Jaiswal RK, Mukherjee S, Krishnamurthy J, Saxena R (2003) Role of remote sensing and GIS techniques for generation of groundwater prospect zones towards rural development an approach. International Journal of Remote Sensing 24(5): 993-1008.
- Poudel S (2017) Structural geology and microtectonics of Baluwa Barpak Bhachheck area, Gorkha, western Nepal. Unpublished M Sc Thesis Central Department of Geology, Tribhuvan University, Kathmandu.
- Oli LM (2017) Geological mapping, petrography, metamorphism of Jhyallaphat-Barpak-Bhacheck Area, Lesser Himalaya, Gorkha District West Central Nepal. Unpublished M.Sc Thesis, Central Department Geology, Tribhuvan University, Kathmandu.
- Dhital MR (1995) Mode of occurrence of nephelinesyenites in Gorkha Ampipal area, central Nepal Lesser Himalaya. Journal of Nepal Geological Society (Special Issue) 11: 159-170.
- Amatya KM, Jnawali BM (1994) Geological Map of Nepal. Published by the Department of Mines and Geology, Kathmandu, Nepal.
- DMG (Department of Mines and Geology), 1987. Geological map of Central Nepal in 1:250000 scale. Published by the Department of Mines and Geology.
- Shrestha SB, Shrestha JN, Sharma SR (1987) Geological map of central Nepal (Scale 1:250,000). Department of Mines and Geology, Kathmandu.
- Stöcklin J (1980) Geology of Nepal in its regional frame. Journal of Geological Society, London 137: 1-34.
- Stöcklin J, Bhattarai KD (1977) Geology of the Kathmandu area and Central Mahabharat Range, Nepal Himalaya. Report of Department of Mines and Geology/ United Nations Development Programme (UNDP), New York, USA.
- Le Fort P (1975) Himalayas: The Collided Range. Present Knowledge of the Continental Arc American Journal of Science 275(A): 1-44.
- Ohta Y, Akiba K, Maruo Y (1973) Pokhara-Gorkha Region. In: Dhital MR, 2015. Geology of the Nepal Himalaya: Regional perspective of the classical collided orogen. Springer International publishing Switzerland.
- Rao NS (2003) Groundwater prospecting and management in agro-based rural environment of crystalline terrain of India. Environmental Geology 43: 419-431.
- Teixeiraa J, Chamine HI, Carvalho JM, Pe´rez-Albertic A, Rocha F (2013) Hydrogeomorphological mapping as a tool in groundwater exploration. Journal of Maps 9(2): 263-273.
- Sidle RC, Onda Y (2004) Hydrogeomorphology: overview of an emerging science. Hydrol. Process 18: 597-602.
- Dunne T (1994) Hydrogeomorphology: An introduction. Transactions. Japanese Geomorphological Union 15A: 1-4.
- Scheidegger AE (1973) Hydrogeomorphology. Journal of Hydrology 20(3): 193-215.
- Sander P (2007) Lineaments in groundwater exploration: A review of applications and limitations. Hydrogeology Journal 15(1): 71-74.
- Chandra S, Rao VA, Krishnamurthy NS, Dutta S, Ahmed S (2006) Integrated studies for characterization of lineaments used to locate groundwater potential zones in a hard rock region of Karnataka, India. Hydrogeology Journal 14(6): 1042-1051.
- Tam VT, De Smedt F, Batelaan O, Dassargues A (2004) Study on the relationship between lineaments and borehole specific capacity in a fractured and karstified limestone area in Vietnam. Hydrogeology Journal 12(6): 662-673.
- Sander P, Minor TB, Chesley MM (1997) Groundwater exploration based on lineament analysis and reproducibility tests. Ground Water 35(5): 888-894.
- Mabee SB, Hardcastle KC, Wise DW (1994) A method for collecting and analyzing lineaments for regional-scale fractured bedrock aquifer studies. Ground Water 32(6): 884-894.
- Lattman LH, Parizek RR (1964) Relationship between fracture traces and the occurrence of groundwater in carbonate rocks. Journal of Hydrology 2: 73-91.
- Bryan K (1919) Classification of spring. The Journal of Geology 27(7): 522-561.
- Dwivedi L, Gupta DS, Tripathi S (2016) Groundwater potential mapping of Ukmeh River watershed area of Upper Vindhyan region using Remote Sensing and GIS. Indian Journal of Science and Technology 9(36).
- Ghosh P, Jana N (2017) Groundwater potentiality of the Kumari River Basin in drought-prone Purulia upland, Eastern India: A combined approach using quantitative geomorphology and GIS. Sustainable Water Resources Management.
- Al-Abadi A (2015) Groundwater potential mapping at northeastern Wasit and Missan governorates, Iraq using a data-driven weights of evidence technique in framework of GIS. Environmental Earth Sciences 74(2): 1109-1124.
- Manap M A, Nampak H, Pradhan B, Lee S, Ramli MF, et al. (2014) Application of probabilistic-based frequency ratio model in groundwater potential mapping using remote sensing data and GIS. Arabian Journal of Geoscience 7(2): 711-724.
- Moghaddam D, Rezaei M, Pourghasemi H, Pourtaghie Z, Pradhan B (2013) Groundwater spring potential mapping using bivariate statistical model and GIS in the Taleghan Watershed, Iran. Arabian Journal of Geosciences 8(2): 913-929.
- Lee S, Song KY, Kim Y, Park I (2012) Regional groundwater productivity potential mapping using a geographic information system (GIS) based artificial neural network model. Hydrogeology Journal 20(8): 1511-1527.
- Pourghasemi HR, Pradhan B, Gokceoglu C (2012) Application of fuzzy logic and analytical hierarchy process (AHP) to landslide susceptibility mapping at Haraz watershed, Iran. Natural Hazards 63(2): 965-996.
- Le Page M, Berjamy B, Fakir Y, Bourgin F, Jarlan L, Abourida A, et al. (2012) An Integrated DSS for groundwater management based on remote sensing. The case of a semi-arid aquifer in Morocco. Water Resources Management 26(11): 3209-3230.
- Jha MK, Chowdary VM, Chowdhury A (2010) Groundwater assessment in Salboni block, west Bengal (India) using remote sensing, geographical information system and multi-criteria decision analysis techniques. Hydrogeology Journal 18(7): 1713-1728.
- Corsini A, Cervi F, Ronchetti F (2009) Weight of evidence and artificial neural networks for potential groundwater spring mapping: An application to the Mt. Modino area (Northern Apennines, Italy). Geomorphology 111(1-2): 79-87.

Top Editors
-

Mark E Smith
Bio chemistry
University of Texas Medical Branch, USA -

Lawrence A Presley
Department of Criminal Justice
Liberty University, USA -

Thomas W Miller
Department of Psychiatry
University of Kentucky, USA -

Gjumrakch Aliev
Department of Medicine
Gally International Biomedical Research & Consulting LLC, USA -

Christopher Bryant
Department of Urbanisation and Agricultural
Montreal university, USA -

Robert William Frare
Oral & Maxillofacial Pathology
New York University, USA -

Rudolph Modesto Navari
Gastroenterology and Hepatology
University of Alabama, UK -

Andrew Hague
Department of Medicine
Universities of Bradford, UK -

George Gregory Buttigieg
Maltese College of Obstetrics and Gynaecology, Europe -

Chen-Hsiung Yeh
Oncology
Circulogene Theranostics, England -
.png)
Emilio Bucio-Carrillo
Radiation Chemistry
National University of Mexico, USA -
.jpg)
Casey J Grenier
Analytical Chemistry
Wentworth Institute of Technology, USA -
Hany Atalah
Minimally Invasive Surgery
Mercer University school of Medicine, USA -

Abu-Hussein Muhamad
Pediatric Dentistry
University of Athens , Greece

The annual scholar awards from Lupine Publishers honor a selected number Read More...


