


Lupine Publishers Group
Lupine Publishers
ISSN: 2641-6794
Research Article2641-6794 
Comparing Growing Stock using Circular, Square and Rectangular Plots Shape in Inventory (A study from Community Forests in Chitwan District, Nepal) Volume 4 - Issue 1
Received: October 11, 2019; Published: October 23, 2019
Corresponding author: Ram Asheshwar Mandal, School of Environment Science and Management, Nepal
DOI: 10.32474/OAJESS.2019.04.000177
Abstract
This study was objectively done to compare between estimated growing stocks from sampling using rectangular, square, and circular plot and complete enumeration and assess efficient sample plot shape for inventory. Jaldevi and Panchkanya community forests (CF) of Chitwan district in Nepal were selected for study. Complete inventory and systematic sampling with varying shapes were applied. Altogether 135 plots were measured; 15 plots for each stage (tree, pole, and sapling) and each plots shape. The diameter and height were measured, and numbers of plants were counted. Time was recorded for plot layout and measurement and calculation. Growing stock was calculated and compared for both data obtained from complete inventory and sampling with varying shapes. Result showed that, stock density was 121 trees/ha in total enumeration, while estimated values were 120±16, 116±13.94 and 108±12.3826 trees/ ha from sampling using circular, square and rectangular plots respectively. The difference in stand density was 1, 5 and 13 tree/ha with the value of complete enumeration and estimated from sampling using circular, square and rectangular plots respectively. Similar differences were found between values of basal area and volumes estimated using different shapes and complete enumeration. However, the One-way ANOVA showed that, none of stocks (density, basal area and volume) was significantly differed (P >0.05) and so as independent t-test (P>0.05). It was the highest estimated value of E2 T with 33582.51 for rectangular shape and least 11226.62 for circular plot of stand density/ha at tree stage. So, the circular shape is more efficient for forest inventory. Keywords: Inventory; Sampling; Plot shape; Growing stock; Sampling efficiency.
Keywords: Inventory; Sampling; Plot shape; Growing stock; Sampling efficiency
Introduction
It is believed that, surveying and inventory of trees was started since late 18th century [1]. But there was a misconception of fear that wood would run out. Another interesting storey about this was estimation of volume and dispersal of tree in 19th century [2]. In fact, the harvesters did this task in small forest tracks applying visual observation technique. This was starting of inventory work. After that, it was noted that there was a possibility to reduce cost using representative samples [3]. So, Loetsch et al. [3] stated that visual estimation was used until 1940’s in Germany. Then, the visual estimation was combined with statistical estimates in order to reduce the bias [4]. In this way, the statistical tools were gradually introduced in forest inventory between 1900 and 1920, primarily in Scandinavia [3] but this study was only done for small scale forest in Sweden. The systematic strip sampling was used to carry out the inventory during 1830’s [5]. Furthermore, Schumacher and Bull (1930) began the formalization of sampling methods in forest inventories in the United States, introducing the sampling errors as its part of process [6]. There is no long history of application of satellite imagery in forest inventory, first time it was used for mapping the forest in 1980 [7]. In recent years, information from satellite images and drone tools and techniques have frequently been used in forest inventory [7,8].
It is even interesting storey of forest inventory in Asia. The former Agriculture and Forestry Ministry (AFM) of China organized first time forest inventory in 1950 to1962, collaboration with the provincial forest departments [9]. Bhutanese forest experts first time done the forest inventory in 1974 with the support from India (DOFPS, 2012). Similarly, Indian history of forest inventory showed that, the inventory was started in eighteenth’s century in Indian forests. However, the robust method was adopted after 1965 applying the ground-base data and Arial photography together [10]. The late 1970s and early 1980s, were considered as important era in forest inventory in India. These days, the forest inventory is regular work in India, it is in every 2-year using satellite image as well [11].
More importantly, history of forest inventory in Nepal was started after 1960’s. The First National Forest Inventory was carried out between 1963 and 1967 in Nepal with the technical collaboration of USAID. That time, the aerial photographs was used in inventory (FAO, 2007) [12]. Then, Nepal has been practicing general inventory in every 10 years period (LRMP, 1986). The recent inventory was done in 2010-2014 (DFRS, 2015) [13].
Assessing and measuring the trees and their characteristics provide significant information for planner and policy maker. Specifically, growing stock is very important component which gives the information about number of plants, basal area, volume, biomass, increment and carbon stock per unit area [14]. Indeed, important issue in inventory is precision which have been overlooked so far [15,16]. The estimation of forest parameter requires highly precise data and so as proper selection of sampling method [17]. The determination of appropriate number of sample plot and choice of pertinent size and shape of sample plot are needed to estimate the growing stock precisely [18]. Otherwise the result may have high uncertainty in stocks prediction and failure in implementation of forest management plan [19]. Specifically, various studies suggest that plot shape matters on estimation of growing stock and plant diversity [20] because the sample plot shape determines the number of plants in the sample. Even a single tree in and out can make large differences to estimate the growing stock, further analysis and ultimately management prescription. Realizing, this research problem, the study was objectively carried out to assess the effect of sample plot shape in estimation of growing stock (stand density, basal area, and volume) and to find the most efficient sampling design.
Materials and Methods
Based on available information from division forest office and discussion with experts, 2 Community forests (CF) namely Jaldevi CF and Panchakanya CF of Chitwan district were selected as study sites. Chitwan district lies in Province No. 3 and occupies 2, 23,970 ha area. Its latitude is 27°36′21.60″ North and longitude is 84°22′47.28″ East. The elevation ranges from 141-1147m. Out of total land area, forest area covers 1,47,490 ha (65.8%) including national park. Total population of the district is 5,79,984 among which 51.5% (3, 00,897) are female and 48.5% (2, 71,087) are male (CBS) [12]. The selected community forests comprise various stages of plants specifically tree, pole and regeneration in different strata.
Jaldevi community forest
This CF is situated in ward number 2 of Bharatpur municipality (Figure 1). The area of the community forest is 197.87ha but the productive forest area is only 185ha. Total 600 households are the user of this CF. The slope range is 0˚-10˚. It is natural forest type with Shorea robusta as dominant species and Terminalia tomentosa, Cleistocalyx operculatus, Mallotus philippensis etc as associate species.
Figure 1: Map of study area showing Nepal, Chitwan district and two community forests. Note: in figure a: Map of Nepal; b: Map of Chitwan district; c: Panchkanya CF and d: Jldevi CF.

Panchakanya community forest
Panchakanya CF is situated in ward number 11of Ratnanagar municipality (Figure 1). The estimated area of community forest is 198.73 ha but the productive forest area is 182 ha. The Shorea robusta, Acacia catechu, Trewia nudiflora, and Dalbergia sissoo are major plant species in the forest. Total user of this forest is 1807 households.
Data collection and analysis
The primary and secondary data were collected to conduct this research work. A preliminary survey was carried out initially to conceptualize the situation and to identify the appropriate site for field data collection [22]. The selected forest areas were surveyed and mapped (DoF) [23]. The experimental area was delineated inside the forest for tree, pole and sapling having 2.5, 0.5 and 0.125 ha respectively. Forest inventory was conducted in two stages. In first stage, the forest area was completely inventoried. Secondly, sampling was done systematically using predetermined sample plot shapes viz. rectangular, square and circular. Sample plots having 500m2, 100m2, and 25m2 were adopted for tree, pole and sapling respectively (DoF) [23]. Altogether 135 plots were measured; 15 plots for each stage (tree, pole, and sapling) for all three shapes (Table 1).
Table 1: Sample plot shape and size according to strata. (Source: DoF, 2004).

Sample plots were allocated maintaining the uniform spacing of sample units. The sample plots were laid in such a way that all the plot shapes (i.e., square, rectangular and circular) would have same plot centre (concentric approach) covering a same area (Figure 2).
Figure 2: Sampling design for Rectangular, Square and Circular plots with same plot center.

Plot lay out
Firstly, the tree plot was designed and then pole as well as sapling plots were set accordingly. The length and width having 200m×250m specified for sampling. Inside it, 15 sample points were allocated maintaining equal spacing 40 m plot to plot and line to line. Then, the tree plot was established with 25m×20m for tree and concentric plots for pole and sapling were made having size of 10m×10m and 5m×5m. respectively. The circular plots were also established maintaining the same respective areas.
Measurement
The plants inside the plot were tagged. The diameter and height were measured using D-tape and Range finder respectively; species were noted and recorded during complete inventory and all the measured trees were tagged. Time taken for plot lay out to measurement were recorded. Besides, the secondary data were collected from different sources such as district five years forest management plan, community forest operation plan, journals, reports, books and research papers.
Collected data were analyzed using simple mathematical as well as statistical tools. Calculation of growing stock particularly stand density, basal area and volume was done using following formulae;
Density of plants=No. of plants/ ha
Basal area= 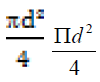 (Chaturvedi and Khanna, 1994)
Volume= 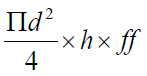
whereas, d= DBH, h= height and ff is the form factor i.e. 0.5 ((DoF, 2004).
Appropriate inventory method for the forest can be determined by
(E %)2 ×T
Whereas, E% = percentage of sampling error and T =total inventory time (FAO, 1992).
Statistical analysis
Both descriptive as well as inferential statistics were used. The collected were examined their normality using Shapiro- Wilk normality and that performed normal. So, one-Way ANOVA was applied to compare the result among the total enumeration, sampling with rectangular, square and circular plot shape.
Result
Growing stock status based on complete inventory and varying plot shapes
Growing Stock Status in Tree: In the complete inventory, stock density was 121 trees/ha, while the estimated values were 120±16, 116±13.94 and 108±12.3826 trees/ ha from sampling using circular, square and rectangular plots respectively. Basal area was found to be 25.72 m2/ha in complete inventory while estimated values were 22.29±2.75, 22.01±2.01 and 21.65±1.99 m2/ha from sampling using circular, square and rectangular plots respectively. The volume of trees wsas found to be 251.59 m3/ha in complete inventory while the estimated values from sampling using circular, square and rectangular plot were 229.78±29.17, 228.29±21.36 and 224.17±21.34 m3/ha respectively (Table 2).
Table 2: Growing stock status in Tree, Pole, and Sapling. (Source: Field survey, 2019).

Growing stock in pole stage: In the complete inventory, 787 stands /ha were recorded, while the estimated values were 760±43.49, 748±45.56 and 740±37.54 stands/ ha applying circular, square and rectangular sample plots respectively. Basal area was 19.86 m2/ha in complete inventory, but the values were around 19.78±1.9, 18.91 ±1.88 and 18.36±1.75 from sampling using rectangular, square and circular plots respectively. The volume was 168.85 m3/ha from total enumeration, while the estimated values were 165.77±±19.13, 158.39±17.36 and 154.18 ±17.3 m3/ha from sampling using circular, square and rectangular respectively (Table 2).
Growing stock status in sapling: In the complete inventory, 2587 saplings/ha were recorded, while estimated values were 2400±275.65, 2293 ±273.25 and 2208±313.42 saplings/ ha from sampling using rectangular, square and circular plots showed the respectively. The values of circular plots were very close to the total enumeration.
Comparison of Growing Stocks using Complete Inventory and Estimated using Sampling with Various Plot Shapes
The result showed that, there was some level of differences in stand density, basal area and volume between the value of total enumeration and sampling using different shapes. The differences in stand density were 1, 5 and 13 tree/ha calculated from complete enumeration and estimated from sampling using circular, square and rectangular plots respectively. The estimated basal area per ha and volume per ha using sampling of circular, square and rectangular showed underestimated by 3.43, 3.71, and 4.07 m2/ha respectively as well as 21.81, 23.3, and 27. 42 m3/ha simultaneously with complete enumeration (Table 3).
Table 3: Differences in growing stock of varying plot shape with that of complete inventory. Note: CI- Complete Inventory, RP -Rectangular Plot, SP-Square Plot, CP-Circular Plot. (Source: Field survey, 2019).

In pole stage, the difference in values with complete inventory as well as circular, square and rectangular plot shapes also underestimated and hence differences in stand density were 27, 39 and 47 stands/ha, in basal area were by 0.08, 0.95 and 1.5 m2/ha, and in volume were 3.08, 10.46 and14.67 m3/ha respectively (Table 3). The values in in sapling stage, also showed underestimated in stand density by 187, 294, 379 N/ha in sampling with circular, square and rectangular respectively with complete enumeration (Table 3).
Stand density (trees/ha), basal area (m2/ha), and volume (m3/ ha) from complete inventory and sampling with rectangular, square and circular sample plots were compared using One-way ANOVA. Statistically, the result showed that, none of them were found differed significantly (P >0.05) at 5% level of significance. Similarly, independent t-test also showed, there was no significant (P>0.05) difference between the value from total enumeration and estimated value from sampling using different shapes.
Efficient plot shape for forest inventory
The product of square of Errors and Time (E2×T) taken was estimated for growing stock to understand the efficiency in measurement of sample plot. The highest E2×T was found in estimated value using rectangular plot and least value using circular in case of growing stocks at each stage of the plant. It was the highest estimated E2T 33582.51 using rectangular shape and the least 11226.62 using circular plot of stand density/ ha at tree stage. So, the circular shape is more efficient for forest inventory (Table 4).
Table 4: Value of E2T values in estimated growing stock. (Source: Field survey, 2019).

Discussion
Growing stock status based on complete inventory and varying plot shapes
The current study basically emphasizes on variation in stand density, basal area and volume according to the sample plot shape. According to Kangas and Maltamo [5], as circular plots represent the geometrical figure of lowest perimeter for a given size, they reduce the number of edge trees compared to other plot shapes of the same size. This is matching with the findings of our research. Also, the current study is in line with the study carried out by Paul et al. [24] in New Zealand. It shows that, the estimated stem density of large diameter trees based on trees measured in circular plots was close to the value of total enumeration.
The estimated value using square plot showed close to the value of total enumeration, but it was the highest differences in estimated growing stocks using rectangular plot. This finding was also supported by Bormann [25], the longer and narrower the plot is, the greater is its periphery in comparison to a square plot of the same area. Thus, the greater would be the possibility for making cumulative edge errors. The edge effect depends up on the sample plot shape and size [26].
Almeida et al. [19] reported similar result, comparing sampling methods based on plots of fixed area and based on a fixed number of trees. The average DBH, the average Height, the number of stems, the basal area and the volume of each plot were obtained for 30 plots for each of the three methods (Fixed area of rectangular plot, Fixed area of circular plot and Fixed number of trees) of plot setup. There was less differences in values estimated using the circular plot than circular plot. But, t-test with 95% of confidence level, none of them were found differed significantly.
In contrast, Mirzaei and Bonyad [27] when compared the mean basal area derived from the systematic random sampling and transect sampling methods with the actual value of these variables derived from the 100 % inventory found that the two sampling methods showed significantly difference in the values. This may be due to applying less sampling intensity (10%) in their study in comparison to current study (30%), as the higher sampling intensity, the more representative the result is.
Efficient plot shape for forest inventory
The efficiency of estimated values using different sample plot shape was studied with respect to time and the estimator using (E %)2×T. The total time taken to layout the plot, measurement and analysis were recorded for each plot at all stages to conduct this study. The least time was recorded for circular plot, but the highest time was recorded for rectangular plot sampling. This study is in line with the finding of study done by Pellico et al. [28] in which form of sample units was analyzed considering the minimum total time spent to locate and measure them. According to Mirzaei and Bonyad (2016), the most appropriate inventory method for the forest can be determined by (E %)2×T, the method with lowest (E %)2×T is the most economical for ease and speed [29]. The estimator (E %)2×T for the circular sample plot was lowest among the square and rectangular plots in our research as and thus more economical for the study [30,31].
Conclusion and Recommendation
Among three plot shapes (circular, square and rectangular), estimated value obtained using circular plot showed the highest stand density, basal area and volume which was very close to the value obtained from total enumeration. The differences in values of growing stock estimated using rectangular plot was the highest than the value of total enumeration. The E2T value was the highest for rectangular plot and least for circular plot. So, the circular plot is the most efficient for forest inventory. This study was done in plain area so similar types of study should be carried out in hilly areas to find the efficient method.
References
- Kenkel NC, Juhasz Nagy P, Podani J (1989) On sampling procedures in population and community ecology. Vegetation 83(1-2): 195-207.
- Tomppo E, Heikkinen J, Henttonen HM, Ihalainen A, Katila M, et al. (2011) Designing and conducting a forest inventory - Case: 9th National Forest Inventory of Finland. Springer, Managing Forest Ecosystems 21. pp. 270.
- Lotesch F, Zohrer F, Haller K (1973) Forest Inventory. BLV Verlagsgesellschaft, pp 436-469.
- Frayel WE (1974) The increasing complexity of large forest inventories. Journal of Forestry 72(9): 578-579.
- Kangas A, Maltamo M (2007) Forest inventory: methodology and applications. Springer: Dordrecht.
- Luoma V, Saarinen Ninni, Wulder Michael A, White Joanne C, Vastaranta M, et al. (2017) Assessing Precision in Conventional Field Measurements of Individual Tree Attributes. Forests 8(2): 1-14.
- McRoberts, RE, Tomppo EO, Vibrans AC, de Freitas JV (2013) Design considerations for tropical forest inventories. Pesquisa Florestal Brasileira. Brazilian Journal of Forestry Research 33(74): 1-14.
- Gunlu A, Zeki EB, Kadıogullar IA, Altun L (2008) Forest site classification using Landsat 7 ETM data; A case study of Maçka-Ormanüstü forest, Turkey. Environment Monitoring and Assessment 151(1-2): 93-104.
- Zeng W, Tomppo E, Healey Sean P, Gadow Klaus V (2015) The national forest inventory in China: History-results-international context. Forest Ecosystem 2-23.
- Fagan M, De Fries R (2009) Measurement and monitoring of the world's forests; A review and summary of remote sensing technical capability, 2009-2015. RFF report.
- Chaturvedi AN, Khanna LS (1994) Forest mensuration and biometry. Khanna Bandhu, Dehradun, India.
- FAO (2007) Brief in national forest inventory (NFI) Nepal. MAR-SFM Working Paper 24, Rome, Italy.
- DFRS (2015) State of Nepal’s Forests. Department of Forest Research and Survey (DFRS). Forest Resource Assessment (FRA), Kathmandu, Nepal.
- Singh I, Roy PS (1990) Growing stock estimation through stratified sampling on satellite remote sensing data. Journal of the Indian Society of Remote Sensing 18(1-2): 29-42.
- Ojha HR (2002) Critical assessment of scientific and political dimensions of the issue of community forest inventory in Nepal Forest Action.
- Hull J, Ojha HR, Paudel KP (2010) Forest inventory in Nepal- technical power or social empowerment? In: Lawerence A (Ed.), Taking stock of nature: Participatory Biodiversity Assessment for Policy, Planning and Practice. Cambrigde University Press. UK.
- Clapham AR (1932) The form of the observational unit in quantitative ecology. Journal of Ecology 20(1): 192-197.
- Jyrki J, Vanha I, Tina T (1998) Optimal sample and plot size for inventory of field and ground layer vegetation in a mature Myrtillus-type boreal spruce forest. Annales Botanici Fennici 35(3): 191-196.
- Almeida DRA, Leite HG, Gorgens EB (2016) Eucalyptus stand sample plots compared: Fixed area and fixed number of trees. Revista Árvore 40(3): 529-533.
- Keeley JE, Fotheringham CJ (2005) Plot shape effects on plant species diversity measurements. Journal of Vegetation Science 16(2): 249-256.
- CBS (2012) National Population and Housing Census 2011. Nepal.
- Sharma ER, Pukala T (1990) Volume Equation and Biomass Prediction of Forest Trees of Nepal, Publication 47. Forest Research and Statistics Division, Nepal.
- DoF (2004) Community Forestry Inventory Guideline. Department of Forests, Community Forestry Division, Nepal.
- Paul TSH, Kimberley MO, Beets PN (2018) Thinking outside the square: Evidence that plot shape and layout in forest inventories can bias estimates of stand metrics. Methods Ecol Evol 10(3): 381-388.
- Bormann FH (1953) The Statistical Efficiency of Sample Plot Size and Shape in Forest Ecology. Ecology 34(3): 474-487.
- Laurance WF, Ferreira LV, Rankin-de Merona JM, Hutchings RW (1998) Influence of Plot Shape on Estimates of Tree Diversity and Community Composition in Central Amazonia. Biotropica 30(4): 662-665.
- Mirzaei M, Bonyad A (2015) Transect sampling method with k-tree fixed number: A fast and accurate method to estimate quantitative variables in open forests. Forestry Ideas 21(2): 163-171.
- Péllico Netto S, Tello JCR, Wandresen RR (2014) Size and Shape of Sample Units in Native Forests and Plantations. Open Journal of Forestry 4(4): 379-389.
- Salako KV, Kakai RLG, Assogbadjo AE, Fandohan B, Houinato M, Palm R (2013) Efficiency of inventory plot patterns in quantitative analysis of vegetation: A case study of tropical woodland and dense forest in Benin, Southern Forests. A Journal of Forest Science 75(3): 137-143.
- Messavage C, Grosenbauch L (1956) Efficiency of Several Cruising Designs on Small Tracts in North Arkansas. Journal of forestry 54(9): 569-576.
- FAO (1992) Manual of Forest Inventory with Special Reference to Mixed tropical forests. Food and Agriculture Organization of The United Nations, Rome, Italy.


-

Mark E Smith
Bio chemistry
University of Texas Medical Branch, USA -

Lawrence A Presley
Department of Criminal Justice
Liberty University, USA -

Thomas W Miller
Department of Psychiatry
University of Kentucky, USA -

Gjumrakch Aliev
Department of Medicine
Gally International Biomedical Research & Consulting LLC, USA -

Christopher Bryant
Department of Urbanisation and Agricultural
Montreal university, USA -

Robert William Frare
Oral & Maxillofacial Pathology
New York University, USA -

Rudolph Modesto Navari
Gastroenterology and Hepatology
University of Alabama, UK -

Andrew Hague
Department of Medicine
Universities of Bradford, UK -

George Gregory Buttigieg
Maltese College of Obstetrics and Gynaecology, Europe -

Chen-Hsiung Yeh
Oncology
Circulogene Theranostics, England -
.png)
Emilio Bucio-Carrillo
Radiation Chemistry
National University of Mexico, USA -
.jpg)
Casey J Grenier
Analytical Chemistry
Wentworth Institute of Technology, USA -

Hany Atalah
Minimally Invasive Surgery
Mercer University school of Medicine, USA -

Abu-Hussein Muhamad
Pediatric Dentistry
University of Athens , Greece
