Lupine Publishers Group
Lupine Publishers
Menu
ISSN: 2641-6794
Research Article2641-6794 
Assessing Flood Disaster Effect on Plant Biodiversity and Human Wealth (A Case Study of Three Small Rivers I.E. Khorkekhola, Itramkhola and Girighat Khola of Surkhet District) Volume 4 - Issue 3
Indra Bahadur Prachhain1, Seema Lamichhane2 and Ram Asheshwar Mandal3*
- 1Department of Forests and Soil Conservation, Nepal
- 12Kathmandu Forestry College, Nepal
- 3School of Environment Science and Management, Nepal
Received: November 22, 2019; Published: December 16, 2019
Corresponding author: Ram Asheshwar Mandal, School of Environment Science and Management, Nepal
DOI: 10.32474/OAJESS.2019.04.000187
Abstract
Floods are the most common natural disaster which damage several fatalities and resources in the world. Nepal is experiencing several flood events, but research related to this are very limited. Thus, this research was objectively carried out to show the variation in climatic variables (rainfall and temperature), to demonstrate the flood effect on plant biodiversity and to list out the effect of flood disaster on the human wealth. Both primary and secondary data were collected from the field using participatory rural approach and technique, related reports and publication. Altogether 27 household survey was carried out. Stratified random sampling was carried out in upper part, middle part and lower part. The sample plot having 10*10m2 were established at flood affected area as well as surrounding (non- affected area). This process was replicated at upper, middle and lower part of each selected river. Therefore, altogether 64 sample plots were calculated. Climatic data of the study area were collected from Department of Hydrology and Meteorology, Kathmandu. Calculated data were analyzed by using MS-Excel and other statistical tools. It was found that the highest rainfall was recorded about 799.3 mm in August of year 2014. According to locality of flood affected area, the most disastrous flood was occurred in 2014 due to the continuous and heavy rainfall. The Shannon’s index was the highest about 2.15 and Simpson’s index was the lowest 0.0026 in non-affected area at upper part of Khorka Khola. The Shannon’s index was the highest about 2.13 in non-affected area at middle part and Simpson’s index was the lowest about 0.015 in non- affected area of middle part of Itram Khola. At Girighat Khola, it was found that the Shannon’s index was the highest about 1.99 in non-affected area at upper part. The t-test showed that Shannon Weinner index was significantly lower at affected areas than the non-affected area at 95%confidence. Due to the flood disaster of 2014, five people had lost their life and many people and settlement area were harmed. Altogether, the total number of livestock loss was 369, property loss was about US $360680.12, total land loss was 1.552 ha and the number of tree loss which belongs to people was about 145.
Keywords: Flood Disaster; biodiversity; rainfall; flood affected area; human wealth
Introduction
Regular floods are part of people’s lives in various regions of the world, recurring with varying magnitudes and frequencies to which people have adapted for centuries. These floods are generally expected and welcomed in many parts of the world, since they enrich the soil and provide both water and livelihoods. Usually a flood is an overflow of water that submerges land, lowlying villages and towns or an unusual condition affected by inflow of the tide. Flood can also damage the environment (Integrated flood management tools series flood forecasting and early warning, 2013). Economic losses due to the effects of damaging floods have increased significantly around the world (Integrated Flood Risk Management in Asia, 2005). The frequency of natural disasters has been increasing over the years, resulting in loss of life, damage to property and destruction of the environment (Living with Risk, 2000). Flood losses reduce the assets of households, communities and societies through the destruction of standing crops, dwellings, infrastructure, machinery and buildings, apart from the tragic loss of life. In some cases, the effect of extreme flooding is dramatic, not only at the individual household level, but also in the country as a whole (Integrated Flood Management Concept Paper, 2009). The Fourth Assessment Report (2007) of the Intergovernmental Panel on Climate Change (IPCC) predicts “heavy precipitation events, which are very likely to increase in frequency, will augment flood risk”. The severe damages were recorded, and yield of crop reduced, cattle were killed, and human casualties were high due to flood. More than 100 people have been killed in monsoon floods in South Asia, as torrential rain caused chaos in several countries. Hundreds of thousands of people have been displaced, with many rescued from rising waters and housed in shelters. Nepal has suffered the highest death toll with over 75 people killed this week in floods and landslides. Across the border in India’s Bihar state, 22 people have died in heavy flooding and over 1.5 million people have been directly affected, with disaster response teams shifting many to safer places. In the north-eastern tea growing state of Assam a further 1.6 million people have been affected with at least 16 people losing their lives and over 100,000 sheltering in 472 relief camps [1].
Nepal is ranked 4th, 11th and 30th in terms of climate change, earthquake and flood risk respectively. Consequently, the poor, uneducated and unemployed people are compelled to make a living by settling in flood and land slide prone areas in the hills, Chure, Tarai plains and the urban and sub-urban areas. In the year 2013 and 2014 Nepal saw an overall increase of the disasters – particularly floods in various parts of the country. The floods that occurred in 2013 in Far Western Region particularly in Darchula district and the floods in 2014 in Mid-Western Region particularly in Banke, Bardia, Dang and Surkhet were the most frightening and devastating disasters that caused enormous losses to human lives and physical properties and plant biodiversity which was near the riverside. The climatic variables have been differed in every year. The annual temperature has been increasing and rainfall has also been varied. The flood and its damage have been recorded when there is high intensity of rainfall. So, the year when there is extreme rainfall, the flood records are high. Surkhet district lies in mid-hill of Nepal. Rain fall and temperature generally affect the district’s climatic condition. The climate variables determine the seasons and cropping pattern and cycle. The vegetation growth, regeneration, seed germination and phonological characteristics depend up on the climatic variables. In this context, variation in rainfall and temperature of this district has not been intensively analyzed. Therefore, this study is essential. In addition, the higher the rainfall the higher number floods and certainly the higher loss of the plant’s biodiversity [2-5]. The relation exists between the loss and damage of biodiversity as well as the climatic variables. The extreme drought and flood both affect the plants biodiversity. Increasing number of floods hazards are generally creating the plant to re-grow. Some plant species are threatened and some of them are close to extinct. So, flood is challenging issue in Nepal particularly in hilly districts like Surkhet. The study on biodiversity loss has not done yet especially due to flood in Surkhet. Therefore, this study is necessary. Moreover, casualties due to water disaster have been increasing day by day. Every year many people have been killed, they loss their property, building, cattle, crops and land. The records of these damages have not been assessed especially in Surkhet [6,7]. The flood creates a serious problem every year in Surkhet district. Some small rivers carry the boulders, stones and sands from upstream of hill damage the several lives in downstream [8-12]. However, such research work has not been done yet. Therefore, this research work is important. Therefore, this study was objectively carried out to show the variation in climatic variables (rainfall and temperature), demonstrate the flood effect on plant biodiversity and list out the effect of flood disaster on the wealth.
Materials and Methods
Study site
The study area was selected in Surkhet district. For this, three small rivers i.e. Khorkakhola,Itramkhola and Girighatkhola were selected. Khorkakhola is situated west of Birendranagar. Itramkhola is situated two kilometer east from the Birendranagar and Girighat is situated in the west about ten kilometers. They were the river which had mostly affected by flood disaster.
Sampling
Stratified random sampling was carried out in upper part, middle part and lower part of affected area and non-affected area .The sample plot having 25m*25m for tree and 10m*10m for pole were established at river affected area as well as surrounding ( nonaffected area ).The samples were taken from both side of the river. This process was replicated at up-stream, middle part and downstream of each selected river. Therefore, altogether 64 sample plots were calculated.
Biophysical data collection
The GPS coordinate of the central part of the sample was captured and coordinates of both side and river transect were also taken. The width of the rivers was measured. The vegetation which was situated in affected area and their surrounding (non-affected area) were identified and listed. At that time diameter and height of the tree were measured. The description of the affected and nonaffected area was carried out by capturing the photos.
Socio-economic data collection
Household survey, group discussion and meeting were carried out to collect the socio-economic data. Three household surveys were done each from upper site, middle and down-stream. This process was applied for all selected sites. Altogether 27 household surveys were carried out. Questioners were prepared to carry out the household survey. Questioners included affected property, human life, damaged crops, livestock, etc. The history of flood and rainfall were also recorded.
Climatic data
Both precipitation and temperature data of 31 years (1985- 2015) were collected from the Department of Hydrology and Metrology (DHM) for the analysis of climatic pattern of Surkhet district. Precipitation and temperature data were used from nearby station.
Data Analysis
Different layers of data from different source were processed, manipulated and analyzed through an integrated approach. Qualitative data were analyzed in descriptive manner and quantitative data were analyzed by using different statistical tools.
Biophysical data analysis
List of the vegetation were compared between flood affected area and non-affected area. Species diversity was assessed using Shannon diversity index (H’), Simpson’s diversity (D) and Stenson’s similarity index (SSI). The Shannon diversity index is a statistical parameter, which is intended to measure the biodiversity of an ecosystem [13]. The advantage of this index is that, it considers both the number of species and by having greater species evenness. The SSI is very simple measurement of beta diversity (comparison of diversity between two eco-systems) ranging from a value of 0 where there is no species overlap between the communities, to a value of 1 when exactly the same species are found in both communities.
Shannon wiener index (H’) = Σ Pi logpi...................................(i)
Simpson’s diversity, D = 1- Σ Pi² ..............,,,,,,,,........................(ii)
(Timberline Forest Inventory consultants, 2003), where, Pi is the relative abundance of each species, i.e. the proportion of individuals of a given species relative to the total no. of individual in the community.
Sorenson’s similarity index = 2c/(S₁ + S₂ )....................................( ii)
(Magutrran 1998)
Where, S₁ is the total no. of species recorded in the first community, S₂ is the total no. of species recorded in the second community and c is the no. of species common to both communities.
Socio-economic data analysis
This data was analyzed by collecting and comparing the household survey data such as property loss, crop damage, life, livestock, etc.
Climatic variables analysis: The trend of temperature and rainfall were analyzed and the correlation between rainfall and flood event-year was also established.
Result and Discussion
Rainfall Pattern between1985-2015
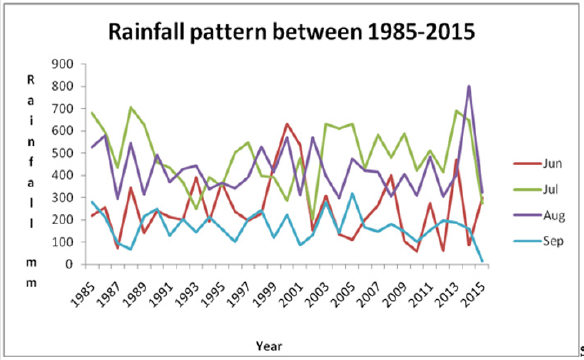
Generally, high rainfall records were reported in July month between 1985 to 2015 and it was followed by August. The highest rainfall was recorded about 799.3 mm in August of year 2014 but it was the lowest 17.6 mm in September of year 2015. The very low rainfall was recorded in between 1992 to 1995. These were only 132.2mm in 1992, 147.7 mm in 1994 in September. There was Survey low rainfall in September. There were few records which showed high intensity of rainfall: these were in 1987, 1989, 2001, 2004, 2006, 2014 and 2015. The flood occurs due to high intensity of rainfall for short duration. In this regard, the year 2014 was favorable for the flood because there was continuous rainfall in four months (Figure 1). The given figure showed total annual rainfall pattern in the period of 31 years from 1985 to 2015 of Surkhet district. The highest rainfall was recorded about 2113.5mm in 2013 and the lowest rainfall was in 2010 about 1947. 5mm.From 2002 to 2007, there was high intensity of rainfall about 1860mm to 1900mm. At the starting of 1985, the rainfall was about 2045.7mm and at 2015, the total rainfall was about 1208mm. This graph shows the 31 years (1985-2015) average monthly rainfall pattern [14-17]. The highest average rainfall was 484.48mm in July, second highest was 424.94mm in August and the lowest average rainfall was 7.33mm in November.
Species Richness around Khorka Khola
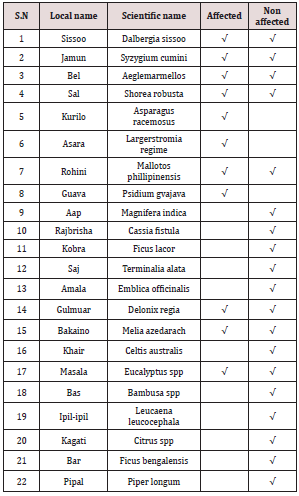
Altogether 22 plant species were found in the Khorka Khola, out of which three plant species were common on both affected and non-affected area. There were 19 species in non-affected area and 11 species in affected area (Table 1).
Species richness around Itramkhola
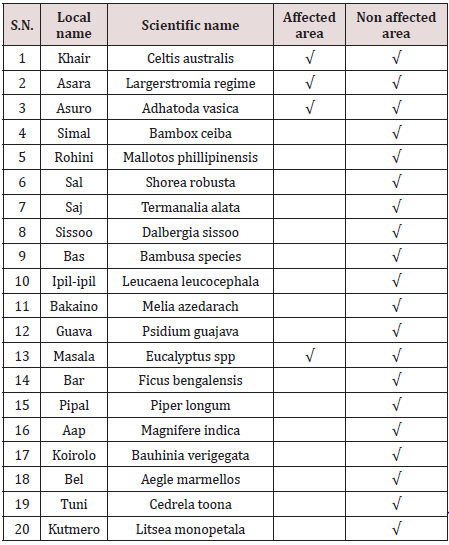
Total 20 species were recorded in the Itramkhola, out of which 4 plant species were common in both affected and non-affected area. In non-affected area, there were 20 species and in affected area only 4 species were found (Table 2).
Plant species at Girighatkhola
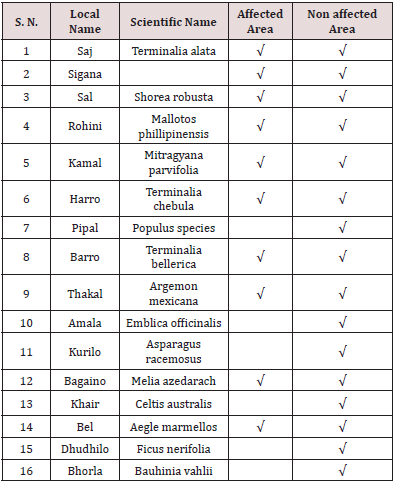
About 16 plant species were found in GirighatKhola, out of which 10 species were common in both affected and non-affected area. In non-affected area, there were 16 plant species and in affected area there were only 10 plant species (Table 3).
Simpson’s index and Shannon index of KhorkaKhola site
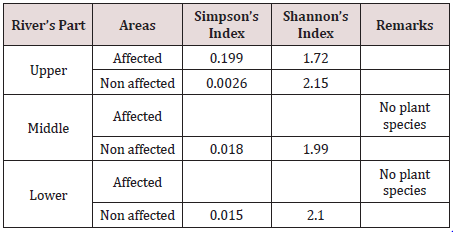
The Shannon’s index was the highest about 2.15 at the upper part of KhorkaKhola in non- affected area and lowest was about 1.72 in affected area of upper part .Similarly the Simpson index was the lowest about 0.0026 in non-affected area of upper part and highest about 0.199 in affected area of upper part. Lower the Simpson’s index value higher the diversity and higher the Shannon’s index value higher the diversity (Table 4).
Simpson’s index and Shannon index of Itramkhola
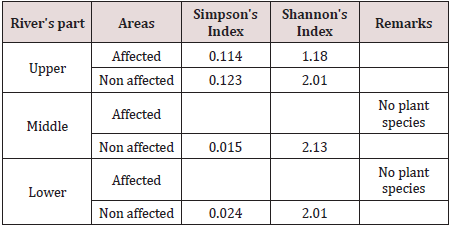
The Shannon’s index was the highest about 2.13 in non-affected area at middle part and the lowest was about 1.18 in affected area at the upper part of Itram Khola. Similarly, the Simpson’s index was the highest about 0.12 in non-affected area of upper part and lowest was about 0.015 in non- affected area of middle part (Table 5).
Simpson’s index and Shannon’s index of Girighat Khola
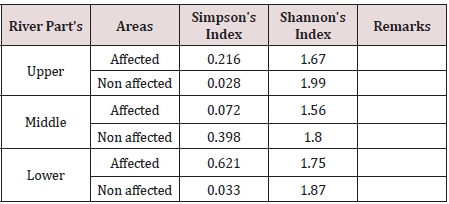
The Shannon’s index was the highest about 1.99 in non-affected area at upper part and the lowest was about 1.56 in affected area at the middle part of Girighat Khola. Similarly, the Simpson index was the highest about 0.621 in affected area of lower part and lowest was about 0.028 in non-affected area of upper part. Statistically, t-test showed that there was significant variation in Weiner index between affected and non- affected area of flood at KhorkaKhola at 95% confidence level and similar result was found at Itram Khola and Girighatkhola (Table 6).
Human Wealth: Loss of Livestock, Property, Land and Plant’s Biodiversity
Loss due to KhorkaKhola
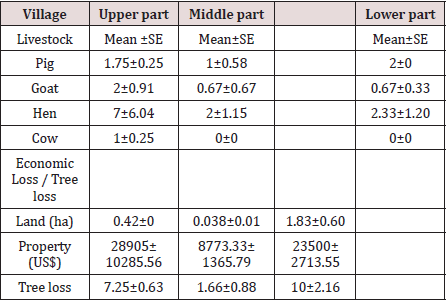
There was variation in loss of livestock, property and tree in different areas. It was found that the highest mean loss of livestock was hen about 7±6.04 and the lowest mean loss was cow about 1±0.25 in upper part. The highest mean loss of livestock in middle part was hen about 2±1.15 and there was no loss of cow. At the lowest part, the highest mean loss was 2.33±1.2 of hen and there was no loss of cow. It was recorded that the highest mean loss of property was US$ 28905±10285 in upper part and the lowest was US$ 8773.33±1365.79 on middle part. The highest mean loss of land was recorded on lower part about US$1.82±0.60 and the lowest mean loss was 0.038±0.01 on middle part. It was found that the highest mean loss of tree was 10±2.16 on lower part and lowest was 1.66±0.88 on middle part (Table 7).
Loss at Itram Khola
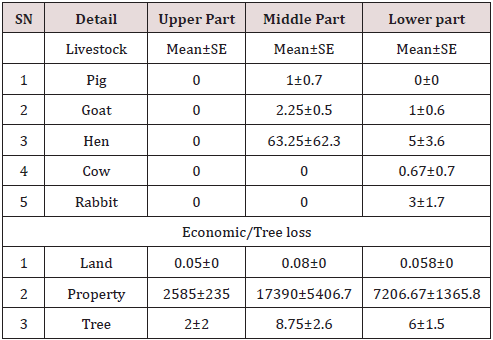
It was recorded that there is no loss of livestock in upper part. The highest mean loss of livestock in middle part was hen about 63.25±62.3 and there was no loss of cow and rabbit. At the lowest part, the highest mean loss was about 3±1.7 of rabbit and there was no loss of pig. It was recorded that the highest mean loss of property was US$ 17390±5406 in middle part and the lowest was US$ 2585±235 in upper part. The highest mean loss of land (ha) was recorded in middle part about 0.088±0 and the lowest mean loss was 0.058±0 in lower part. It was found that the highest mean loss of biomass was 8.75±2.6 on middle part and lowest was 2±2 in upper part (Table 8).
Loss in Girighat Khola
It was recorded that the highest mean loss of livestock was hen about 3.25 ± 0.63 and there is no loss of cow and rabbit. The highest mean property loss was about $12102.5 ± 985.41 and the mean land (ha) loss was about 0.118±0.002. The mean loss of tree was about 8±1.96.
Discussion
Relation among Flood, Rainfall and Temperature
Here, it was found that the flood disaster was directly related to the amount of rainfall pattern. As higher the amount of rainfall, the flood intensity was also high. For the analysis of climate variable i.e. rainfall and temperature, 31years data of temperature and rainfall were used nearby station to the study area (Surkhet) which was collected from Department of Hydrology and Metrology, Nagpokhari Kathmandu, Nepal. The result of that data showed that high rainfall records were reported in July month between 1985to2015 and it was followed by August [18-21]. The highest rainfall was recorded about 799.3 mm in August of year 2014. According to the flood affected area’s locality, it was acknowledged that the most disastrous flood always came when there was heavy rainfall. They told that the most disastrous flood was occurred in 2014 due to the continuous and heavy rainfall. Most of the respondent expressed that there was increase in flood intensity in comparison to the past. Similar study was done by Robin C. van den Honert and John McAneney in 2011.The Fourth Assessment Report (2007) of the Intergovernmental Panel on Climate Change (IPCC) predicts “heavy precipitation events, which are very likely to increase in frequency, will augment flood risk”.
Variation in Plant species diversity
There were 19 plant species found in non-affected area but in case affected area only 11 species were found, which was less in number as compare to non-affected area. Nejad presented a case study regarding the environment impact of heavy flash flood (11, 10 August 2001) of Golestanprovinc. According to him more than 1500ha forests were destroyed due to flood.
Loss of Human Wealth
There was huge amount of loss of human wealth which included land, property, livestock, trees in their own land etc. in KhorkaKhola, ItramKhola and Girighat Khola due to the flood disaster. Many farmers had lost their farming mainly wheat because of flood mostly in lower part of the river. Not only they lost their physical property but also got the mental stress. Many people and livestock were saved by local people and police during the flood disaster. Nearby community forest had provided the timbers and other raw material for making house of affected locality. According to them, they had not properly got any economic support for their livelihood. Mainly, poor and underprivileged group were affected by the flood disaster. The UN (May 2012) says that houses, temples and community buildings were completely swept away in the villages of Kharapani and Sardikhola when the floods struck [22]. The floodwaters also swept into the city of Pokhara, where several people were swept away along with their houses and livestock. Power and water supplies were cut to many areas, and roads were washed away. Further damage was caused to crops and to other infrastructure [23]. Woo et al (1997) carried out studies of Han River of Korea and found out that a total of about 50 fatalities occurred, properties damages of about US $600milion and 90000 houses were inundated.
Conclusion and Recommendations
The rainfall pattern was directly related to flood intensity i.e. higher the amount of rainfall, the higher the flood intensity. Plant species diversity was higher in non-affected area in comparison to affected area at Khorka Khola. Itram Khola and Girighat Khola. Plant species diversity is higher in upper part of river. Regardless of place and events, floods have a negative impact on humans, crops, agricultural inputs, livestock, poultry, fish, other assets such as land and infrastructure thus impacting socio-economic condition of that place. Property loss was higher in Khorka Khola about US$ 219418, highest land loss was about 0.63ha and highest livestock loss was about295 in Itram Khola as comparing to three rivers. Research and extension are the key methods to create the awareness on effect of flood disaster among the underprivileged and deprived communities.
References
- Dahal RK (2012) Rainfall-induced landslides in Nepal.International Journal of Erosion Control Engineering5(1):1-8.
- DPNet Nepal (2014) Report on Field Visit of Sunkoshi /Bhotekosh Landslide Affected Area. [Accessed:January15,2015].
- Forest & Landscape Development and Environment Series 2-2005 and CFC-TIS Document Series No.110., 2005, ISBN 87-7903-210-9, retrieved Nov 22, 2013 horizontal tab character in |series= at position 91. The Map of Potential Vegetation of Nepal - a forestry/agroecological/biodiversity classification system (PDF).
- Fressard M, Thiery Y, Maquaire O (2014) Which data for quantitative landslide susceptibility mapping at operational scale? Case study of the Pays d’Auge plateau hillslopes (Normandy, France). Natural Hazards and Earth System Sciences14: 569-588.
- GoN (2011) Country Profile, hazard profile, disaster profile [webpage on the Inter-net] Government of Nepal. India.
- Günther A, Reichenbach P, Malet J P, Van Den Eeckhaut M, Hervás J, et al.(2013) Tier-based approaches for landslide susceptibility assessment in Europe. Landslides 10: 529-546.
- Guzzetti F, Reichenbach P, Cardinali M, Galli M, Ardizzone F (2005) Probabilistic landslide hazard assessment at the basin scale. Geomorphology 72(1-4): 272-299.
- Image Channel (2013)Mahakali flood sweeps entire settlement in Darchula; One killed, district headquarters at risk 23 workers rescued in Kanchanpur.
- Inform Country Risk Profile(2004) Nepal. Index for Risk Management (INFORM).
- International Federation of Red Cross and Red Crescent Societies (IFRC)(2014)[Information Bulletin, Nepal and India: Landslides and Floods], India.
- Khanal NR, Gurung DR. ICIMOD Rapid Field Investigation: Jure Landslide Dam Site Jure, Sindhupalchowk District, Nepal, India.
- Khanal NR, Shrestha M, Ghimire M (2007) Preparing for Flood Disaster: Mapping and Assessing Hazard in the Ratu Watershed, Nepal. Nepal: International Centre for Integrated Mountain Development (ICIMOD) and New Delhi: United Nations Educational Scientific and Cultural Organization (UNESCO).
- Landslip dam Sunkoshi river (2014) [webpage on the Internet] eKantipur.
- National Strategy for Disaster Risk Management in Nepal (2009)Government of Nepal, Ministry of Home Affairs.
- Natural Calamity (2015) (Relief) Act 2039 BS 1982, Nepal Law Commission.
- O'Connor, Jim E, John E Costa (2004) The World's Largest Floods, Past and Present: Their Causes and Magnitudes. Washington, DC, USA.
- Panagos P, Van Liedekerke M, Jones A, Montanarella L (2012) European Soil Data Centre: Response to European policy support and public data requirements. Land Use Policy 29(2): 329-338.
- Powell W Gabe (2009) Identifying Land Use/Land Cover (LULC) Using National Agriculture Imagery Program (NAIP) Data as a Hydrologic Model Input for Local Flood Plain Management. An Applied Research Project, Texas State University, San Marcos, USA.
- com Mahakali flood displaces 2,500.
- Shannon Doocy, Johns Hopkins Bloomberg School of Public Health, 615 N. Wolfe St, Suite E8132, Baltimore.
- Sky News Australia. 2 January 2015. Retrieved 2 January 2015. Jump up^ "Malaysia counts the cost as floods recede".
- Thompson MT (1964) Historical Floods in New England [Geological Survey Water-Supply Paper 1779-M] United States Government Printing Office, Washington, DC, USA.
- WHO Nepal (2013) World Health Organization (WHO) Flash Floods and Land Slides in Far Western Region, Nepal, India.

Top Editors
-

Mark E Smith
Bio chemistry
University of Texas Medical Branch, USA -

Lawrence A Presley
Department of Criminal Justice
Liberty University, USA -

Thomas W Miller
Department of Psychiatry
University of Kentucky, USA -

Gjumrakch Aliev
Department of Medicine
Gally International Biomedical Research & Consulting LLC, USA -

Christopher Bryant
Department of Urbanisation and Agricultural
Montreal university, USA -

Robert William Frare
Oral & Maxillofacial Pathology
New York University, USA -

Rudolph Modesto Navari
Gastroenterology and Hepatology
University of Alabama, UK -

Andrew Hague
Department of Medicine
Universities of Bradford, UK -

George Gregory Buttigieg
Maltese College of Obstetrics and Gynaecology, Europe -

Chen-Hsiung Yeh
Oncology
Circulogene Theranostics, England -
.png)
Emilio Bucio-Carrillo
Radiation Chemistry
National University of Mexico, USA -
.jpg)
Casey J Grenier
Analytical Chemistry
Wentworth Institute of Technology, USA -
Hany Atalah
Minimally Invasive Surgery
Mercer University school of Medicine, USA -

Abu-Hussein Muhamad
Pediatric Dentistry
University of Athens , Greece

The annual scholar awards from Lupine Publishers honor a selected number Read More...


