Lupine Publishers Group
Lupine Publishers
Menu
ISSN: 2641-6794
Research Article(ISSN: 2641-6794) 
An Assessment of Land-Use and Land-Cover Dynamics Using Normalized Difference Vegetation Index (NDVI) in North West Cameroon Volume 3 - Issue 4
Valentine Asong Tellen*1,2, Yerima Bernard PK2 and Che Vivian Bih3
- 1Department of Development Studies, Program of Environment and Agricultural Development, Pan African Institute for Development West Africa (PAID-WA), Cameroon
- 2Department of Soil Science, Faculty of Agronomy and Agricultural Science, University of Dschang, Cameroon
- 3Remotely Sensing Unit, Department of Geology, Faculty of Sciences, University of Buea, Cameroon
Received: August 13, 2019; Published: August 21, 2019
Corresponding author: Valentine Asong Tellen, Department of Development Studies, Environment and Agricultural Development Program, Pan African Institute for Development West Africa (PAID-WA), Buea, South West Region, Republic of Cameroon
DOI: 10.32474/OAJESS.2019.03.000166
Abstract
Background: Land-use/land-cover dynamics are occurring rapidly in tropical landscapes. This study aims to assess the trends of land-use /land-cover change around the North West Region of Cameroon during a 27-year period. Methods: Three cloud-free Landsat images were initially analyzed through visual interpretation and expert judgment. A Normalized Difference Vegetation Index (NDVI) was then used to measure the vegetation vigor, followed by NDVI differencing, which estimated land-use /land-cover change. Results: The results show that there has been a significant environmental change in the study area. On one hand, the trends of land-use /land-cover (LULC) during the period from 1988-2001 showed positive patterns for forest land (24.1 Km2), built-up areas, farmland including bare ground (302.94 Km2) and water body (13.25 Km2) and negative patterns for secondary, open or degraded forest (-230.67 Km2), Savannah and pasture land (-279.92 Km2). On the other hand, LULC trends for the period 2001-2015 indicate negative patterns of forest cover (-80.093 Km2), Savannah and pasture land (-70.66 Km2), farmland and bare ground (-534.601 Km2) and water body (-14.491 Km2) and positive patterns of secondary and open forest lands (727.469 Km2). In general, NDVI differencing show net negative patterns of forest cover (-55.88 Km2), savannah, pastureland (-350.58 Km2), farmland, bare ground (-231.65 Km2) and water body (-0.83 Km2) and a net positive pattern for secondary and degraded forest (496.80 Km2) during the 27 year period. Natural as well as anthropogenic factors occurring in different forms, accounted for the observed trend in landcover change. Conclusion: Results revealed that there has been a significant land-use/land-cover change in the study area during the last three decades. NDVI multi-temporal analysis showed to be indispensable for detecting and monitoring LULC changes in the study area. It can be concluded that ongoing unsustainable land-use practices will cause loss and harm to natural forest vegetation systems. Thus, there is the need for a national and local scientific and policy response to reverse land misuse to permit the North West Region of Cameroon to substantively contribute to the improvement of the livelihood of the population in the region.
Keywords:Land-Use Change; Normalized Difference Vegetation Index; Deforestation; Reforestation
Abbreviations: ETM+: Enhanced Thematic Mapper Plus; FAO: Food And Agriculture Organization of the United Nations; FOECONS: the Forestry and Environmental Conservation Society; FAOSTAT: FAO Statistical Databases; LULC: Land-use land-cover; NDVI: Normalized Difference Vegetation Index; NIR: the spectral reflectance in the Near Infrared band; NWR: North West Region; OLI: Operational Land Imager; RED: the Red Band; TM: Thematic Mapper; USGS: United States Geological Survey
Introduction
Natural resources remain crucial to rural people’s livelihoods in sub-Saharan Africa [1]. Nonetheless, natural (rainfall and temperature) as well as anthropogenic (farming, grazing, burning) forces can exert pressure on these resources, thereby influencing spatial and temporal scale changes on a landscape. Land-use and land-cover (LULC) change are indicators for resource dynamics within a landscape. The dynamics of LULC associated with anthropogenic activities are occurring rapidly in tropical landscapes. Thus, to enforce sustainable use and management of these resources, the international community recommends consistent monitoring of changes in tropical resources, reporting on factors influencing these changes, for consideration of novel scientific and policy interventions (goal #15 0f the 2030 Agenda for Sustainable Development). The importance of monitoring is also driven by the fact that tropical forest represents a significant carbon sink in the world today. To obtain, update, monitor and better understand the dynamics of ecological processes and human impacts related to changes in LULC, remote sensing data and tools are often used as an essential data source for analysis, permitting the generation of precise information in various spatial and temporal scales [2]. Bonham [3] stated that the creation of vegetation indexes, calculated from the combination of spectral bands is an excellent remote sensing technique. More so, Normalized Difference Vegetation Index (NDVI) is one of the most widely used indexes which conveys spectral information of the red and near infrared bands of the visible spectrum and generates a variable that predicts quantity, quality, and development of vegetation [4]. To calculate this index, one can rely on existing decade’s long data from satellite sensor, which highlights the potential of the Landsat time series [5- 7]. The LANDSAT series provides free access to an extensive gallery of relevant temporal and spatial resolution images, widely used and validated in scientific research in remote sensing. In this regard, the objective of this study is to assess the trends of land-cover change around the North West Region (NWR) of Cameroon during the period from 1988– 2015 and to analyze the underlying causal factors. The results from this study will provide an understanding of the local environmental dynamics since many global environmental problems can, in fact, be mitigated by an aggregation of local responses. The Machakos region in Kenya is a good example where a local response resulted in the reversal of land misuse permitting the territory to continue to support far more people than was previously predicted [8].
Methodology
Description of the Study Area
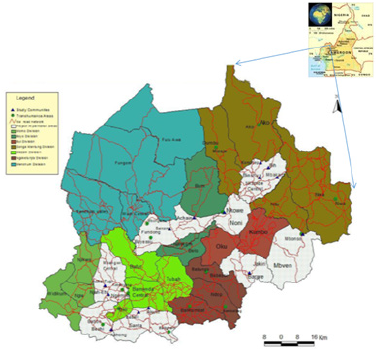
The North West Region (Figure 1) lies between latitudes 5˚45” and 9˚9” N and longitudes 9˚13” and 11˚13” E. It covers an area of about 17,400 km² and is abutted in the North and West by the Republic of Nigeria, in the South by the South West and West Regions and in the East by the Adamawa Region [9]. Administratively, NWR has seven Divisions (Boyo, Bui, Donga Mantung, Menchum, Mezam, Momo, and Ngoketunjia) with capitals including Fundong, Kumbo, Nkambe, Wum, Bamenda, Mbengwi, and Ndop, respectively. The headquarters of the NWR is Bamenda, and the topography of the Region varies considerably from depressions lower than 400 m above sea level to high mountains, 3000 m above sea level. The topography can be categorized into three main zones: the lower altitude (<900 m); the mid-altitude (900-1500 m) and the high altitude (˃1500 m) [9]. The geomorphology consists of high lava plateaus with steep escarpment o basement rock and more or less dissected planation surfaces, steep mountains, and hills. Geologically, the North West Region is characterized by a wide variety of crystalline rocks (both metamorphic (gneisses, migmatites, amphibolites) and igneous rock mainly granitic rock suite) which form the basement overlain by Tertiary volcanic rocks (basanite, basalts, phonolite, trachyte, and rhyolite) intercalated in some areas by ignimbrites. These rocks have experienced various degrees of weathering and either lay exposed on the surface, along with the escarpment or are covered by clayey, silty, sandy or gravelly soils of variable thickness. The soils also vary over short distances in such characteristics as bulk density, compactness, effective depth, gravel content, water infiltration rates and texture. Besides, significant differences in soil fertility and chemical properties exist and are related to parent material and stage of soil development [10]. The vegetation in the area is dominated by shrubs that shed off their leaves in the dry season to withstand bushfires and dry conditions. These shrubs have thick barks for the same purpose.
A considerable part of the natural forest vegetation has been converted into secondary forest systems or replaced by wooded grasslands and agricultural land due to increasing population pressure [11]. This process is conspicuous in areas with low relief. The climate is marked by two seasons (a rainy season and a dry season). Mean annual atmospheric temperatures range from 19– 22°C while rainfall ranges from 1500 - 2800 mm/year (Figure 1) [12].
Data collection
Three cloud-free Landsat images (One Landsat Thematic Mapper (TM), acquired on February 2nd, 1988; one Landsat ETM+ (Enhanced Thematic Mapper Plus), received on February 5th, 2001; and one Landsat 8 Operational Land Imager (OLI) data set, acquired on January 19th, 2015) with path and row number 156 and 56, respectively were obtained from the U.S. Geological Survey (USGS) website (http://glovis.usgs.gov/). The data sets included high resolution visible, infrared thermal and a panchromatic image, which represents a collection of imagery suitable for land-use analysis. The Landsat TM images consist of seven spectral bands with a spatial resolution of 30 meters for all bands (the visible, near and shortwave infrared) and a spatial resolution of 60 meters for the thermal band (band 6). Similarly, the Landsat ETM+ images consist of nine spectral bands with a spatial resolution of 30 meters for the visible, near and shortwave infrared (Bands 1 to 5, and 7), 60 meters for the two thermal bands (61-62) and 15 meters for the Panchromatic band. Landsat 8 OLI comprises of 11 spectral bands with a spatial resolution of 30 meters for Bands 1 to 7 and 9.
The resolution for the panchromatic band (Band 8) is 15 meters while that for the thermal band is 30 meters. The wavelengths for the different bands in Landsat 7 images differ entirely from that of Landsat 8 images (Table 1) [13,14]. Therefore, the combinations used to create red, green and blue (RGB) composites in Landsat 8 differ from that of Landsat 7. In this study, the False Color Composite used for Landsat 7 was 7, 4, 3, while that used for Landsat 8 was 7, 5, 4. The satellite records surface reflectance from a height of 705 km. Before processing, the images were corrected to remove atmospheric effects using the darkest pixel subtraction method, including masking of cloud and its shadows [15].
Table 1: Band designations for the Landsat 8 and Landsat 7 satellites images. Source: USGS website [13,14]
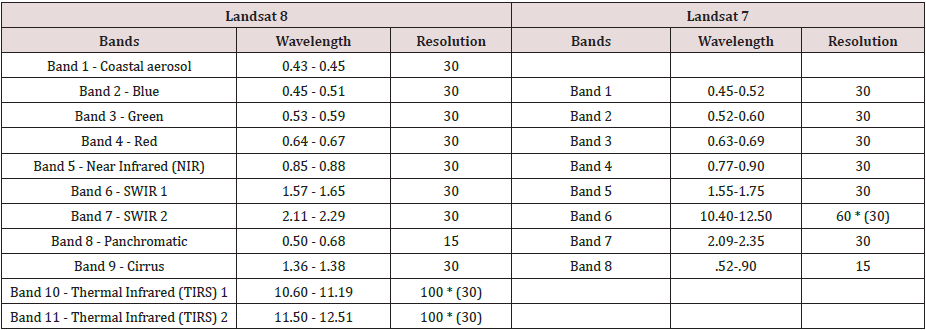
(http://Landsat.usgs.gov/band_designations_Landsat_satellites.php)
Analysis of GIS and Remote Sensing Data
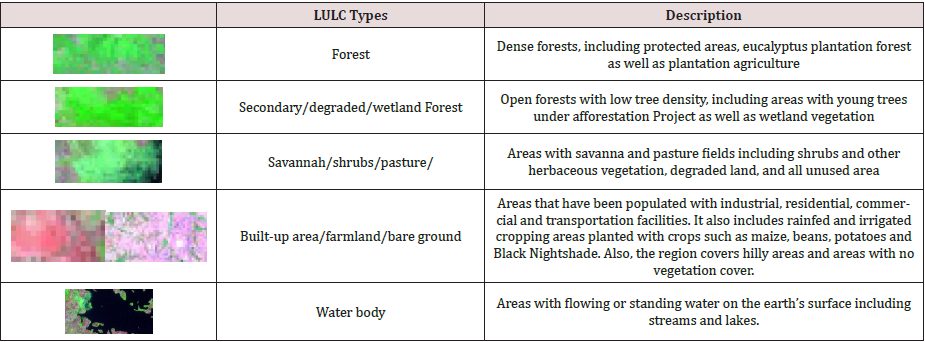
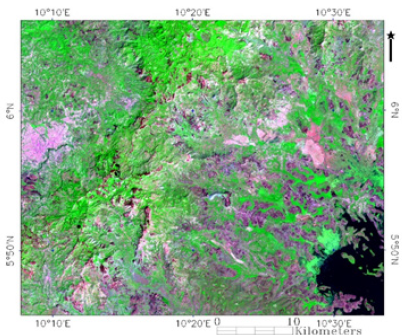
Figures 2.1 and 2.2 denote the 1988 Landsat-7 TM and the 2001 Landsat-7 ETM+ images respectively, with bands 5, 4 and 3 assigned to the red, green and blue channels, while Figure 2.3 represents the 2015 Landsat-8 OLI image with bands 7, 5 and 4 allocated to the red, green and blue channels. Visual interpretation of all the three resulting Landsat images was performed to identify the main LULC within the study area. Also, expert judgment using field information, helped in interpreting the image classes. A description of five LULC classes/groups identified from the study area is presented in Table 2.
Figure 2.1: The 1988 image showing study area, from Landsat-7 TM, with bands 5, 4 and 3 assigned to the red, green and blue channels.
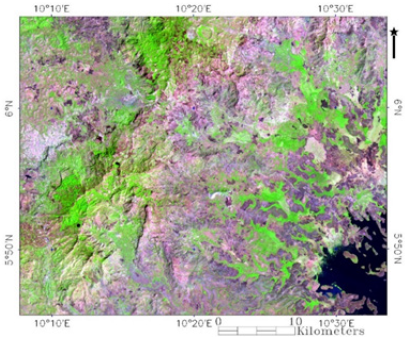
Figure 2.2: The 1988 image showing study area, from Landsat-7 TM, with bands 5, 4 and 3 assigned to the red, green and blue channels.
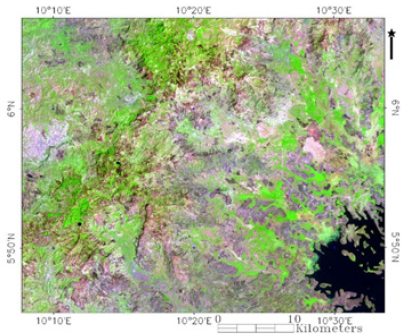
Figure 2.3: The 2015 study area from Landsat-8 OLI with bands 7, 5 and 4 assigned to the red, green and blue channels.
Normalized Difference Vegetation Index (NDVI)
NDVIs were calculated for all the images. NDVI syndicates a multivariate data set of observations to a single index that perfectly correlates to the quantity of chlorophyll existing in the leaves of vegetation, hence an indicator of vegetation amount [16]. Its data layer is typically generated from the near-infrared (NIR) and visible red bands of the Landsat ETM+ and OLI images. Normally, healthy or dense vegetation absorbs most of the incoming visible red light and reflects a significant portion (about 25%) of the NIR light. Unhealthy or sparse vegetation reflects more visible red light and less NIR light. In this study, the following algorithm was used to apply NDVI:
Where NIR represents the spectral reflectance in the near infrared band while RED represents the red band.
The NDVI real values, by definition, range between -1 and +1 (Jensen, 2000), where high positive values indicate high vegetation greenness (signifying different types of dense vegetation classes) and negative and near zero values indicate non-vegetation classes such as water, built-up areas, and bare ground. Vegetation indices have a long history of use in remote sensing for monitoring temporal changes associated with vegetation [17].
NDVI - Differencing
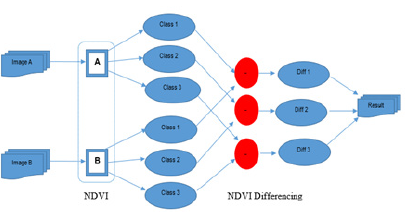
The image differencing technique has been used to compare vegetation index information for two different dates [16], as well as for multiple dates of imagery [17]. In this study, NDVI difference was used to detect land-cover change in the North West Region of Cameroon for three different dates. Vegetation index difference (VID) was based on subtracting the NDVI of two different time periods of the same scene as follows:
Where VID is the Vegetation index difference, NDVI (t1) is the NDVI of initial image scene and NDVI (t2) is the NDVI of the final image scene. The NDVI differencing approach is based on rectification of independent NDVI images (A and B), followed by a comparison of the corresponding class themes to identify areas where change has occurred (Figure 3).
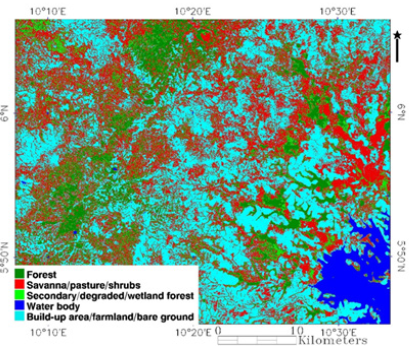
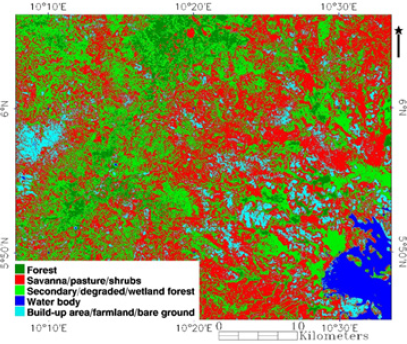
The classification accomplished from NDVI transformation using ENVI software depended on remotely sensed satellite data as primary sources of information. In Figures 4.1-4.3, the classified images of NDVI for the years 1988, 2001 and 2015, respectively are presented. Visually, Figure 4.3 shows that there is relatively more forest vegetation, less bare ground/farmland and less savanna/ pastureland in the classified image for the year 2015 compared to those of the other years. On the other hand, there is relatively barer ground/farmland, and less forest vegetation in the classified image for the year 2001 (Figure 4.2). However, it was difficult to highlight specific temporal differences based on observation of these images alone.
Trends of Land-cover Change in the Study Area during the Period from 1988 - 2015
The vegetated and non-vegetated LULC classes obtained were based on data distributional assumptions which were crossreferenced with aerial photographs. The results showed a variation of threshold (standard deviation) values between LULC classes from the NDVI for each of the years 1988, 2001 and 2015, respectively, as shown in Table 3. Table 4 shows the surface area cover (Km2) and the corresponding percentages of the different LULC classes in the study area. The result shows that in 1988, savanna/barren land had the highest proportion (39.79%), covering about 930.89 Km2 of the study area, while forest and water occupied only relatively smaller surface areas (9.88 % and 3.32 %, respectively). On the other hand, in 2001, built-up areas, farmlands and bare ground had the highest proportion (42.03 %), covering about 772.99 Km2 of the study area, while forest and water occupied relatively smaller surface areas (9.75 % and 4.01 %, respectively). Contrarily, in 2015, secondary and open or degraded forest had the highest proportion (42.00 %), covering about 874.98 Km2 of the study area, while forest and water still occupied only relatively smaller surface areas (9.39 % and 3.26 %, respectively).
Table 4: Surface area (Km2) and their percentages of the different LULC classes of the NDVI study area.

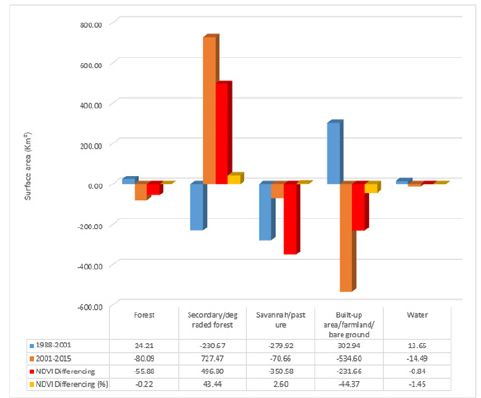
Figure 5 is a plot diagram showing the trends of LULC (distributions of NDVI) in the study area for two periods (1988- 2001 and 2001-2015). The trends of LULC in the study area during the period from 1988-2001 showed positive patterns for forest land (24.21 Km2), built-up areas, farmlands including bare ground (302.94 Km2) and water body (13.25 Km2) and negative patterns for secondary, open or degraded forest (-230.67 Km2), savanna and pastureland (-279.92 Km2). However, the results also indicate that the trend in land-cover change in the study area is not a simple straightforward process because one cover class changes to other classes and finally change to the original land-use again (e.g., secondary forest changing to savanna or farmland and later becoming secondary forest again). On the other hand, the results also showed that the distributions of NDVI for the period 2001- 2015 indicated negative patterns of forest (-80.093 Km2), savanna and pastureland (-70.66 Km2), farmland and bare ground (-534.601 Km2) and water body (-14.491 Km2) and positive patterns of secondary and open forest lands (727.469 Km2) (Figure 5). However, it is worthwhile noting here that based on visual analysis, the reduction in farmland and bare ground did not preclude the expansion of built-up areas. The negative patterns of forest in this study corroborates the findings of Cheek et al. [18] and Harvey et al. [19] who estimated that 96.5% of the original forest cover of the Bamenda Highlands above 1500 m altitude has been lost.
The results for NDVI differencing show net negative patterns of forest cover (-55.88 Km2), savanna or pasture land (-350.58 Km2), farmland or bare ground (-231.65 Km2) and water body (-0.83 Km2) and a net positive pattern for secondary and degraded forest class (496.80 Km2) (Figure 5). This indicates that the underlying factors driving land-use change in the study area from 1988 to 2015 have resulted to a net forest cover loss rate of -0.22% (Figure 5). It can be suggested that, although LULC changed naturally, anthropogenic factors including: uncontrolled fire, extraction of wood, opening up of new agricultural lands, grazing, community forest management and extension of settlements, occurring in different forms, have strongly influenced the trends in LULC change in the study area. According to Vision 2035, Cameroon intends to increase yields and the amount of cultivated areas by the order of 30% compared with the 2005 level to ensure food security and enhance growth and employment in this sector. This objective is expected to be achieved particularly through:
a) promotion of medium and large farms by facilitating access to the land;
b) provision of incentives to consolidate and synergize family businesses in the form of cooperatives or groups of common interest (GICs);
c) providing support to attract young people to rural areas;
d) implement programs geared at development and regeneration of forests, sustainable exploitation of forest and wildlife resources; and
e) development of related subsectors. The 30% increase of the cultivated area will certainly have an impact on the forest cover.
FAOSTAT [20] estimated the agricultural areas in 2005 and in 2020 and evaluated the additional agricultural area that has encroached on the forest and the overall forest cover loss and the result is presented in Table 5. These results corroborate the assertion that Cameroon will probably increase its agricultural area of more than 2.7 million hectares, from 2005 to 2020 and this increase cannot occur without impacts on forest cover [21]. Evidence, though anecdotal reveals that an increase in the demand for food, cattle beef, fuel wood, and forest products strongly correlate with population increase. This, in turn, leads to an increase in cattle stock, logging, and extraction of non-timber forest products and the opening up of new farmland land to meet the increasing demands. These land-use activities are more or less detrimental to forests and soil resource as they result to forest loss and soil erosion, respectively. Thus, the assertion that poor land utilization practices, especially in subsistence farming and nomadic pastoral economies in the majority of the African countries have accelerated the loss of natural vegetation and exacerbated the problem of climate change [22], is not frivolous.
Table 5: Agricultural area projected by Cameroon in 2020.Sources: FAOSTAT (2016), Republic of Cameroon (2010).

Conclusion
This study validates the application of Normalized Differential Vegetation Indices to measure the vegetative potency and assess LULC change in the N.W region. The results revealed that there has been a significant LULC change in the study area during the last three decades. On the one hand, the trends of LULC during the period from 1988-2001 showed positive patterns for forest land, built-up areas, farmland including bare ground and water body, and negative patterns for the secondary, open or degraded forest, savannah, and pasture land. On the other hand, the trends of LULC for the period 2001-2015 indicated negative patterns of forest cover, Savannah and pastureland, farmland and bare ground and water body and positive patterns of secondary and open forest lands. In general, NDVI differencing show net negative patterns of forest cover, savannah, pastureland, farmland, bare ground and water body and a net positive pattern for secondary and degraded forest during the 27-year period. NDVI multi-temporal analysis has proven to be indispensable for detecting and monitoring LULC changes in the study area. Therefore, it can be concluded that ongoing unsustainable land-use practices will cause loss and harm to natural forest vegetation systems. Thus, there is the need for a national and local scientific and policy response to reverse land misuse to permit the North West Region of Cameroon to substantively contribute to the improvement of the livelihood of the population in the region.
Authors’ contributions
VAT literature review, field survey, data collection and analysis and manuscript preparation. YBPK overall management of the field survey and reviewing the manuscript. CVB technical support and reviewing the manuscript. All authors read and approved the final manuscript.
Acknowledgement
Authors are thankful to Dr. Anchang Julius for his technical support obtaining the satellite data and Madam Anchang Juliana for her directives and moral support. Authors are also thankful to the anonymous reviewers for their valuable suggestions to improve the manuscript.
Availability of Data and Materials
Some data was obtained from the USGS website while other data was generated by author’s own attempt by field sampling and statistical analysis.
References
- Roe D, Nelson F and Sandbrook C (Eds.) (2009) Community management of natural resources in Africa: Impacts, experiences and future directions. Natural Resource.
- Nagendra H, Lucas R, Honrado JP, Jongman RHG, Tarantino C, et al. (2013) Remote sensing for conservation monitoring: Assessing protected areas, habitat extent, habitat condition, species diversity, and threats. Ecological Indicators 33: 45-59.
- Bonham CD (2013) Measurements for terrestrial vegetation (2nd ). John Wiley & Sons Ltd (UK).
- Pettorelli N, Vik JO, Mysterud A, Gaillard JM, Tucker CJ, et al. (2005) Using the satellite derived NDVI to assess ecological responses to environmental change. Trends in Ecology and Evolution 20(9): 503-510.
- Ding Y, Zhao K, Zheng X and Jiang T (2014) Temporal dynamics of spatial heterogeneity over cropland quantified by time-series NDVI, near infrared and red reflectance of Landsat 8 OLI imagery. International Journal of Applied Earth Observation and Geoinformation 30: 139-145.
- Devries B, Verbesselt J, Kooistra L, Herold M (2015) Remote sensing of environment robust monitoring of smallscale forest disturbances in a tropical montane forest using Landsat time series. Remote Sensing of Environment 161: 107-121.
- Zheng B, Myint SW, Thenkabail PS, Aggarwal RM (2015) A support vector machine to identify irrigated crop types using time-series Landsat NDVI data. International Journal of Applied Earth Observation and Geoinformation 34: 103-112.
- Malakoff D (2011) Are more people necessarily a problem? Science 333: 544-546.
- Manu IN, Andu WN, Tarla DN and Agharih WN (2014) Causes of cattle theft in the North West Region of Cameroon. Scholarly Journal of Agricultural Science 4(4): 181-187.
- Yerima BPK, Wilding LP, Hossner LR (2003) Review of environmental factors and evaluation of soil properties of North Cameroon, Vertisols and Alfisols as a guide to forest regeneration. Science Aaronic and Development 3(1): 26-36.
- Yerima BPK, Enang RK, Makem CA, Guehjung N, Ayuk GM (2017) Influence of Different Geomorphic Surfaces and Profile Modification on the Growth of Maesopsis eminni (Engl) at the Yongka Western Highlands Research Garden Park Nkwen-Bamenda, North West Cameroon. American Journal of Plant Sciences 8: 69-84.
- Tellen VA, Juliana AA, Suh M (2015) Conflicts over land and pasture in North West Cameroon: Listening to the voices of farmers and grazers. A report of qualitative research on the farmer grazer conflicts in NW Cameroon. It is part of the evaluation over a five year period of the Big Lottery Funded Project ‘In Search of Common Ground’. Managed in Cameroon by the Mbororo Cultural and Development Association (MBOSCUDA). The qualitative research was conducted by the Pan African Institute for Development-West Afica (PAID-WA), p: 26.
- US Geological Survey website.
- http://www.paidafrica.org/paidwa/images/data/general_brochure.pdf
- Ahmad A, Quegan S (2012) Cloud masking for remotely sensed data using spectral and principal components analysis. Engineering, Technology and Applied Science Research (ETASR) 2(3): 221-225.
- Yacouba D, Guangdao H, Xingping W (2010) Assessment of land use cover changes using NDVI and DEM in Puer and Simao Counties, Yunnan Province, China. Unpublished document 2(9): 1-10.
- Ahmed MA, Ahmad WA (2013) Using Normalized Difference Vegetation Index (Ndvi) to assessment the changes of vegetations cover in surrounding area of Himreen Lake. Iraqi Journal of Science 54(4): 895-901.
- Check M, Onana JM and Pollard BJ (2000) The plants of Mount Oku and the Ijim Ridge, Cameroon, a conservation checklist. RBG Kew UK, pp. 211.
- Harvey Y, Pollard BJ, Darbyshire I, Onana JM, Cheek M (2004) The plants of Bali Ngemba Forest Reserve, Cameroon. Royal Botanic Gardens Kew UK, pp. 154.
- (2016) FAOSTAT.
- Tchatchou B, Sonwa DJ, Ifo S, Tiani AM (2015) Deforestation and forest degradation in the Congo Basin: State of knowledge, current causes and perspectives. Occasional Paper Indonesia.
- Bamba A (2015) Land use change, vegetation dynamics and rainfall spatio-temporal variability over West Africa. PhD thesis submitted to the school of postgraduate studies, the Federal University of Technology, Akure (FUTA), Nigeria, in partnership with the West African Science Service Centre on Climate Change and Adapted Land use (WASCAL) In Partial Fulfillment Of The Requirements For The Award Of Doctor Of Philosophy Degree In Meteorology And Climate Science.

Top Editors
-

Mark E Smith
Bio chemistry
University of Texas Medical Branch, USA -

Lawrence A Presley
Department of Criminal Justice
Liberty University, USA -

Thomas W Miller
Department of Psychiatry
University of Kentucky, USA -

Gjumrakch Aliev
Department of Medicine
Gally International Biomedical Research & Consulting LLC, USA -

Christopher Bryant
Department of Urbanisation and Agricultural
Montreal university, USA -

Robert William Frare
Oral & Maxillofacial Pathology
New York University, USA -

Rudolph Modesto Navari
Gastroenterology and Hepatology
University of Alabama, UK -

Andrew Hague
Department of Medicine
Universities of Bradford, UK -

George Gregory Buttigieg
Maltese College of Obstetrics and Gynaecology, Europe -

Chen-Hsiung Yeh
Oncology
Circulogene Theranostics, England -
.png)
Emilio Bucio-Carrillo
Radiation Chemistry
National University of Mexico, USA -
.jpg)
Casey J Grenier
Analytical Chemistry
Wentworth Institute of Technology, USA -
Hany Atalah
Minimally Invasive Surgery
Mercer University school of Medicine, USA -

Abu-Hussein Muhamad
Pediatric Dentistry
University of Athens , Greece

The annual scholar awards from Lupine Publishers honor a selected number Read More...


