Lupine Publishers Group
Lupine Publishers
Menu
ISSN: 2637-4706
Review Article(ISSN: 2637-4706) 
FTIR Analysis & Dielectric Constant for Some Iron Bismuth Borate Glasses Volume 2 - Issue 3
Hossam Mohammed Gomaa1* and Ahmed Hatim Hamdy EL-Dosokey2,3
- 1Optical Branch, High Institute of Optics Technology, Egypt
- 2Physics Department, Faculty of Science, EL-Fayoum University, Egypt
- 3Physic Department, Faculty of science, Sirte University, Libya
Received: September 06, 2018; Published: September 10, 2018
Corresponding author: Hossam Mohammed Gomaa, Optical Branch, High Institute of Optics Technology, Cairo, Egypt
DOI: 10.32474/DDIPIJ.2018.02.000139
Abstract
Some of iron bismuth borate oxide glasses were prepared to form a series of glass samples contain a constant and a fixed amount of Fe2O3 whereas the B2O3 was replaced by Bi2O3, according to the formula 20 mol % Fe2O3–(15 + x) mol % Bi2O3–(65–x) mol % B2O3, where 0 ≤ x ≤ 20. The X-ray diffraction and FTIR Spectra showed formation of homogenous short-range order structures. The values of the refractive index were estimated using both FTIR date room temperature dialectic measurements are in a good agreement with each other. It is clear that the ε increased with the increasing of Bi2O3 content.
Keywords: Dielectric; FTIR; Amorphous Materials; Static dielectric; Oxide Glasses; refractive Index
Introduction
Borate glasses contain transition metal ions are of high importance in science and technology, as solid electrolytes and electric sensors [1]. Oxide glasses, especially bismuth borate glasses, are considered as stable active ion hosts for practical applications such as optical and sensor devices, because of their high refractive index [2]. The intensive studies of rare-earth doped glasses lead to good understanding their optical properties, which in turn help to choose the host material and the emitters for lasers [3]. Glasses containing transition metal ions such as Fe, Co, V, etc. consider as semiconductors [4,5]. Electronic transport is only observed in these materials if the transition metal ion is present in two distinct sites [4]. The transport properties of oxide glasses have been of interest for a long time because of their potential application in technology. The ability of Born to exist in both three and four coordinated environments and high strength of the covalent B-O bounds, imparts borates, the ability to form stable glasses [6]. This work aims to study the effect of introduce Bi2O2 on both the refractive index and Static dielectric constant for some iron bismuth borate glasses.
Experimental Measurements
The chemical formula 20 mol% Fe2O3– (15 + x) mol% Bi2O3– (65–x) mol% B2O3, 0 ≤ x ≤ 20, have been used to prepared some of iron bismuth borate glasses. All batches were melted using an electric muffle furnace, in crucibles of porcelain, for about 120 mints. Then, finally poured in air at room temperature, two copper plates were used to get high fast cooling process. Electric capacities for all samples were carried out by a computer-controlled Stanford LCR bridge model SR 720 at four fixed frequencies [0.1,1,10 and 100 kHz.] at room temperature. Philips X-ray diffract-meter, model (P.W.1390b - λ= 1.5406 Å) was used for X-ray diffraction measurements at angles between 2θ = 10° and 80° in steps of 0.2 degree with an integration time 0.4 s per step.
Discussion of Results and Calculations
X-Ray Diffraction
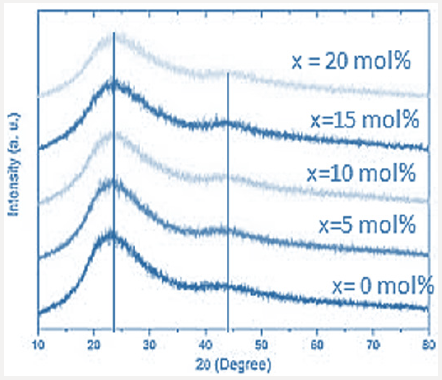
X-ray diffraction XRD is very useful tool for identification the order-disorder transformation, therefore it was used to check the internal structures of the studied samples. XRD patterns for the all studied samples were exhibited in Figure 1, where all sample showed same behavior. Checking Figure 1 carefully the shape shows two broad peaks have different intensities. 1st peak was positioned approximately at 2θ = 27o, this peak is of highest intensity. While the 2nd peak which of lowest intensity was positioned at 2θ = 44o. By refer to the XRD database it can state that these peaks may due to XRD by both Bi and Fe cations. Such broad peaks may refer to some small crystallites embedded in an amorphous matrix. Generally, the absence of any sharp peak means the short-range order nature of the internal structure of the studied samples.
FTIR Spectra Analysis
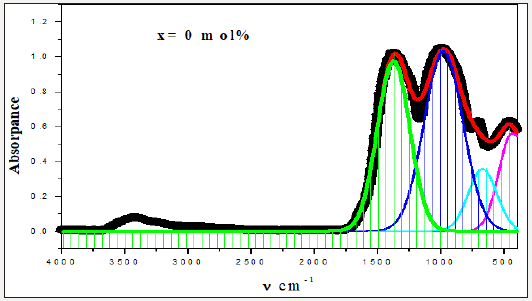
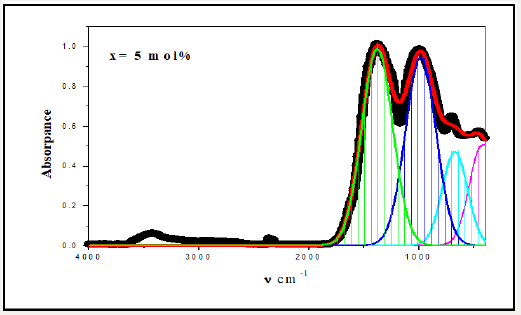
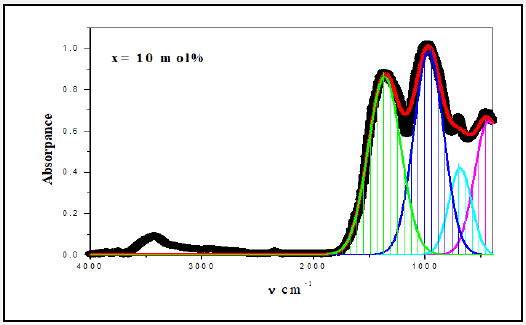
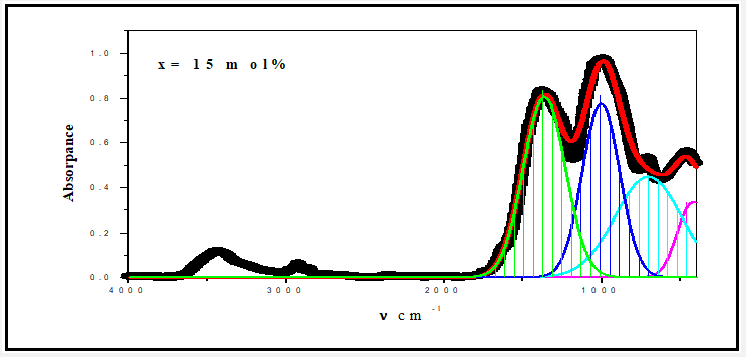
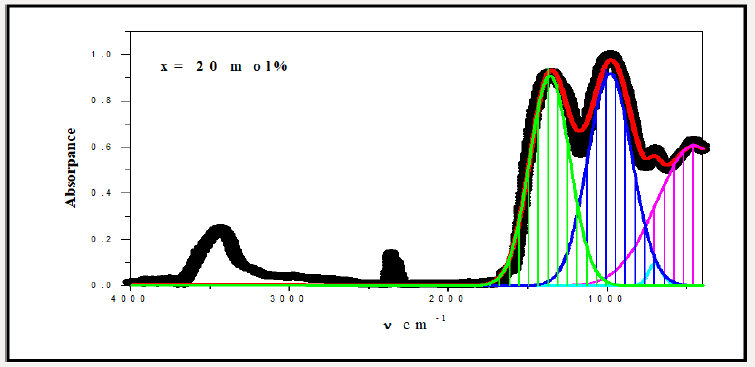
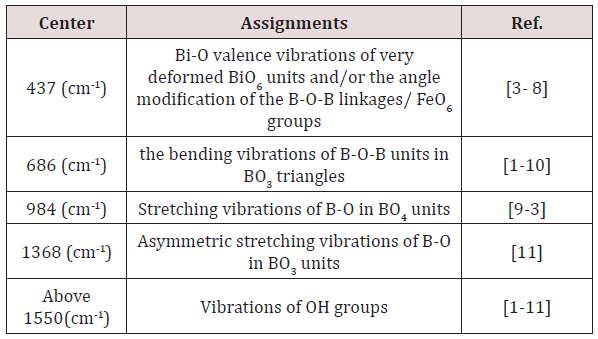
For a solid material, FTIR has an ability to characterize the order of the internal structure and building groups in addition to the chemical bonds. So, FTIR absorption spectra were recorded for all studied samples in range from 4000cm-1 to 400cm-1, as seen in Figures 2-6. Logically, it can observe that each spectrum contains multi-broad bands, each band may compose of more than one peak. Where each individual peak refers to a fixed type of vibration, which consequently characterize a certain bond or group unit. Such shapes characterize the solids own short range order structure, this observation is in an agreement with the XRD data. For more analytical study, each broadband was de-convoluted to some small peaks with different centers, then recorded in Table 1 where the band around 437cm-1 may attribute to Bi-O valence vibrations of very deformed BiO6 units [3-7] overlapping with FeO6 groups [8]. The relative area of this band increased as Bi2O3 was increased, the thing which may that Bi3+ have octahedral coordination and act as a glass network modifier and occupied only interstitial positions. The center of this band has no observable change from sample to another, like observation may refer to the uniqueness of the structure network in all studied samples. Also, it may refer to an increase of the electric polarization, and hence increasing of the static dielectric constant. Band around 3500cm-1 has a relative intensity increased as Bi2O3 was increased, like behavior may due to the ability of Bi cations to absorb water. The relative intensity of the band about 984cm-1 refers to an increase of BO4 by increasing Bi2O3 content, while the bands about 686 and 1368cm-1 refer to decease of BO3, like behavior may due to increase the fraction of the nonbridging oxygen atoms.

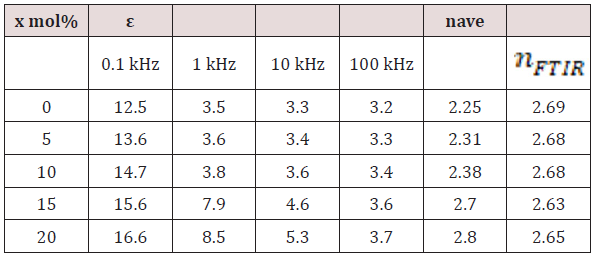
As an attempt to get all possible information from IR spectrum, Sellmeier equation [12], was resolved to obtain the average refractive index nFTIR for each sample, as seen in Table 2, Where λ is the wavelength corresponding to one wavenumber (center of each observable peak).
Dielectric Constant
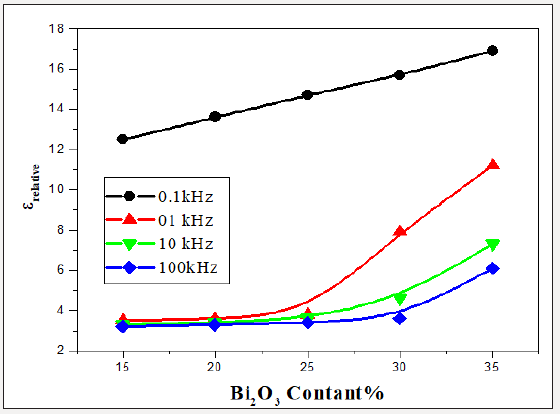
The dielectric constant (relative permittivity), ε of bulk solid may be known as the ratio of the capacitance of a certain capacitor contains this solid as a dielectric medium to the capacitance of the same capacitor with a vacuum as the dielectric medium. For the present work, for each sample, to determine the value of its dielectric constant at room temperature (RT), a piece of glass of uniform shape (has a fixed dimensions) was inserted as dielectric medium in the two parallel plates capacitor of LCR bridge. Figure 7 shows the dielectric constant ε versus frequency at different Bi2O3 ratios. It is clear that the ε increased with the increasing of Bi2O3 content, this may due to the increasing of the polarizing agents (Bi3+ ions) in addition to the non-bridging oxygen atoms. Also, it is clear that ε decreases by increasing the frequency, such behavior may due to the fact that as the frequency increases the orientational polarization decreases because the dipoles cannot follow the variation of frequency, so it takes more relaxation time than that of electronic and ionic polarization [13-15]. The following relation was used to obtain the values of the refractive index n as a function of the static dialectic constant, at only four fixed frequencies 0.1, 1, 10 and 100 kHz. 4.

Conclusion
In this study, the samples have prepared according to the chemical formula 20 mol% Fe2O3– (15 + x) mol% Bi2O3– (65–x) mol% B2O3, 0 ≤ x ≤ 20. The X-ray diffraction and FTIR Spectra showed formation of homogenous short-range order structures. The calculated average refractive indices of samples estimated from IR spectra are in a good agreement with those calculated from the dielectric constant measurements.
References
- KHS Shaaban, SM Abo-Naf, MEM Hassouna Physical and Structural Properties of Lithium Borate Glasses Containing MoO3. J of Silicon, p.1-8.
- Ramesh Boda, MD Shareefuddin, MN Chary, R Sayanna (2016) FTIR and Optical Properties of Europium Doped Lithium Zinc Bismuth Borate Glasses. J of Materials Today: Proceedings 3(6): 1914-1922.
- Yasser B Saddeek, K Alyn, Gh Abbady, N Afify, KHS Shaaban, et al. (2016) Optical and structural evaluation of bismuth alumina-borate glasses doped with different amounts of (Y2O3). J of Non-Crystalline Solids 454: 13-18.
- GS Linsley, AE Owen, FM Hayatee (1970) Electronic conduction in vanadium phosphate glasses. J Non-Cryst Solids 4: 208-219.
- AW Dozier, LK Wilson, EJ Friebele, DL Kinser (1972) J Am Ceram Soc 55: 37.
- BS Rawal, Rk Maccrone (1978) J Non-Cryst Solids 28: 347.
- P Venkateswara Raoa, G Naga Raju, P Syam Prasad, C Laxmikanth, N Veeraiah (2016) Transport and spectroscopic properties of nickel ions in ZnO-B2O3-P2O5 glass system. J of Optik 127(5): 2920-2923.
- I Kashif, H Farouk, AM Sanad, SA Aly, AM Assem (1992) Structural studies of some V2O5-P2O5-B2O3-Fe2O3 glass systems. J Material Science 27(1): 122-126.
- S Cetinkaya Colak (2017) Role of titanium ions on the optical and thermal properties of zinc borate glass doped with TiO2. J of Glass Science and Technology Part B 58(2): 41-48.
- I Kashif, A Ratep (2015) Role of copper metal or oxide on physical properties of lithium borate glass. J of Molecular Structure 1102: 1-5.
- AA El-Maaref, KHS Shaaban, M Abdelawwad, Yasser B Saddeek (2017) Optical characterizations and Judd-Ofelt analysis of Dy3+ doped borosilicate glasses. J of Optical Materials 72: 169-176.
- Thomas ME, Tropf WJ (1998) Infrared Refractive Index and Thermooptic Coefficient Measurement at APL. Johns Hopkins APL Tech Dig 19(3): 293-297.
- Cornelius T Moynihan (1998) Description and analysis of electrical relaxation data for ionically conducting glasses and melts. J Solid State Ionics 105(1-4): 175-183.
- SS Fouad, AE Bekheet, AM Farid (2002) Derivation of a relation between the conduction mechanism and chemical bonding of amorphous Ge15Se85−xAgx alloys. J Physica B 322(1-2): 163-172.
- GM Krishna, N Veeraiah, N Venkatramaiah, R Venkatesan (2006) Induced crystallization and physical properties of Li20-CaF2-P205:Ti02 glass system Part I. Characterization, spectroscopic and elastic properties. J Alloys and Compounds.

Top Editors
-

Mark E Smith
Bio chemistry
University of Texas Medical Branch, USA -

Lawrence A Presley
Department of Criminal Justice
Liberty University, USA -

Thomas W Miller
Department of Psychiatry
University of Kentucky, USA -

Gjumrakch Aliev
Department of Medicine
Gally International Biomedical Research & Consulting LLC, USA -

Christopher Bryant
Department of Urbanisation and Agricultural
Montreal university, USA -

Robert William Frare
Oral & Maxillofacial Pathology
New York University, USA -

Rudolph Modesto Navari
Gastroenterology and Hepatology
University of Alabama, UK -

Andrew Hague
Department of Medicine
Universities of Bradford, UK -

George Gregory Buttigieg
Maltese College of Obstetrics and Gynaecology, Europe -

Chen-Hsiung Yeh
Oncology
Circulogene Theranostics, England -
.png)
Emilio Bucio-Carrillo
Radiation Chemistry
National University of Mexico, USA -
.jpg)
Casey J Grenier
Analytical Chemistry
Wentworth Institute of Technology, USA -
Hany Atalah
Minimally Invasive Surgery
Mercer University school of Medicine, USA -

Abu-Hussein Muhamad
Pediatric Dentistry
University of Athens , Greece

The annual scholar awards from Lupine Publishers honor a selected number Read More...


