Lupine Publishers Group
Lupine Publishers
Menu
ISSN: 2638-5910
Research Article(ISSN: 2638-5910) 
Serum Leptin levels in Sudanease with type 2 diabetes mellitus link to obesity indexes and Lipid profile Volume 4 - Issue 3
Nahla Ahmed Mohammed Abderahman1*, Mohammed Ahmed Ibrahim Ahmed2 and Abderrhman Ahmed Mohamed Ismaeil3
- 1Department of Biochemistry, Nile Valley University-Atbara, Sudan
- 2Department of Microbiology, Nile Valley University- Atbara, Sudan
- 3Associate Professor, Department of Physiology, Sinnar University, Sinnar State, Sudan
Received: December 21, 2022 Published: January 24, 2023
Corresponding author: Nahla Ahmed Mohammed Abderahman, Assistant professor of Biochemistry, Department of Biochemistry, Nile Valley University-Atbara, Sudan
DOI: 10.32474/ADO.2023.04.000188
Abstract
Background: It is expected that there will be 366 million diabetics worldwide by 2030, up from 171 million in 2000. Regardless of their level of development, all nations need to do more to prevent and treat diabetes mellitus and its complications.
Aim: There was limited data of the adipocytokine leptin’s (Lep) metabolic effects on diabetes patients in Sudan and its connection to the serum lipid profile (Cholesterol, Triglyceride, High density lipoprotein and low density lipoprotein). The purpose of this study is to determine how fasting plasma glucose, glycemic control, lipid profile, and leptin levels relate to each other in Sudanese people with and without diabetes.
Methods: Between April 2012 and March 2013, a case-control research involving 200 people was carried out to evaluate the levels of leptin, diabetic profile, and lipid profile. 100 people who were nondiabetic or in the control group were among the 100 participants with diabetes. Participants responded to questions about their personal and clinical characteristics on a questionnaire. We measured the participants’ weight (kg), height (m), and BMI (Kg/m2), respectively. Blood was drawn from the veins following an overnight fast. The study population consisted of patients who visited the Abu A’gla Health Care Center from the Wad Madani city district and other nearby rural and urban areas. The participants represented many Sudanese tribes. Ages of the participants in this study ranged from 22 to 65, and none of them were currently infected or suffering from diabetes-related complications. The non-diabetic group consisted of healthy adults who consented to participate in the study.
Results: According to the study’s findings, the mean WC increased between the diabetic and non-diabetic groups by a nonsignificant amount (p=0.143) and was significantly positively linked with the Lep level (p<0.0001). Between the diabetic and nondiabetic groups, the mean BMI significantly elevated (p=0.037), and the Lep level significantly positively correlated (p<0.0001). Between the diabetes and non-diabetic groups, the mean FPG and HbA1C significantly increased and showed a strong positive correlation with Lep level (all with p<0.0001). Between the diabetes and non-diabetic groups, the mean HDL-C decreased nonsignificantly (p=0.581), and it significantly positively correlated with Lep level (<0.0001). While 88 (88%) diabetics had normal mean Lep concentrations and 12 (12%) had low concentrations, 47 (58.02%), 33 (40.74), and 1 (1.23%) non-diabetics had normal, low, and high Lep concentrations, respectively, with a significant decline in its concentration of (<0.0001).
Conclusion: Both participants with diabetes and those without it in Sudan had lep concentrations within the accepted value. Between the groups with and without diabetes, the mean values of BMI, FPG, and HbA1C significantly increased. They also significantly positively correlated with Lep levels. Lep concentration and lipid profile had a strong negative correlation, and their mean concentration was non-significantly higher.
Keywords: Leptin; Type 2 Diabetes Mellitus; Sudan
Introduction
In the Sudan, diabetes is one of the most prevalent chronic diseases, with a prevalence of 447,000 in 2000 and a projected increase to 1,227,000 in 2030 [1]. According to Elbagir et al. [2] there is a potential for a catastrophic rise in the prevalence of kidney and cardiovascular disease due to the prevalence of T2DM in the Sudanese population, which is estimated to be 3.4%. T2DM also accounted for 75% of all diagnosed cases in the northern parts of Sudan in 1996 [3]. The National Cholesterol Education Program Adult Treatment Panel III (NCEP ATP III) defined metabolic syndrome as a group of metabolic diseases that include glucose intolerance, T2DM, atherogenic dyslipidemia, CVD, high blood pressure, HTN, and central obesity. These abnormalities occur in the same person and result in a number of risk factors that frequently co-occur [4].
In addition, one of those abnormalities frequently comes first [5]. The presence of three or more of the following metabolic disorders meets the criteria for metabolic syndrome: abdominal fat WC >102 cm in males and >88 cm in women, hypertriglyceridemia (TG 150 mg/dL), low HDL-C (40 mg/dL in men and 50 mg/dL in women), elevated blood pressure (SBP 130 mmHg, DBP 85 mmHg), and elevated FPG 110 mg/dL are all risk factors [6]. A disorder in lipid metabolism known as dyslipidemia causes variations in the serum levels of circulating lipids and lipoproteins [7]. This change can be seen in the elevated TG, LDL, and declining HDL cholesterol levels [8]. According to Assmann and Schute (1988) [9], metabolic abnormalities of lipoprotein quantity and quality are linked to an increased prevalence of cardiovascular problems and chronic heart disease in T2DM patients. Lipoprotein typically contains 60–70% LDL–C, 20–30% HDL–C, and 10-15% VLDL–C of the total serum cholesterol [10].
Lep and insulin interact to modify adipocytokine production. Lep is a positive regulator, and it boosts the expression of its genes to reduce appetite [11]. Adipocytokines, on the other hand, Adipocytokines, are believed to influence how insulin acts in other tissues and play a part in the obesity-related insulin resistance [12-14]. It was hypothesized that elevated plasma Lep levels were related to obesity, HTN, dyslipidemia, and metabolic syndrome in T2DM [15]. Studying adipocytokine levels in T2DM and their relationships to anthropometry, diabetic profile and lipid profile parameters may help to clarify the function of Lep in type 2 diabetes and the risk of cardiovascular complications that go along with it. It may also aid in the prevention and treatment of these complications in Sudanese diabetics.
Subjects, Materials and Methods
Study Design and Area
This study was a cross-sectional case-control investigation conducted at the Abu A’gla health center for diabetic care in Wad Madani, Gezira state, Sudan. Al Gezira state has 3,575,280 people living there as of the 2008 statistics, of which 1,723,488 were men and 1,851,792 were women. By 2016, the population is projected to reach 4,759,764 people (Central Bureau of Statistics). Each participant gave their verbal consent, and the study was given ethical approval by the Ethics Committee of the Faculty of Medicine at the University of Gezira.
Study Subjects
In the study, 200 adults of both sexes participated. 100 of them were type 2 diabetics who were not hypertensive (the diabetic group), and 100 others appeared to be in good health but were not diabetics or hypertensives (control group). Participants came from Wad Madani’s rural and urban communities who use the Abu A’gla health center for medical care. The study took place between April 2012 and March 2013. Participants in this study had to be between the ages of 22 and 65 yrs., be free of any infections, and not have any complications from diabetes. A control group was comprised of voluntary participants who appeared to be in good health. If a subject does not fit any of the inclusion requirements, they were excluded.
Collection and Preparation of Blood Samples
Following an overnight fast, five milliliters of venous blood from each participant were taken using a conventional aseptic technique and separated into three parts: Blood samples were divided after centrifugation and used to measure the lipid profile and the adipocytokine concentration of Lep. One milliliter of blood was placed in an EDTA container to measure HbA1C, one milliliter in a fluoride container to measure plasma glucose, and three milliliters were placed in a lithium heparin container.
Data Collection
Each participant completed a structured questionnaire to provide information on their demographics, medical history, and personal and family history. All study participants had their weight and height measured in kilograms (kg) and meters (m), respectively. The body mass index (BMI) was then determined using the following formula:
BMI = (weight in kg) / (height in m)2.
Using the random-access analyzer A15, plasma samples were tested for several biochemical characteristics, as shown below.
Using glucose oxidase/peroxidase, plasma glucose was assessed (Code: 12503). Fasting blood sugar reference range: 110 mg/dl [16]. Hemoglobin A1C turbidimetry was used to measure glycosylated hemoglobin (HbA1C), and the reference ranges are shown below (Source 1).
Cholesterol oxidase/peroxidase (Code: 12505), glycerol phosphate oxidase/peroxidase (Code: 12528), cholesterol HDL direct (Code: 12557), and cholesterol LDL direct (Code: 12558) were used to measure total cholesterol (TC), triglycerides (TG), high density lipoprotein cholesterol (HDL-C), and low-density lipoprotein cholesterol (LDL-C (Code: 12585). The table below shows the lipid profile reference ranges (Source 2).
Results
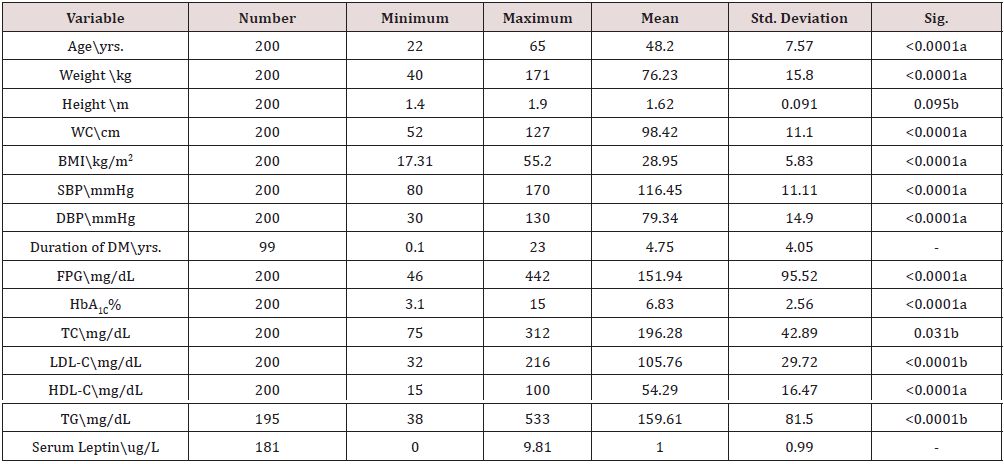
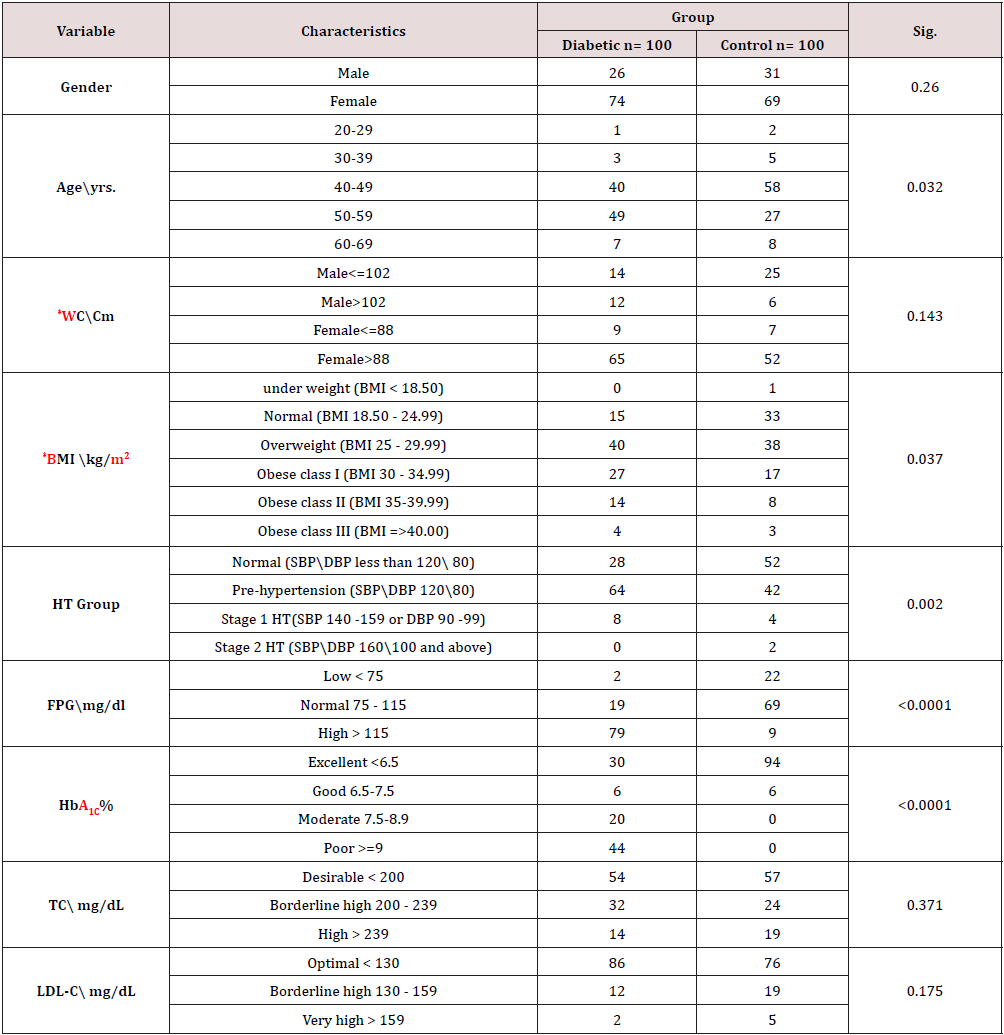
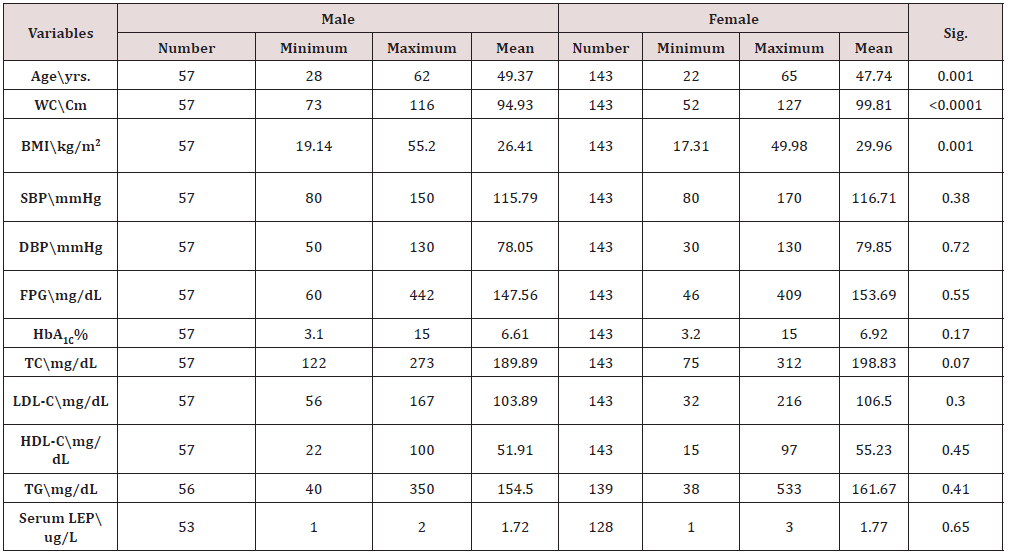
The results of the current study show that age significantly positively correlated with Lep level (p<0.0001) and that the mean difference between the diabetes and non- diabetic groups did not significantly differ (p=0.26). The mean WC increased nonsignificantly between the diabetes and non- diabetic groups by (p=0.143) and strongly positively correlated with the Lep level (p<0.0001). The mean BMI increased significantly between the diabetes and non- diabetic groups by (p=0.037) and had a significant positive correlation with Lep level (p<0.0001). The mean FPG and HbA1C increased considerably between the diabetes and nondiabetic groups and had a strong positive association with Lep level (all with p<0.0001). The mean of TC increased non-significantly between the diabetes and non-diabetic groups by (p=0.371) and had a significant negative correlation with Lep level by (p=0.031).
The mean LDL-C increased non-significantly between the diabetes and non- diabetic groups by (p=0.175) and had a significant negative correlation with Lep level (<0.0001). The mean HDL-C decreased non-significantly between the diabetes and non- diabetic groups by (p=0.581) and had a significant positive correlation with Lep level (<0.0001). The mean TG increased non-significantly between the diabetes and non- diabetic groups by (p=0.203) and had a significant negative correlation with Lep level (<0.0001). In comparison, 47(58.02%), 33(40.74), 1(1.23%) non-diabetics had normal, low, and high Lep concentrations, with a significant drop in its concentration of (<0.0001), whereas 88(88%) diabetics had normal mean Lep concentration and 12(12%) had low concentrations (Table 1-3).
a: Based on positive ranks; b: Based on negative ranks; FPG: Fasting Plasma Glucose; HbA1C: Glycosylated Hemoglobin; TC: Total Cholesterol; LDL-C: Low Density Lipoprotein Cholesterol; HDL-C: High Density Lipoprotein Cholesterol; TG: Tri-Glycerides; SBP: Systolic Blood Pressure; DBP: Diastolic Blood Pressure; SBP: Systolic Blood Pressure; mmHg: millimeter of mercury; DM: Diabetes Mellitus; WC: Waist Circumferance; BMI: Body Mass Index; Cm: Centimeter; Kg: kilogram; m: Meter.
Source: NHLBI Obesity Education Initiative (2000)*; FPG: Fasting Plasma Glucose; HbA1C: Glycosylated Hemoglobin; TC: Total Cholesterol; LDL-C: Low Density Lipoprotein Cholesterol; HDL-C: High Density Lipoprotein Cholesterol; TG: Tri-Glycerides; SBP: Systolic Blood Pressure; DBP: Diastolic Blood Pressure; mmHg: millimeter of mercury; HT: Hypertension; DM: Diabetes Mellitus; WC: Waist Circumferance; BMI: Body Mass Index; Cm: Centimeter, Kg: kilogram, m: Meter.
FPG: Fasting Plasma Glucose; HbA1C: Glycosylated Hemoglobin; TC: Total Cholesterol; LDL-C: Low Density Lipoprotein Cholesterol; HDL-C: High Density Lipoprotein Cholesterol; TG: Tri-Glycerides; SBP: Systolic Blood Pressure; DBP: Diastolic Blood Pressure; mmHg: millimeter of mercury; WC: Waist Circumference; BMI: Body Mass Index; Cm: Centimeter; Kg: kilogram; m: Meter.
Discussion
There were 200 participants in the current study, of which 57 were men and 143 were women. They range in age from 22 to 65. There was a significant increase in FPG in the study group, which indicates the little care about controlling blood glucose among study participants, this finding undoubtedly led to alteration in all cellular reactions, especially in metabolic pathways of micronutrients including glucose, fatty acid, and amino acid [17]. According to Watson et al 2011 .’s research, obesity is linked to a worsened response to insulin, which is demonstrated by greater HbA1C levels and lower accomplishment of the target value. These BMI measurements revealed that the development of insulin resistance and T2DM is associated to the distribution of body fat and visceral adiposity in diabetic and non-diabetic individuals [18]. Our data on HbA1C shows that diabetic groups had significantly higher levels of HbA1C, which suggests poor blood glucose control. The international diabetes federation (IDF) reported in 2015 that a 1% decrease in HbA1C will significantly lower the probability of dying from diabetes to 21%. In both microvascular and macrovascular consequences of DM, the likelihood of glycemic control was dramatically reduced [19].
First, this study discusses how BMI affects individuals with diabetes compared to participants without diabetes, and it shows that 73 participants were obese, 78 participants were overweight, 48 participants were in the normal range, and only one participant was underweighted. The peptide leptin, which is the ob gene’s product, has a high correlation with adiposity and may play a role in determining obesity and its problems. According to the results of the current investigation, lep concentration is also correlated with BMI, body fat, and patients with Type 2 diabetes mellitus as well as non-obese and obese participants as reported by Haffner SM et al. [20]. Other research have revealed the relationship of spontaneous or forced weight changes and serum leptin levels, which is consistent with our findings regarding the existence of a positive correlation between the circulating leptin levels and the body weight [21]. Both obese and normal weight humans who lost weight through dietary restriction were shown to have lower serum leptin levels, regardless of the baseline concentration [22-26].
Conclusion
Both participants with diabetes and those without it in Sudan had lep concentrations within the accepted value. Between the groups with and without diabetes, the mean values of BMI, FPG, and HbA1C significantly increased. They also significantly positively correlated with Lep levels. Lep concentration and lipid profile had a strong negative correlation, and their mean concentration was nonsignificantly higher.
Recommendations
More research is needed and measuring the insulin resistance will provides accurate and precise data.
Acknowledgements
Thank you to all of the participants, especially the diabetic patients, for donating their time and expertise to help us finish this study.
Conflict of Interest
None.
References
- World Health Organization (2011) Regional office for south- East Asia. Hypertension fact sheet department of sustainable development and healthy environments.
- Elbagir M, Eltom M, Elmahadi M (1996) Population-based study of the prevalence of diabetes mellitus and impaired glucose tolerance in adults in Northern Sudan. Diabetes Care 19: 1126-1128.
- Krum H, Gilbert RE (2003) Demographics and concomitant disorders in heart failure. Lancet 362: 147-158.
- Sattar N, Gaw A, Scherbakova O (2003) Metabolic syndrome with and without C-reactive protein as a predictor of coronary heart disease and diabetes in the West of Scotland coronary prevention study. Circulation 108: 414-419.
- Schutta MH (2007) Diabetes and hypertension: Epidemiology of the relationship and pathophysiology of factors associated with these comorbid conditions. J CardiometabSyndr 2 (2): 124-130.
- Matthews DR, Rudenski AS, Naylor BA, Treacher DF, Turner RC (1985) Homeostasis model assessment: Insulin resistance and beta-cell function from fasting plasma glucose and insulin concentrations in man. Diabetologia 28: 412-419.
- Giuliano ICB, Caramelli B (2008) Dis-lipidemia snainfância and adolescência. Pediatria 29: 275-285.
- Scott MG, Diane Becker RN, Luther TC, Richard SC, Margo AD, et al. (2001) Executive summary of the third report of the National Cholesterol Education Program (NCEP). Expert panel on detection, evaluation, and treatment of high blood cholesterol in adults (Adult Treatment Panel III). JAMA 285: 2486-2497.
- Assmann G, Schute H (1988) The prospective cardiovascular Minster (Procam) study: Prevalence of hyperlipidaemia in persons with hypertension and/or diabetes mellitus and the relationship to coronary heart disease. Am Heart J 116: 1713.
- Scott MG, Diane Becker RN, Luther TC, Richard SC, Margo AD, et al. (2002) Executive summary of the third report of the National Cholesterol Education Program (NCEP). Expert panel on detection, evaluation, and treatment of high blood cholesterol in adults (Adult Treatment Panel III). JAMA 285(19): 2486-2497.
- Yamauchi T, Kamon J, Waki H, Terauchi Y, Kubota N, et al. (2001) The fat-derived hormone adiponectin reverses insulin resistance associated with both lipoatrophy and obesity. Nat Med 7: 941-946.
- Fantuzzi G (2005) Adipose tissue, adipokines, and inflammation. J Allergy ClinImmunol 115: 911-919.
- Rabe K, Lehrke M, Parhofer KG, Broedl UC (2008) Adipokines and insulin resistance. Mol Med 14: 741-751.
- Hansen D, Dendale P, Beelen M, et al. (2010) Plasma adipokine and inflammatory marker concentrations are altered in obese, as opposed to non-obese, type 2 diabetes patients. Eur J Appl Physiol 109(3): 397-404.
- Sari R, Balci MK, Apaydin C (2010) The relationship between plasma leptin levels and chronic complication in patients with type 2 diabetes mellitus. Metabolic syndrome and related disorders 8(6): 499-503.
- Michael LB, Janet LD, Edward PF (2002) Clinical chemistry principles, procedures, correlations, 4th pp: 223.
- Perseghin G, Petersen K, Shulman GI (2003) Cellular mechanism of insulin resistance: Potential links with inflammation. Int J Obes Relat Metab Disord 27(3): 6-11.
- Montague CT, O Rahilly S (2000) The perils of portliness: causes and consequences of visceral adiposity. Diabetes 49: 883-888.
- Swetha NK (2014) Comparison of fasting blood glucose & post prandial blood glucose with HbA1c in assessing the glycemic control. International J of Healthcare and Biomedical Research 2(3): 134-139.
- Haffner SM, Stern MP, Miettinen H, Wei M, Gingerich RL (1996) Leptin concentrations in diabetic and nondiabetic Mexican-Americans. Diabetes 45(6): 822-824.
- Considine RV, Sinha MK, Heiman M, Kriauciunas A, Stephens T, et al. (1996) Serum immunoreactive-leptin concentrations in normal-weight and obese humans. N Engl J Med 334(5): 292-295.
- Maffei M, Halaas J, Ravussin E, Pratly RE, Lee GH, et al. (1995) Leptin levels in human and rodent; measurement of plasma leptin and ob RNA in obese and weight-reduced subjects. Nat Med 1: 1155-1161.
- Grundy SM, Hansen B, Smith SC, Cleeman JI, Kahn RA (2004) Clinical management of metabolic syndrome: Report of the American Heart Association/National Heart, Lung, and Blood Institute/American Diabetes Association conference on scientific issues related to management. Circulation 109: 551-556.
- National Institutes of Health Obesity Education Initiative NHLBI (2000) The practical guide. Identification, evaluation and treatment of overweight and obesity in adults. (NIH Publication Number 00‐4084).
- Delbert A, Waeal S, Richard W (2007) Quest Diagnostics Nichols Incorporated. 4th edition, USA.
- Diabetes Multidisciplinary Team (2009).

Top Editors
-

Mark E Smith
Bio chemistry
University of Texas Medical Branch, USA -

Lawrence A Presley
Department of Criminal Justice
Liberty University, USA -

Thomas W Miller
Department of Psychiatry
University of Kentucky, USA -

Gjumrakch Aliev
Department of Medicine
Gally International Biomedical Research & Consulting LLC, USA -

Christopher Bryant
Department of Urbanisation and Agricultural
Montreal university, USA -

Robert William Frare
Oral & Maxillofacial Pathology
New York University, USA -

Rudolph Modesto Navari
Gastroenterology and Hepatology
University of Alabama, UK -

Andrew Hague
Department of Medicine
Universities of Bradford, UK -

George Gregory Buttigieg
Maltese College of Obstetrics and Gynaecology, Europe -

Chen-Hsiung Yeh
Oncology
Circulogene Theranostics, England -
.png)
Emilio Bucio-Carrillo
Radiation Chemistry
National University of Mexico, USA -
.jpg)
Casey J Grenier
Analytical Chemistry
Wentworth Institute of Technology, USA -
Hany Atalah
Minimally Invasive Surgery
Mercer University school of Medicine, USA -

Abu-Hussein Muhamad
Pediatric Dentistry
University of Athens , Greece

The annual scholar awards from Lupine Publishers honor a selected number Read More...


