Lupine Publishers Group
Lupine Publishers
Menu
ISSN: 2637-4609
Short Communication(ISSN: 2637-4609) 
Phytochemical Screening and Proximate Analysis of Garlic (Allium Sativum) Volume 4 - Issue 2
Mohamed Riyas Hanifa and Mohamed Ibrahim Elzagheid*
- Chemical and process Engineering Technology Department, Jubail Industrial College, Kingdom of Saudi Arabia
Received: May 05, 2019; Published: May 10, 2019
*Corresponding author: Mohamed Ibrahim Elzagheid, Chemical and Process Engineering Technology Department, Jubail Industrial College, Jubail Industrial City, Kingdom of Saudi Arabia
DOI: 10.32474/AOICS.2019.04.000181
Abstract
The objective of this work is to separate and characterize qualitatively unknown crude oil samples by using available equipment and glassware found normally in most chemical laboratories. This approach is neither time-consuming nor expensive. A simple distillation setup was used to prepare the samples, and boiling range apparatus was used to measure the exact boiling points of the samples before the fractional distillation. Selected crude oil fractions obtained from fractional distillation were then characterized by using a refractometer, and a density meter. Obtained results were then compared with available reference values from authentic samples.
Keywords: Crude oil; Chemical laboratory; Laboratory scale; Separation and characterization; Laboratory conventional techniques
Introduction
A very large number of hydrocarbon compounds are found in crude oil, natural gas, and coal. The three major groups of compounds are the alkanes, alkenes, and aromatics [1]. Hydrocarbons are natural organic compounds that have hydrogen, carbon in their structure. They are classified as aliphatic and aromatic and exist as saturated and unsaturated. There are two types of petroleum which come straight from the ground, crude oil and condensate. Crude oil is a dark and viscous liquid while condensate is a clear and volatile liquid. Crude oil is usually black in color but it also appears as other colors like green, red or brown. Crude oil has either light volatile oil or heavy viscous characteristics. This depends on how the crude oil vaporizes when it is heated or is affected by added chemical agents. A major part of the petroleum produced globally is in the form of emulsion [2]. There are many techniques used for crude oil analysis and among them are gas chromatography, gas chromatography– mass spectrometry, and ultra violet spectroscopy [3]. Gas chromatography is very useful technique in the characterization of hydrocarbons and other organic compounds. Using this technique, molecular species present in the samples, and their concentrations can be identified and their composition can be determined [4,5].
It is very crucial to distil the crude oil before carrying GC analysis to avoid column precipitation that is usually encountered during the analysis [6]. Alternatively, heavy fractions of crude oil can be removed from the chromatographic system by back-flush technique [7]. A better analysis of heavy petroleum fractions, that contain hydrocarbons, can be done by using high temperature comprehensive two-dimensional gas chromatography [8]. Among the methods that are used for the analysis and characterization of the crude oil are gas chromatography with flame-ionization or mass spectrometry detection and general gravimetry [9]. The major disadvantage of these techniques is their cost, the time they consume for sample preparation and the use of unsafe extraction solvents [10]. The experimental set-up and procedures presented in this article successfully give a qualitative analysis and characterization of unknown crude oil samples and can be generally used when an instrument such GC is not available or expensive to be purchased.
Analysis and Results
In this work, we present a chemical laboratory scale separation and characterization of Saudi Arabian crude oil by using conventional lab experimental techniques and equipment described in more details in the following procedures. Those separated sample are clean and pure enough and also suitable for further analysis by GC, if desired.
Crude oil separation
Simple distillation
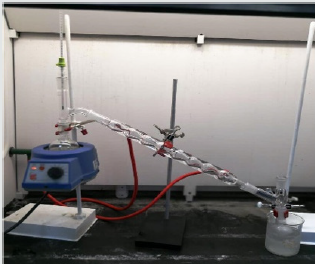
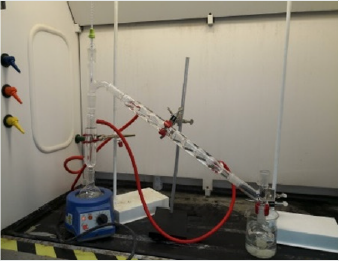
A simple distillation [11] set up was used as shown in Figure 1. The crude oil (about 250ml three batches) was transferred to 500ml round bottom flask. About 120ml of the distillate was collected and used for the following experiments.
Boiling range
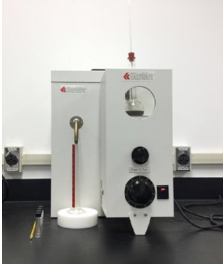
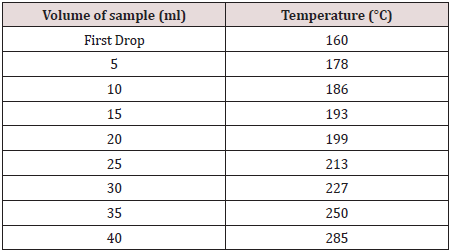
The boiling range instrument [12] shown in Figure 2 was used to find out the initial boiling points of the samples that were collected from the simple distillation. About 50ml of the sample was placed in a distilling flask. The temperature of the first drop was recorded then after each 5ml collection; the temperature was recorded and tabulated in Table 1.
Petroleum oil ASTM color
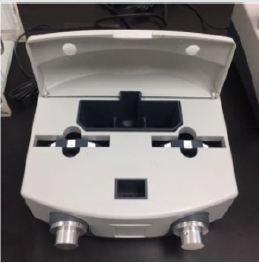
The ASTM color comparator [13] shown in Figure 3 is normally used for the analysis of different petroleum products and has been adopted for our samples for color measurement and grading. The sample to be tested (about 70ml) was placed in a glass cell contained in the middle field. The color of each tested sample was compared directly with the colored glass standard. The sample was then viewed and adjacent standards were tested until the color of the adjacent was the same or close to the color of the sample. The ASTM color for each distillate sample was determined and it was found to be at ASTM L1.5.
Fractional distillation
This distillation process [14] was used to separate the components of the crude oil on the basis of boiling points as shown in Figure 4. About 300ml sample was transferred to 500ml round bottom flask. The temperature was recorded when the first drop was observed, and then at every 10 °C increment. The distillate was collected within 10 °C range from 90 °C to 220 °C. The collected samples were used following experiments.
Crude oil characterization
Refractive Index
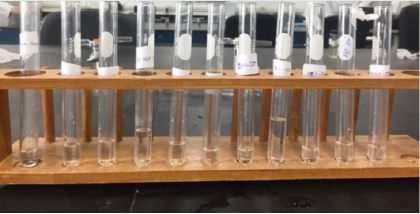
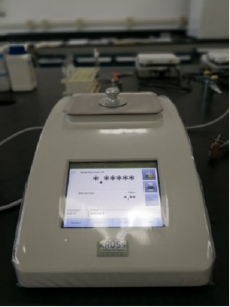
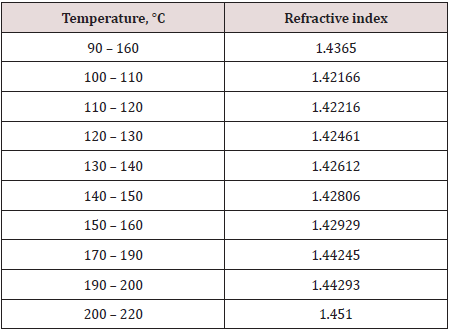
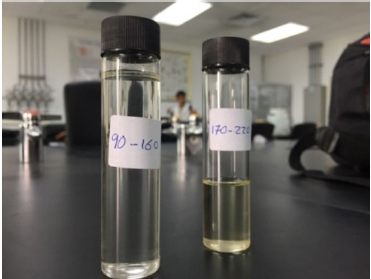
This technique is usually used to measure of the bending of a ray of light when passing from one medium into another. The refractive indexes of the selected samples shown in Figure 5 were measured by the refractometer shown in Figure 6 as following: 2-3 drops of each of the previously distilled samples were placed over the measuring prism. Sample cover was placed over the sample prism to block stray light and slow evaporation. Readings for all samples are recorded in Table 2.
When compared with authentic references samples of gasoline and diesel, it was found that the collected samples may contain mainly gasoline and diesel. Samples with close results (Figure 7) were mixed together and tested again and the obtained results were recorded and presented in Table 3.
Table 3: Refractive Index of Gasoline mixed with the 90–160 °C sample and Diesel mixed with the 170–220 °C sample.

Density
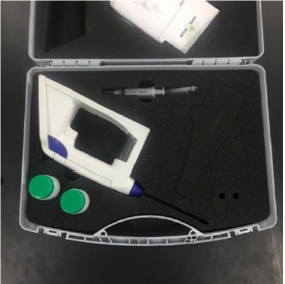
In this experiment, we used a density meter shown in Figure 8 to determine the density of our obtained samples (about 5ml each) then we compared them with reference values of authentic samples and the obtained results are shown in Table 4.
Table 4: Density of Gasoline mixed with the 90– 160 °C sample and Diesel mixed with the 170–220 °C sample.

Conclusion
Based on the above collected results that were acquired by the techniques that we used for the separation and characterization of the crude oil samples in our laboratory, only two main products (fractions) have existed; diesel as a major product and gasoline as a minor product.
Acknowledgement
Authors of this article thank JIC management team and JICRPPAP Team for their continuous help and support.
References
- Oforka NC, Osuji LC, Onojake MC (2012) Petroleum hydrocarbon fingerprinting of crude oils from umutu/bomu oil fields in Niger Delta, Nigeria. Archives of Applied Science Research 4(1): 246-253.
- Abdurahman HN, Rosli MY (2006) Stability Investigation of Water-in-Crude Oil Emulsion. Journal of Applied Sciences 6(14): 2895-2900.
- Wang Z, Fingas NF (2003) Development of oil hydrocarbon fingerprinting and identification techniques. Mar Pollut Bull 47(9-12): 423-452.
- Hunt JM (1996) Petroleum Geochemistry and Geology. Freeman and company. New York, USA, pp. 231 -238.
- Peters KE, Walters CC, Moldowan JM (1999) The Biomarker Guide: Interpreting Molecular Fossils in Petroleum and Ancient Sediments. Cambridge University Press, Cambridge, England.
- Blomberg J, Schoenmakers PJ, Brinkman UAT (2002) Gas chromatographic methods for oil analysis. Journal of Chromatography A 972(2): 137–173.
- Sanders WJ (1989) Practical applications. In: Hyder KJ, (Eds.), High Resolution Gas Chromatography, (3rd edn). Hewlett-Packard, Wilmington, Delaware, USA, pp. 1-23.
- Dutriez T, Courtiade M, Thiébaut D, Dulot H, Hennion MC (2010) Improved hydrocarbons analysis of heavy petroleum fractions by high temperature comprehensive two-dimensional gas chromatography. Fuel 89(9): 2338–2345.
- Okparanma RN, Mouazen AM (2013) Determination of total petroleum hydrocarbon (TPH) and polycyclic aromatic hydrocarbon (PAH) in soils: a review of spectroscopic and non-spectroscopic techniques. Appl Spectros Rev 48(6): 458–486.
- Scafutto RDM, Filho CRSD (2016) Quantitative characterization of crude oil sand fuels in mineral substrates using reflectance spectroscopy: Implications for remote sensing. International Journal of Applied Earth Observation and Geoinformation 50: 221–242.
- http://web.sjc-albany.wa.edu.au/StudentResources/Carbon/resources/ast0263/Crude%20oil%20distillation.pdf
- Quiggle D, Tongberg CO, Fenske MR (1934) Apparatus for Boiling Point and Boiling Range Measurements. Industrial and Engineering Chemistry Analytical Edition 6(6): 466-468.
- https://gardco.com/pages/color/petroleum_clrcomparator.cfm
- Vesper GH (1926) Laboratory distillation analysis of petroleum. Industrial Engineering Chemistry 18(1): 64–67.

Top Editors
-

Mark E Smith
Bio chemistry
University of Texas Medical Branch, USA -

Lawrence A Presley
Department of Criminal Justice
Liberty University, USA -

Thomas W Miller
Department of Psychiatry
University of Kentucky, USA -

Gjumrakch Aliev
Department of Medicine
Gally International Biomedical Research & Consulting LLC, USA -

Christopher Bryant
Department of Urbanisation and Agricultural
Montreal university, USA -

Robert William Frare
Oral & Maxillofacial Pathology
New York University, USA -

Rudolph Modesto Navari
Gastroenterology and Hepatology
University of Alabama, UK -

Andrew Hague
Department of Medicine
Universities of Bradford, UK -

George Gregory Buttigieg
Maltese College of Obstetrics and Gynaecology, Europe -

Chen-Hsiung Yeh
Oncology
Circulogene Theranostics, England -
.png)
Emilio Bucio-Carrillo
Radiation Chemistry
National University of Mexico, USA -
.jpg)
Casey J Grenier
Analytical Chemistry
Wentworth Institute of Technology, USA -
Hany Atalah
Minimally Invasive Surgery
Mercer University school of Medicine, USA -

Abu-Hussein Muhamad
Pediatric Dentistry
University of Athens , Greece

The annual scholar awards from Lupine Publishers honor a selected number Read More...


