Lupine Publishers Group
Lupine Publishers
Menu
ISSN: 2637-4609
Research Article(ISSN: 2637-4609) 
Influence of the Cr Content on the Corrosion Properties of a Series of Binary Cobalt-Chromium Alloys in Acidic Artificial Saliva Volume 2 - Issue 1
Estelle Kretz and Patrice Berthod*
- Faculty of Science and Technologies, University of Lorraine, France
Received: February 23, 2018; Published: March 06, 2018
Corresponding author: Estelle Kretz, Faculty of Science and Technologies, Institut Jean Lamour, University of Lorraine, Campus Victor Grignard, Postal Box 70239, 54506 Vandoeuvre-les-Nancy, Cedex, France
DOI: 10.32474/AOICS.2018.02.000128
Abstract
Cobalt-based alloys are more and more considered for dental applications, instead the expensive noble alloys and the other predominantly based alloys based on the allergen element nickel. These alloys frequently contain chromium to allow good resistance against corrosion as this may take place in the buccal milieu. The most often chromium is present in high quantity, close to 30wt. %, but it is maybe possible to decrease a little its contents without losing corrosion resistance. The aim of this study is exploring how the corrosion behavior of a cobalt alloy may vary versus its chromium content. In order to simplify this investigation only Co- xCrbinary alloys were considered, with x decreasing from 30 to 0wt.% by slices of 5wt.%. A series of seven alloys was synthesized by foundry under inert atmosphere and their behavior in corrosion in an artificial saliva of simple composition (NaCl 9g/L) acidified to pH=2.3 was specified using various classical electrochemical techniques (open circuit potential follow-up, Stern-Geary, Tafel, cyclic polarization). It appeared that passivation of the alloys occurred during the first two hours of immersion when the chromium content was 10 wt. % or higher, with as result high corrosion potentials and low corrosion current densities..
Keywords: Dental cobalt alloys; Chromium content; Acidic artificial saliva; Corrosion; Electrochemical techniques
Introduction
Crowns and other dental prostheses such as fixed partial dentures are reinforced metallic alloys to combat the intense stresses induced by mastication. Concerning fixed partial dentures the name of the complex piece supporting the cosmetic part of the prosthesis (artificial teeth) is framework. These frameworks are composed of "parent alloy" parts which are soldered to one another [1]. Different categories exist for the parent alloys. There the "High Noble" alloys (Au + Pt + ... > 60wt. % of noble metals), "Noble" ones (> 25 wt.%) and "Predominantly Base" alloys (less than 25wt% of noble metals). Many "Predominantly Base" parent alloys are based on nickel and contain chromium in rather high quantity for the resistance against corrosion in mouth. However nickel may potentially lead to allergic reactions [2]. Other "Predominantly Base" alloys also exist with not so serious problems: some alloys based on cobalt [3].
Cobalt-chromium alloys are the most popular cobalt-based dental alloys. They often contain molybdenum in their chemical composition [4], to benefit from its solid solution hardening effect. One can notice that chromium and molybdenum improve two types of properties in the same way as in cobalt-based super alloys [5]: resistance to high temperature oxidation and hot corrosion [6] and resistance to high temperature creep deformation [7].
Co-Cr-Mo dental alloys can be synthesized by casting [8] or by powder metallurgy [9,10] for example. Significant contents of other elements such as W [11] or Ti [12] can be also present. The cobalt-chromium alloys are less frequently used for dental prostheses than the nickel-chromium ones but one can find several works concerning their microstructures [13], their mechanical behaviors [14] and their corrosion properties [15,16]. Many cobalt- based alloys devoted to medical applications of various types were subjects of patents, for dental applications as well as for orthopedic prostheses, stents [17]. several types of elaboration and shaping processes are evocated in these patents. Indeed, beside foundry [18] one can find material-removing machining [19], plastic deformation [20], soldering alloys [21], and coating alloys [22]. Various types of composition scan be found in these patents, such as {Co-Cr} +Mo [23], + Mo &Ti [24], + Mo &W [25], + Ni&(Mo, Ti, Ta) [26], + W & Nb [27] and even + Ru [28]. Noble metals can be additionally present in cobalt-chromium alloys [29] while carbon can be added to achieve high strength [30]. This shows that many patents were established about cobalt-chromium alloys and concern various medical uses. In contrast, published articles about these cobalt alloys are curiously rather rare, particularly concerning corrosion studies.
Dental cobalt alloys may thus present a great variety of elements in their compositions. After cobalt, the element which is the most present is chromium, with contents the most often close to 30 wt. %. With about 400°C more in term of melting temperature by comparison to cobalt, chromium is an element both very present and rather refractory. This may be a problem for foundry operations since parts of chromium may be hard to melt totally, this possibly leading to not-melted parts trapped in the microstructures of the as-cast alloys, with potentially detrimental consequences for the mechanical properties. It can be therefore interesting to lower the Cr content. One can find in literature that some rare compositions may contain chromium with contents lower than 30wt. %, e.g. 20wt. % and even 15wt. %. One can guess that melting such alloys should be easier than for alloys containing 30wt.%Cr, but also one can unfortunately expect a decrease in resistance against corrosion. To help choosing lowered chromium contents the knowledge of the dependence of the corrosion of cobalt-based alloys in artificial saliva on the chromium content may be compulsory
The present study aims to explore the dependence of the corrosion behavior on the chromium content in cobalt-based dental alloys by considering a series of binary Co-Cr cast alloys. For these ones the chromium content was decreased by slice of 5wt. %, from 30wt. % down to 0wt. %. High frequency induction melting under inert atmosphere was used for obtaining these alloys, which were thereafter tested in corrosion for conditions typical of the buccal milieu. For that a simple electrolyte, a 9g/L NaCl aqueous solution heated at 37 °C, was chosen. The pH of this simple artificial saliva, among the most classically used in earlier corrosion studies carried out on dental alloys (e.g. [31]), was lowered down to 2.3 to increase its aggressiveness by still respecting the pH which may be encountered in the buccal milieu. Electrochemical techniques classically used characterizing corrosion was employed: three- electrode cell, potensiostat, stationary electrochemical methods (free potential follow-up, Stern-Geary run, Tafel, cyclic polarization).
Material and Methods
The experimental details of this study may be resumed as follows:
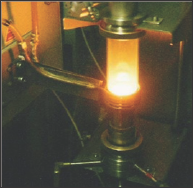
Synthesis of the alloys (Figure 1)
a) Weighing of the pure elements Co and Cr (purity > 99.9wt.%, Alfa Aesar), for 10g of mixture for each alloy; expected Cr contents: 30, 25, 20, 15, 10, 5 and 0wt.%
Figure 1: One of the alloys during its homogenization in its liquid state.
b) Introducing in the copper crucible of the high frequency induction furnace (CELES) and isolating from laboratory air with a silica tube
c) Making of an internal atmosphere of 300mbars of pure Ar (3 cycles of emptying using a primary vacuum pump and filling by pure Ar)
d) Heating, melting, chemical homogenization, cooling and solidification (110kHz, between 4 and 5kV, isothermal stage during 3min in liquid state)
Metallographic preparation and chemical & microstructure characterization
a) Dividing of the spherical ingots in two halves (metallographic saw Delta Abrasimet Cutter, BUEHLER)
b) Embedding of one of the halves in a cold mix of resin and hardener (Mecaprex MA2+, PRESI)
c) Grinding with SiC papers from 400-grit to 4000-grit, under water, ultrasonic cleaning, final polishing with textile containing 1|im diamond particles until mirror-like state
d) Microstructure observation using a Scanning Electron Microscope (JSM-6010LA, JEOL) in Back Scattered Electrons mode (SEM, BSE)
e) Chemical composition measurement with the Energy Dispersion Spectrometer (EDS) attached to the SEM
Obtaining the electrodes
a) Joining of the denuded copper part of a plastic gained electrical wire and the upper part of the second ingot half
b) Embedding of the half ingot with total immersion of the spherical part of the alloy surface and of the denuded part of the electrical wire, the circular plane surface of the half ingot remaining free
c) Grinding and polishing until mirror-like state
Preparation of electrolyte
a) Weighing of NaCl (AnalaR Normapur) and dissolution in distilled water, homogenization during 10 minutes using a magnetic agitator
b) Heating to 37°C +/- 2°C and oxygenation by air bubbling for 15 minutes
c) Adjustment of the pH to 2.3 using a 0.01Mol/L HCl solution, followed by new heating of the solution to 37°C
Setting the corrosion characterization apparatus (Figure 2):
Figure 2: The whole apparatus used for the electrochemical measurements.
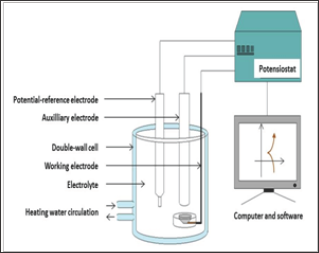
a) Positioning of the double-envelope three-electrode cell, connection to a F32 heater/cooler (JULABO) and heating of the cell by internal circulation of warm water (heated and maintained at about 39°C by the F32 device)
b) Connection of the double-envelope three-electrode cell to a potensiostat (263A, EG&G Instruments P. A. R.)
c) Filling of the cell with the {37°C-heated, 15min aerated, pH 2.3}-solution
d) Immersion of the working electrode (the Co-Cr alloy), the auxiliary electrode (platinum) and the reference electrode (saturated Calomel)
Running of the electrochemical experiments (driven by the Power Suite software):
a) Follow up of the free potential (open circuit potential,Eocp1) of the working electrode for 1h
b) Polarization from E -20mV to E +20mV at 10mV/min and measurement of the polarization resistance Rp1 (leading to the assessment of the current density of corrosion I according to the Stern-Geary method)
c) Follow up of the free potential (open circuit potential,E ocpl) of the working electrode for a supplementary hour
d) Polarization from Eocp -20mV to E ocp+20mV at 10mV/min o and measurement of the polarization resistance R p2, (new I corr)
Then
a) Either a Tafel run (polarization from Eocp - 250mV to Eocp + 250mV at 10mV/min, to determine the Icorr , the corrosionpotential Icorr and eventually the cathodic and anodic Tafel coefficients βx and βα
b) Or a cyclic polarization between Eocp -150mV to Eocp +1.23V at +1mV/s and return to examine the behavior of the alloy at high potential (e.g. passivation, depassivation).
Results/Observations
Obtained Chemical Compositions and Microstructures
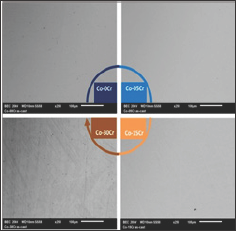
The obtained alloys were first subjected to the assessment of their chemical compositions. Full frame ED's measurements (accuracy: ±1wt. %) performed on the metallic surfaces of the metallographic samples showed that the wished compositions were well respected. The observation of the mirror-like surfaces at various magnifications by varying both brightness and contrast showed that all the alloys were single-phased (Figure 3) and suggested that they were also well chemically homogeneous.
Figure 3: Illustration of the single-phased states of the studied alloys (here only 4 out of the 7 alloys, SEM/BSE, ×250).
Free-Potential Evolution
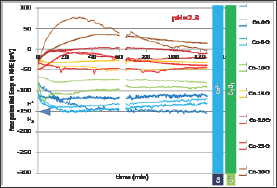
After immersion the free potential or open circuit potential (Eocp) evolution was followed during 2 hours before performing either a Tafel experiment or a cyclic polarization. Thus two Eoc evolutions were recorded between immersion and 2 hours later per alloy. All the 2x7 = 14 curves are plotted together in (Figure 4). For each alloy (associated to a particular color) the thin curve corresponds to the E evolution before Tafel run and the thick one corresponds to the Eocp evolution before the cyclic polarization. One can first see that for a given alloy there is a good reproducibility between the two evolution curves, maybe except for the Co-30Cr alloy. Globally it seems that the higher the chromium contents the higher Eocp potential. Furthermore one may divide the 14 curves in two groups: a low Eocp group containing the pure Co, Co-5Cr and Co- 10Cr alloys, and a high Eocp group gathering the Co-15Cr, Co-20Cr, Co-25Cr and Co-30Cr ones. Quantitative data are available in (Table 1). The numerical values of E at t=1h and at t=2h effectively increase from the Cr-free cobalt alloy and the Cr-richest cCo-30Cr alloy.
Table 1: Freepotential after 1h and 2h of immersion before the Tafel run or the cyclic polarization for all alloys.

Figure 4: Evolution of the free potential Eocp during 2h (all alloys).
Stern-Geary Runs
For each alloy, after 1h or 2h of immersion and Eocp follow-up,ocpa linear polarization between Eocp - 20 mV and Eocp+20mV was ocpapplied to record the I=f(E) curve in its linear part centered on Eocp. The measurement of the slope of the tangent straight line and of the calculation of its inverse value led to the polarization resistance. The two values obtained per alloy after 1 hour of immersion (before Tafel and before cyclic polarization) and the two ones obtained per alloy after 2 hours of immersion are displayed in (Table 2). The Rp values corresponding to the Co-0Cr, Co-5Cr and Co-10Cr are rather low (several hundreds to about 1500Ω*cm2) while the ones of the Co-15Cr, Co-20Cr, Co-25Cr and Co-30Cr alloys are much higher: order of magnitude = 100,000Ωcm2, as is too say x 100 more than for the three first alloys.
Table 2: Polarization resistances after 1h and 2h of immersion before the Tafel run or the cyclic polarization for all alloys.

Tafel Experiments
Table 3: Corrosion potential and corrosion current after 2h of immersion (Tafel method); values of the two Tafel coefficients.

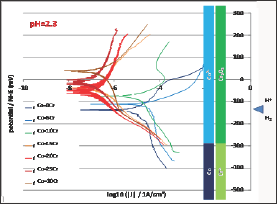
After 2 hours of immersion each alloy was subjected to a Tafel run, performed between 250mV below the last Eocp value and 250mV above the same last Eocp. The seven corresponding curves are plotted together in (Figure 5). When the Cr content in alloy increases the value of the corrosion potential seems to regularly increase, which is confirmed by the values of Ecorr displayed in not regularly evolve versus the chromium content in the alloy but it globally decreases when the alloy is richer in Cr. Furthermore, two groups can be here too constituted: on one hand Co-0Cr, Co-5Cr and Co-10Cr for which the order of magnitude of Icorr is 10-5 A/cm2, and on the other hand Co-15Cr, Co-20Cr, Co-25Cr and Co-30Cr for which the order of magnitude of Icorr is 10-7 A/cm2. The numerical values of Icorr are also given in (Table 3).
Figure 5: Tafel runs after 2h of immersion (all alloys).
Cyclic polarization experiments
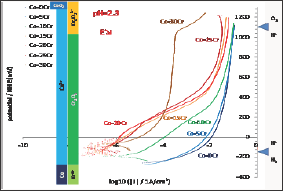
All the alloys also underwent a cyclic polarization. The potential increasing part started 150mV below the last Eocp recorded and linear polarization was applied at constant rate until reaching Eoc + 1.23V. The seven I=f(E) curves plotted in semi-logarithmic scale are presented together in Figure 6. The bottom part of these curves, which are similar to the Tafel ones but without the same potential interval and recorded for a much higher scan rate, show the same features: E(I=0) increasing with the Cr content in alloy and much corrosion currents decreasing when the Cr content increases. Furthermore one can see that the potential increasing parts of the cyclic polarization curves can be themselves gathered between the {Co-0Cr, Co-5Cr, Co-10Cr} group and the group of the four other alloys richer in Cr. The alloys of the first group (low Cr) are characterized with their long anodic part located on the right part of the graph (anodic current from 0.01 to 0.1A/cm2) while the ones of the second group of alloys (high Cr) are more in the middle part of the graph. Between 0 to about +300mV/NHE there are three orders of magnitude for the anodic current densities between the first group and the second one. For higher potentials the difference is lower: between 1 and 2 orders of magnitude. The potential- decreasing parts of the curves are plotted together in (Figure 7) they are seemingly quite similar to the potential-increasing parts.
Figure 6: Going part of the cyclic polarization curves carried out after 2h of immersion (all alloys).
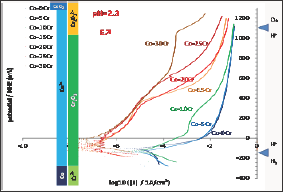
Figure 7: Coming part of the cyclic polarization curves carried out after 2h of immersion (all alloys).
Discussion
The seven binary alloys were successfully synthesized by high frequency induction melting and no not-melted parts were found in the ingots where they were cut. This absence of any inclusion of pure chromium was confirmed by the well-respected Cr content of the solid solution of these single-phased alloys. They were all mounted as electrodes and they underwent different complementary electrochemical experiences. It was seen that the free potential rather clearly depended on the Cr content in alloy. It obviously increases when the Cr content increases and such phenomenon can be related to the nature of the cathodic and anodic reactions. To better understand the differences of behavior one can compare these potentials to the different potential ranges determining the stability of the different possible species at pH=2.3. These domains are added on the right side of (Figure 4) to allow comparison of the average position of the free potentials and the potential limits of the domains corresponding to the different degrees of oxidation of the Co element and of the Cr element, as well as to the water one. One can see that all potentials correspond to the Co2+ and Cr2O3 species. The same configuration is found for the (Figure 4) (Tafel plots) and (Figure 5) (E-increasing-part of the polarization curves).
However the free-potential or corrosion potentials observed for the Co-0Cr, Co-5Cr and Co-10Cr alloys are close to the H+/H2 equilibrium one, this suggesting that these alloys are in an active state. This should be in good agreement with the low polarization resistances and the high corrosion current densities measured for these three Cr-poor alloys. They are obviously subjected to the Co (solid) + 2H+ (solution) -> Co2+ (solution) + H2 (gas) reaction, exclusively (Co-0Cr alloy) or principally (Co-5Cr and Co-10Cr alloys).
In contrast the free potentials/corrosion potentials observed for the Co-15Cr, Co-20Cr, Co-25Cr and Co-30Cr alloys are much higher and far from the H+/H2 equilibrium. These potentials correspond to the stability of the Co2+ and Cr2O3 species too but they are much higher than the H+/H2 equilibrium potential. Taking into account the very low corrosion rates one can deduce that they are passivated, with as consequence a free or corrosion potential defined by an equilibrium between the O2-> H2O reduction reaction (instead H+ -> H2) and the anodic Cr0-> CrVI (Cr(OH)3 or Cr2O3) oxidation reaction, though the passivation layer which probably formed during the first two hours of immersion. Indeed, no anodic peak can be found on the potential-increasing parts of the cyclic polarization, this suggesting that they were already covered by a protective thin scale of Cr(OH)3 or Cr2O3 (chromia) when arriving to the Tafel or the cyclic polarization experiments (thus after less than 2 hours of immersion). The increase in potential observed in (Figure 4) during the first 20 to 30 minutes of immersion suggests that these four Cr-richest alloys were passivating during this first half an hour period. For the Co-30Cr alloy the passivation scale remains stable during the elevation of potential imposed during the potential-increasing part of the cyclic polarization (Figure 6) as well as during all the decrease in potential (Figure 7). For this alloy one must mention that the Cr(OH)3 or Cr2O3 ->Cr2O72- transpassivation reaction starts (E-increasing part, (Figure 6)) or ends (E-decreasing part, (Figure 7)) when the potential reaches the frontier separating the Cr(OH)3 or Cr2O3 andCr2O72- domains. This does not occur for all the other alloys. This is logical for the Co-0Cr to Co-10Cr alloys while this demonstrates that the Co-15Cr to Co- 25Cr alloys are maybe not totally covered by the chromia scale or that this one is too thin. The latter point seems to be confirmed by the sudden increase in anodic current taking place when the applied anodic potential reaches +400mV/NHE for the Co-15Cr and Co-20Cr alloys and +500mV/NHE for the Co-25Cr one.
One can finish by remarking that the Co-10Cr alloy seems starting to passivate in the anodic part of the Tafel experiment. Indeed a clear anodic peak followed by a decrease in current density is obvious in (Figure 5). The same tendency can be seen also on the anodic part of the potential-increasing part of its cyclic polarization curve. But the obtained passivation state seems perfectible since the density of current in the "embryo of passivation plateau" remains very high. Nevertheless one can suppose that a critical Cr content separating active behavior and passive behavior may exist between 10wt.% and 15wt.% for these binary alloys.
Conclusion
This systematic study in a rather simple artificial saliva but which is however particularly aggressive (rather concentration of chloride ions and acidic pH) show that the chromium content can be decreased to 15wt. % without significant loss of the good corrosion resistance (very high polarization resistance, very low corrosion current). It is maybe possible to decrease again the Cr content lower than these 15wt.% but without approaching the 10wt.% for which the polarization resistance is divided by 100 and the corrosion current multiplied by 50 by comparison to 15wt. %Cr. By adding other elements (reactive elements such as Si or Al for instance) it is possible to stabilize the good corrosion resistance while the addition of other ones may be detrimental, on the contrary. The critical Cr must then be established for each real dental alloy with its typical contents in Si, Mo, W and other elements, for example by elaborating and testing in corrosion versions of each complex dental alloy with varying Cr contents. But one can guess that the critical Cr contents maybe not very far the ones of the binary Co-Cr alloys.
Acknowledgements
The authors wish thanking Mr. Thierry Schweitzer for its technical help.
References
- P De March (2011) Etude électrochimique et métallographique des alliages et brasures utilisés en prothèse fixée dentaire céramo-métallique. Université Henri Poincaré Nancy I France.
- JC Wataha (2000) Biocompatibility of dental casting alloy: A review. The Journal of Prosthetic Dentistry 83: 223-234.
- JP Matinlinna, K Laajalehto, L Laiho, I Kangasniemi, LVJ Lassila, et al. (2004) Surface analysis of Co-Cr-Mo alloy and Ti substrates silanized with trialkoxysilanes and silane mixtures Surface and Interface Analysis 36(30): 246-253.
- MJ Donachie, SJ Donachie (2002) Superalloys-A Technical Guide (2nd edn), ASM International, Materials Park, USA.
- D Young (2008) High temperature oxidation and corrosion of metals Elsevier corrosion series Amsterdam.
- EF Bradley (1988) Superalloys- A Technical Guide, ASM International Metals Park.
- H Hero, M Syverud, J Gjoennes, JA Horst (1984) Ductility and structure of some cobalt-base dental casting alloys. Biomaterials 5(4): 201-208.
- RM Pilliar (2004) Porous P/M structures for orthopedic and dental implant applications. International Journal of Powder Metallurgy 40: 1927.
- L Reclaru, L Ardelean, L Rusu, C Sinescu (2012) Co-Cr material selection in prosthetic restoration: laser sintering technology. Diffusion and Defect Data Solid State Data, Pt. B: Solid State Phenomena 188: 412-415.
- M Tarcolea, V Hancu, F Miculescu, O Smatrea, C Coman, et al. (2015) A Ormenisan Research on microstructural and chemical inhomogeneity in cast metal crowns made of CoCrMoW alloy Revista de Chimie Bucharest, Romania 66(8): 1143-1146.
- A Ghiban, B Ghiban, CM Bortun, M Buzatu, Mihai Structural investigations in CoCrMo (Ti) welded dental alloys. Revista de Chimie Bucharest, Romania 65: 1314-1318.
- MG Minciuna, P Vizureanu, DC Achitei, N Ghiban, AV Sandu, NC Forna Structural characterization of some CoCrMo alloys with medical applications. Revista de Chimie Bucharest, Romania 65: 335-338.
- E Bramanti, G Cervino, F Lauritano, L Fiorillo, CD' Amico, et al. (2017) FEM and Von Mises Analysis on Prosthetic Crowns Structural Elements: Evaluation of Different Applied Materials, The Scientific World Journal.
- M Klekotka, JR Dabrowski, W Karalus Fretting (2015) corrosion of Co- Cr-Mo alloy in oral cavity environment, Solid State Phenomena 22: 455458.
- AS Corroy, P Berthod, P De March (2015) Study of a dental cobalt-base alloy used in prosthetic dentistry. Part 2: electrochemical properties Materials Science: An Indian Journal 12(11): 387-391.
- Yang, Chunguang, Wang, Shuai, Ren (2015) Ke Cast cobalt-based alloy against bacterial infection and heat treatment process there of. CN 104651669 A 20150527.
- Noh Se Ra, Noh Hak, Yoon Gye Rim, Lee Do Jae (2016) Cobalt alloys for dental casting and manufacturing dental prosthetics. KR 2016128497 A 20161108 (2016).
- Van Bennekom Andre, Hill Horst, Ripkens Oliver (2017) Use of a bio-compatible cobalt base alloy, for precipitation hardening or solidifying via mixed crystal formation, and method for the production of implants or prosthetics via material-removing machining. EP 3202427 A1 20170809.
- Yang Chunguang, Wang Shuai, Ren Ling, Yang Ke (2015) Anti-bacte- rial-infection forged cobalt-based alloy for surgical implant and its preparation method. CN 104651670 A 20150527.
- Friedrich Ronald, Mueller Manfred (1983) Solder alloy for dental use. DE 3145944 A1 19830601.
- Chiba Akihiko, Nomura Naoyuki, Shuto Bunei (2008) Iron-containing cobalt base alloy-coated composite implant materials for living bodies. JP 2008007814 A 20080117.
- Lindigkeit, Juergen (2003) Cast dental alloy. DE 10226221 C1 20031211.
- Mueller Manfred, Hirschfeld Dieter (1976) Alloy for articles with great corrosion resistance and/or severe mechanical wear and tear. DE 2511745 A1 19760923.
- Stierschneider Hubert, Kulmburg Alfred (1981) "Dental alloy” Stierschneider. EP 41938 A2 19811216.
- Weronski Andrzej (1992) Cobalt alloy for dental and surgical purposes. PL 154905 B1 19910930.
- Podesta Carlos Eduardo, Da Silva Leonaia Maria (2012) Cobalt-chro- mium and nickel-chromium alloys as biomaterials for use in dentistry, orthopedics, and theautomotive industry. BR 2010002077 A2 2012031.
- Cascone, Paul J, Prasad, Arun (2013) Method of making dental prosthesis and ductile alloys for use there in WO 2013155480 A1 20131017.
- Spohn Katja, Bossert Gerolf, Wagner Rudolf (2003) Production of a dental prosthetic from a noble metal-containing cobalt alloy WO 2003011231 A1 20030213.
- Rubakhin ML, Fedorov SI (2004) Deformable cobalt alloy for dental prosthetics. RU 2224810 C1 20040227.
- MV Popa, I Demetrescu, E Vasilescu, P Drob, D Ionescu (2003) Simulation of technical and functional characteristics of some biomaterials for dentistry. Revista de Chimie Bucharest, Romania 54: 583-587.

Top Editors
-

Mark E Smith
Bio chemistry
University of Texas Medical Branch, USA -

Lawrence A Presley
Department of Criminal Justice
Liberty University, USA -

Thomas W Miller
Department of Psychiatry
University of Kentucky, USA -

Gjumrakch Aliev
Department of Medicine
Gally International Biomedical Research & Consulting LLC, USA -

Christopher Bryant
Department of Urbanisation and Agricultural
Montreal university, USA -

Robert William Frare
Oral & Maxillofacial Pathology
New York University, USA -

Rudolph Modesto Navari
Gastroenterology and Hepatology
University of Alabama, UK -

Andrew Hague
Department of Medicine
Universities of Bradford, UK -

George Gregory Buttigieg
Maltese College of Obstetrics and Gynaecology, Europe -

Chen-Hsiung Yeh
Oncology
Circulogene Theranostics, England -
.png)
Emilio Bucio-Carrillo
Radiation Chemistry
National University of Mexico, USA -
.jpg)
Casey J Grenier
Analytical Chemistry
Wentworth Institute of Technology, USA -
Hany Atalah
Minimally Invasive Surgery
Mercer University school of Medicine, USA -

Abu-Hussein Muhamad
Pediatric Dentistry
University of Athens , Greece

The annual scholar awards from Lupine Publishers honor a selected number Read More...


