Lupine Publishers Group
Lupine Publishers
Menu
ISSN: 2637-4609
Research Article(ISSN: 2637-4609) 
Glass for Nitrogen Oxide, Formaldehyde and Hydrogen Sulfide Molecules Detection Volume 4 - Issue 4
Morsi M Morsi1*, Reham MM Morsi2, Safeya Ibrahim1 and Ammar A Labib3
- 1Glass Research Department, National Research Centre, Dokki, Giza, Egypt.
- 2Department of Physical Chemistry, National Research Centre, Dokki, Giza, P.O. 12622, Egypt
- 3Department of Inorganic Chemistry, National Research Centre, Dokki, Giza, P.O. 12622, Egypt
Received: March 06, 2020; Published: May 14, 2020
*Corresponding author: Morsi M Morsi, Department of Glass Research, National Research Centre, Egypt
DOI: 10.32474/AOICS.2020.04.000191
Abstract
Simple and cost-effective glass sensors for detecting of the hazardous pollutant gases NO2, formaldehyde and H2S molecules are qualitatively explored. Porous glass pellets based upon soda lime glass were obtained by crushing, sieving and pressing the grains below 0.075 mm with a filler of soluble salt. The pellets were sintered at 700 °C for 15 min followed by removing of the filler, then dried. The dried pellets are either treated with appropriate reagents such as universal indicator, SnCl2 or lead acetate for detecting NO2, formaldehyde or H2S molecules, respectively. In the case of treatment with universal reagent a red, brownish-red or orange coloration reveals the presence of NO2, formaldehyde or H2S molecules, respectively. Glass pellets treated with lead acetate turned into brown or blackish brown color indicating the presence of H2S gas. Pellets treated with SnCl2 show an increase in the electrical conductivity when subjected to formaldehyde gases or formaldehyde-containing solution. The increase in the electrical conductivity values is proportional to the exposure time of formaldehyde gas or the immersion time in formaldehyde-containing solution. The described method presents a simple, inexpensive and spread-able technique for detecting the NO2, formaldehyde or H2S molecules.
Keywords: Nitrogen dioxide, Formaldehyde, hydrogen disulfide, Glass sensors, Hazard compounds
Introduction
Recently, there is an increasing social sensitivity to environment and its pollution. Air is a potential source of risk where people live in urban and industrial regions. Many gases, without color and often without smell, are breathed every day at work, at home or on the road [1]. Hazardous gases can also be present in many forms such as food and drinks [2], agriculture [3], energy transportation [4] and industrial processes [5]. Attention is given to the problems related to the release of a large amount of toxin gases such as Nitrogen dioxide (NO2), induced by imperfect combustion in automobiles and industrial zones [6,7] There is a need for reliable chemical sensors able to operate in harsh industrial environments such as metallurgy, glass, ceramic, paper, automotive, aerospace and energy. To fulfill these requests, emission monitoring sensors able to detect CO, CO2, NOx (NO and NO2), hydrocarbons (HCs) and volatile organic compounds (VOCs) have been developed [7].
Formaldehyde is one of the most dominant pollutants in indoor environments, owing to a wide range of building materials and consumer products present indoors that emit formaldehyde and to a variety of chemical reactions that occur in indoor environments that generate formaldehyde [8,9]. Chronic exposure to formaldehyde is often of greatest concern in indoor environments, where concentrations may be four to ten times greater than outdoor concentrations [10]. Such exposure is associated with numerous hazardous health end points, including decreased pulmonary function, sensory and respiratory irritation, respiratory tract pathology, increased asthma incidence and increased damage to immune systems [11].
Hydrogen sulfide (H2S), which is also referred to as sewer gas [12] is a highly poisonous and flammable gas. It commonly collects in enclosed places with inadequate ventilation, such as basements manholes, and sewer lines. It usually originates from bacterial decomposition of organic matter in anaerobic environments. It can also occur in geothermal systems, where it originates from magma degassing and thermal metamorphism [13]. Moreover, H2S is produced as a by-product in more than 70 industries, including petroleum refining, Kraft paper mills, coal gasifiers, waste management, and natural gas production [14]. In low concentrations, it has the characteristic odor of rotten eggs. The odor is strongly offensive at concentrations as low as approximately 5 ppm. At concentrations above 100 ppm, the gas quickly paralyzes the olfactory nerves, and the sense of odor disappears. This can give the false impression that exposure to the gas was transient. In low concentrations (50 ppm), it is an irritant of the eyes and the entire respiratory tract. Prolonged exposure to moderate concentrations (250 ppm) causes the alveolar membranes to exude fluids that interfere with the normal exchange of gases. The principal symptom is asphyxia, which becomes apparent hours after exposure, and may lead to suffocation. Inhalation of high concentrations (1000 ppm) of H2S paralyzes the respiratory nerve center, which can lead to suffocation. Physical collapse may occur without warning [15, 16].
Gas sensors play an undeniable role in most fields of technology in the modern world; they are broadly used for public safety, pollution monitoring, quality control, breath analysis, smart homes and automobiles. Due to their low cost, high sensitivity, compact size, online detection, ease of use, portability, and low power consumption [13]. Many materials based on polymers, composites and ceramics have been tested as gas sensors due to their own features and specific operating conditions. [17] Porous glasses (PG) can be used as environmental and biological sensors in the process of removing different impurities from gases, surface and ground water [18]. They can be prepared by different methods including, phase separation process, sol–gel process and crystallized process. They are important in a large number of fields and applications [19,20]. Chemical sensors are used in domestic appliances and air quality monitoring, as well as, for the early detection of hazardous chemical agents, to provide safety and security in public places and transportation systems. Yet, despite the high demand, major advances in these sensors in terms of simple structure, lower cost, better electivity, durability and reliability are always needed [17]. The present work demonstrates a facile method for preparing porous glass with large surface area and its utilization as gas sensing materials for nitrogen dioxide, formaldehyde and hydrogen sulfide molecules.
Experimental
Preparation of base glass
A soda –lime silica glass of composition 15Na2O, 20CaO, 65SiO2 was prepared .The raw materials (chemical grade sodium carbonate (Na2CO3), calcium carbonate (CaCO3) and washed silica sand (SiO2)) were mixed and milled in an agate mortar for 10 min to homogenize the mixture, prior transferring it into a platinum crucible. Then, the mixture was melted for 2h at 1350◦C and the melt was quenched in air. The quenched glass was manually crushed in an agate mortar, sieved and the glass powder below 0.075mm was collected and used for the preparation of porous- glass pellets.
Preparation of the porous-sensing glass pellets
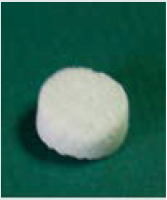
The porous glass pellets were prepared by a technique which depends on mixing inorganic soluble filler such as sodium chloride with soda lime glass powder. The mixtures were pressed and sintered at 700 °C for 15 min then the sodium chloride is removed by water dissolution, consequently the pores are formed. This method produced porous glass pellets with pores of average diameter between 5 and 300μm depending on the amount of the filler. The amounts of the filler were 0.0,12,5, 25, 50 and 75 (wt %) (Table 1), the samples obtained are given the numbers 1,2,3,4 and 5 respectively. Figure 1 shows an example for such pellets. For preparation of the sensing pellets for each hazardous chemical compound, their pellets were treated with appropriate reagent as mentioned later on in items 3.5-3.7.
Table 1: The density results of the porous glass samples. Measurements were carried out after the added NaCl was dissolved in water and dried.

Chemical durability tests
The grain test technique was used. Solutions of 0.1 M HCl and 0.1MNaOH were used as the corroding solutions at 90 °C temperature. Testing periods chosen were 2, 4, 8 and 16 hours. The surface area was calculated by the equation given by Adams et al [21]. 1g sample grains (45-60 mesh) were weighed then put in a pre-weighed sintered glass crucible of the Jena G4 type. The latter and its content were placed in plastic containers with covers, each containing 250 ml of the leaching solution such that it covers the grains and the crucible. After the intended period the content in the sintered glass crucible was washed with distilled water, followed by ether and transferred to an oven at 110°C for 2hs for drying. After cooling in a desecrator, the sintered glass crucibles were weighed and the total loss in weight was calculated.
Density measurement
The densities of samples with regular shaped pellets were determined in duplicates using50 ml stainless steel Density Cup- Pycnometer at room temperature (25 °C). The weight of the displaced liquid (distilled water) determine the volume of the sample (cm3) and the density can be calculated using the following equation: Density = wt of sample (gm) / volume of sample (cm3). Where the volume of the sample is the difference between the volume (weight) of water that fills the empty pycnometer and the volume (weight) of the added water in the pycnometer in presence of the sample.
Scanning electron microscope (SEM).
The internal morphology of the porous glasses is explored by SEM. Scanning electron microscope (SEM) of Jeol JSM 840-A was used to study the pore morphology in the internal structure. Magnifications used were in the range 50×- 250× at acceleration voltage of 10kV. Samples were fractured and covered with gold before examination.
Spectrophotometer measurements
The UV–Vis reflectance spectra of the samples were recorded for the samples using a V-530 Jasco spectrophotometer in the range 400–1100 nm using a SLM-468 specular reflectance accessory.
Electrical conductivity measurements
The a.c. method was applied to determine the electrical conductivity using LCR Hi Tester (HIOKI, 3532-50, Japan) over a frequency range from 0.042 kHz to 1 MHz and temperature range from 25 to 300 °C. The temperature was determined using a copper/Constantan thermocouple in close proximity to the sample. The dielectric constant (ε′), the loss tangent (tan δ), and the ac conductivity (σac) were determined based on the following expressions [22-24]:
ε′= C d / εo A, ε′′= ε′ tan δ, σac = ωεoε′′,
Where C = measured capacitance of the sample (F), d = thickness of the sample (m), εo= permittivity of free space equals 8.85 × 10 −12 F m −1, A = Sample surface area (m2), ω = the angular frequency, tan δ = the loss tangent which is obtained directly from the instrument.
Results and Discussion
Chemical durability
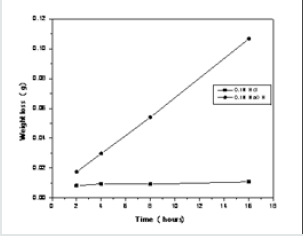
The used soda-lime silicate glass is a common type of glass. The foremost component is Silicon dioxide (SiO2), supplemented with glass modifiers like Calcium oxide (CaO), and sodium oxide (Na2O). Other common compounds in the glass include aluminum oxide (Al2O3) and magnesium oxide (MgO).The results show (Figure 2) that after 16 h at 90 °C, a glass weight loss of 1.061 g cm-2 in the alkaline solution, while in the acidic one it loses 0.106 g cm-2. The present results are in accordance with the published data [25].
When a glass probe contacts an acidic aqueous solution, the H+ ions of the medium replaces the modifier cations in the glass network, and the release of sodium, potassium and calcium is very low [26].
≡Si–O–M–O—Si≡+2H+= 2(≡ Si–O–H)+M2+, (M=Ca or Mg)
≡Si–O– R R–O—Si≡ +2H+= 2(≡ Si–O–H)+2 Na+ ,(R = Na or K
In alkaline medium breaking of Si-O-Si bond occurs as follows:
≡Si–O–Si≡ + OH- =→ ≡ Si–O–H + ≡Si–O-
This increase in the leaching of the NWF groups always
increases with time and with high rate (3).
Densities of the glass pellets
The Effect of preparation conditions on the densities of the glass pellets was studied. Samples with different content of filler prepared by the above described filling technique using (-0.075mm) grains were pressed at 5 KN and sintered at 700 °C for 15min. The sintered pellets were soaked in water to dissolve the filler. Figure 1 shows an example of such glass pellets. Table 1 shows the density values of the prepared pellets. The latter have densities in the range 1.8420 to 0.9155 (g/cm3), compared to 2.3673 g/cm3 for sample (No.1) without filling materials prepared under the same conditions. Table 1 reveals that sample No.5 with 75% filler has the lowest density which indicates presence of more pores after the removal of the filler in this sample.
SEM characteristics of the glass pellets
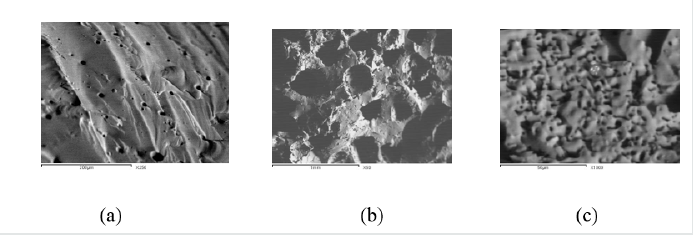
Figure 3 shows the SEM results of samples 1, 4 and 5 with filling and without filling material. The samples were prepared from (-0.075 mm) grains, pressed at 5 KN and sintered at 700 °C for 15 min. From the it can be seen that sample No.1 without fillings contains relatively few fine pores of 10-15 μm which may formed after the softening and reconnections of the glass grain boundaries. Sample No.4 with 50% fillings shows regular large pores of about 250-300 μm, while that of No 5 shows more pores of about5 μm diameter. The decreased diameters of the pores for samples with 75% filler can be assigned to the crushing of the filler at such load (5KN) which gives rise to finer filler particles.
Figure 3: SEM of samples No.1 (a) without fillings, No.4 (b) with 50% fillings and No.5 (c) with 75% fillings.
Optical characteristics of the glass pellets
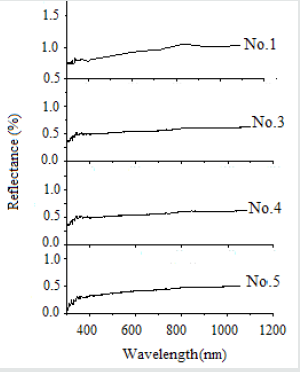
Figure 4 shows the optical reflection spectra of glass pellet samples with and without fillers. They are prepared from very fine glass powders (-0.075mm), pressed at 5KN and sintered at 700 °C.
Figure 4: The Optical reflection spectra of sample (No.1) without filler and samples Nos. 3, 4 and 5 with 25 , 50 and 75 (%) filler, respectively.
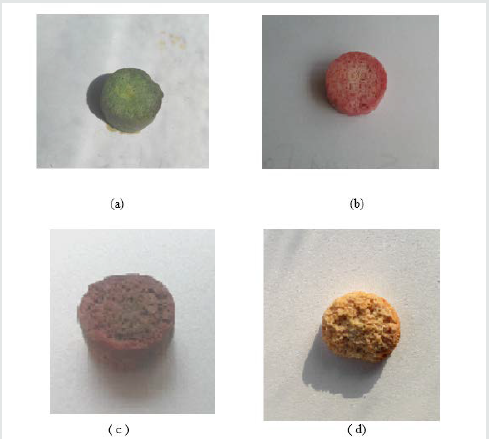
Glass pellets for NO2 detection A porous glass pellet, which was previously treated with universal indicator, was dried at room temperature. The obtained dried pellet appeared green in color (Figure 5a) and acquired red coloration upon exposure to NO2 gas for 2 Sec (Figure 5b). Nitrogen dioxide gas was evolved by reacting concentrated HNO3 with a piece of copper metal placed in a tow-neck round flask. Universal indicator is a mixture of various indicators, viz., Methyl red, methyl blue, Bromothymol blue, thymol blue and phenolphthalein. Besides these indicators, it contains water and n-propyl alcohol as solvents. They are both polar, they dissolve all the ingredients in the universal indicators [27]. NaOH is present in the mixture, which is acidic in nature, to adjust the pH of the indicator solution to give green colour at pH 7 [28].
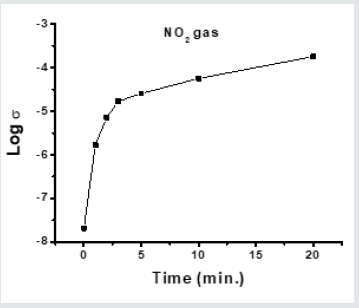
A porous glass pellet No.5 which was soaked in 5%solution of SnCl2 and dried at room temperature, was introduced into a tow-neck round flask in which NO2 gas is evolved. The glass pellet remained in the NO2 gas for 1, 2, 3, 5, 10 and 20 minutes followed by electric conduction measurements. Figure 6 shows that the change in their electrical conductivity is proportional to the time of exposure to such gas, which indicates the increase of amount of the adsorbed NO2. An abrupt increase in the electrical conductivity from 2.07 x 10⁻⁸ to 1.70 x10⁻⁵ is noticed after 3 minutes exposure and reached 1.80 x 10⁻⁴ with lower rate after 20 min.
Figure 6: Variation of the electrical conductivity of the glass pellet exposed to NO2 gas for different times. Measurements were carried out at room temperature.
Glass pellet for HCHO detection
The presence of gas formaldehyde was explored using a glass pellet that soaked in universal indicator and dried at room temperature (5a). When the pellet is subjected to the evolved formaldehyde gas the green color of the unexposed sample is change in this case into a brownish-red color (Figure 5c).
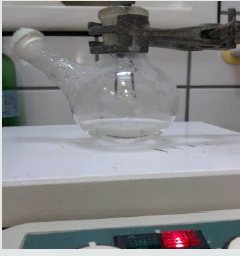
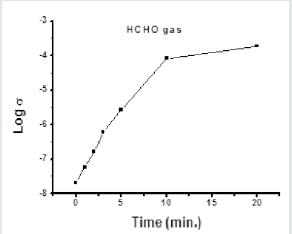
In other method, the electrical conductivity of porous glass No.5 soaked in 5%solution of SnCl2 followed by drying at room temperature was tested after its exposure to formaldehyde gas. About 100ml of liquid formaldehyde (37% lab grade) was placed in tow-neck round flask placed on a hot plate (Figure 7), the temperature of which was raised gradually until formaldehyde gas was evolved in steady state (without causing boiling of the solution). The SnCl2- treated pellet was exposed to the evolved formaldehyde gas for different times (1, 2, 3, 5, 10 and 20 minutes) and its electrical conductivity was measured after each exposure time. Figure 8 shows that increasing the time of exposure indicates presence of more adsorbed formaldehyde as the conductivity of the sample was increased from 2.07 x 10⁻⁸ Ohm-1 cm-1 which reached a value of 1.86 x 10⁻⁴ Ohm-1 cm-1 at about after 20 min.
Figure 8: Variation of the electrical conductivity of the glass pellet exposed to HCHO gas for different times. Measurements were carried out at room temperature.
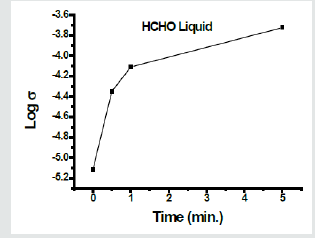
For detecting formaldehyde in aqueous solution, a glass pellet previously soaked in 5% solution of SnCl2 followed by drying at room temperature was prepared. The obtained sample was immersed in distilled water for 15 seconds then the upper surface was dried by slight contacting with a filter paper. The electrical conductivity of the wetted sample was measured at room temperature and its value is considered as the starting value for the blank sample before being in contact with the formaldehyde-containing solution. Figure 9 shows the variation of electrical conductivity of the glass pellet after immersion in 5% HCHO solution for different immersion periods of time. Measurements were carried out at room temperature. The conductivity of the sample was increased from 7.67 x 10⁻⁶ Ohm-1 cm-1 to reach a value of 1.89 x 10⁻⁴ Ohm-1 cm-1 after 5 min. This increase in conductivity reveals presence of more adsorbed formaldehyde. The higher conductivity of the blank sample that used to detect formaldehyde in solution than that used for detection of gas formaldehyde can be attributed to the presence of water in the former sample.
Figure 9: Variation of electrical conductivity of the glass pellet immersed in aqueous solution of HCHO for different periods. Measurements were carried out at room temperature.
Glass pellet sensitive to H2S
A glass pellet, previously treated with universal indicator as described above, is used to explore the detection of H2S gas which is colorless in nature. The green color of the glass pellet (Figure 5a) is changed to orange coloration upon exposure to H2S gas (Figure 5d). However, lead acetate is more sensitive than any other method for detecting H2S. It detects even traces of H2S to produces lead sulfide, a black precipitate [29]:
Pb(OAc)2(aq)+H2S(aq)→PbS(s)↓+2HOAc(aq)
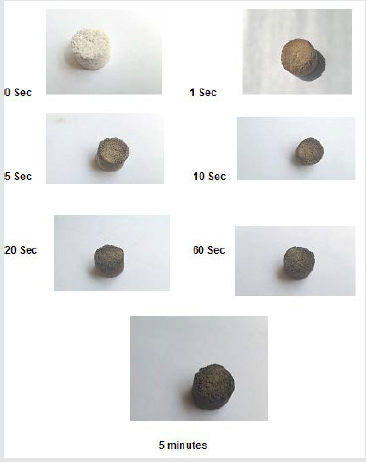
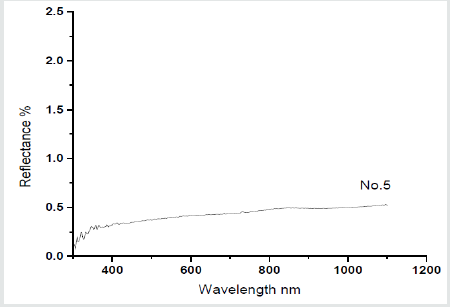
Therefore, porous glass pellets were soaked in lead acetate solution then dried to be susceptible to detect H2S gas [30]. The pellets treated with lead acetate were exposed to H2S gas for different periods of times. Figure 10 shows that increasing the time of exposure from 1 second to 5 minutes produces more dark coloration from brown, to dark brown, to blackish brown. Figure 11 shows the optical reflection spectra of glass pellet No.5 measured before and after exposure to H2S. It can be noticed that there is no reflection band in the range 300-1100 nm for the unexposed sample Figures 11a & 11b shows that after exposure of the pellet for H2S gas for10 sec, the color is changed from white into brown in color meanwhile the reflection spectrum is characterized by a broad optical absorption in the range 400-850 µm which explains the observed brown coloration.
Figure 11: The reflection spectrum of glass pellet No.5 before (a) and after exposure to H2S for 10 sec (b).
Conclusion
Porous glass based upon soda lime glass could be obtained by crushing and sieving. The grains below 0.075 mm were pressed with a filler of soluble salt into pellets which were sintered at 700 °C for 15 min followed by removing of the filler, then dried. The prepared pellets are characterized by pores of 1.5-330 μm and densities in the range 1.8420 to 0.9155 (g/cm3 ).The dried pellets treated with universal indicator, SnCl2 or lead acetate were able to detect NO2, formaldehyde or H2S molecules, respectively. Red, Brownish-red and orange coloration in case of universal reagent reveals the presence of NO2, formaldehyde and H2S molecules, respectively. Glass pellets treated with lead acetate turn into brown or blackish brown color indicating the presence of H2S gas.
Pellets treated with SnCl2 show an increase in the electrical conductivity when subjected to formaldehyde gases or formaldehyde-containing solution. The increase in the electrical conductivity values is proportional to the exposure time this gas or immersion in formaldehyde-containing solution. The described method presents a simple, inexpensive and widespread- able technique for detecting the NO2, formaldehyde or H2S molecules.
Acknowledgement
The authors wish to thank the National Research Centre, 33 E l Bohoth st. (former El Tahrir st.), Dokki, Giza, P.O. 12622, Egypt for financing the present work through research project no. E90907.
References
- Tonezzer M, ThiThanh Le D, Iannotta S , Van Hieu N (2018) Sensors & Actuators: B. Chemical 277 : 121-128.
- Vagin MY, Winquist F (2014) in: Bhunia AK, Kim MS, Taitt CR (Eds.), High Throughput Screening for Food Safety Assessment, Woodhead Publishing, Cambridge, UK, pp. 265-283.
- Donham KJ, Thelin A (2016) Agricultural Respiratory Diseases, in: Agricultural Medicine: Rural Occupational and Environmental Health, Safety, and Prevention, (2nd edn), Wiley Blackwell. pp. 95-153.
- Deng Y, Hu H, Yu B, Sun D, Hou L, et al. (2018) 342: 418-428.
- Behr CJ, Kumar A, Hancke GP (2016) al Technology (ICIT). pp. 2026-2031.
- Niyat FY, Shahrokh Abadi MH (2018) Scientific REPORTS. 8: 2149.
- Atkinson R (2000) Atmospheric environment 34: 2063-2101.
- Salthammer T, Mentese S, Marutzky R (2010) Chem Rev 110: 2536-2572.
- Carter EM, Jackson MC, Katz LE, Speitel Jr GE (2014) Journal of Exposure Science and Environmental Epidemiology 24: 305-310.
- O’Brien PJ, Siraki AG, Shangari N (2005) Crit Rev Toxicol 35: 609-662.
- S. (2010) Environmental Protection Agency. IRIS toxicological review of formaldehyde (inhalation) (External Review Draft). EPA/635/R-10/002A. Environmental Protection Agency: Washington, DC, USA.
- Pandey SK, Kim KH, Tang KT (2012) TrAC Trends Anal Chem 32: 87-99.
- Mirzaei A, SubKim S, Kim HW (2018) Journal of Hazardous Materials 357: 314-331.
- Ashori E, Nazari F, Illas F (2014) Int J Hydrogen Energy 39: 6610-6619.
- Mortezaali A, Moradi R (2014) Actuators A Phys 206: 30-34.
- Doyle BR (2001) Hazardous Gases Underground: Application to Tunnel Engineering. Marcel Dekker, Inc, USA.
- Hassan M, Afify AS , Ataalla M, Milanese D, Tulliani JM (2017) Sensors 17: 2538.
- Reisfeld R , Jasinska B , Levchenko V, Gorgol M, Saraidarov T, et al. (2016) Journal of Luminescence 169: 440-444.
- Nimjaroen C, Morimoto S, Tangsathitkulchai C (2009) J Non-Cryst Solids. 355: 1737-1741.
- Woignier T, Alaoui AH, Primera J, Phalippou J (2006) Rev Mex Fis 52. Mé
- Adams PB, Mordberg ME, Wolters HV (1964) Glass Technol 5: 136-141.
- Morsi RMM, Safeya Ibrahim, Morsi M Morsi (2017) J Mater Sci: Mater Electron 28: 9566-9574.
- Sankarappa T, Kumar MP, Devidas GB, Nagaraja N, Reddy RR (2008) J Mol Struct 889: 308-315.
- Kumar B, Vijaya T, Sankarappa M, Kumar S, Kumar PJP, et al. (2006) Phys B 404: 3487.
- Bansal NP, Doremus RH (1986) Handbook of glass properties. Elsevier Aademic Press INC, NY, USA, pp. 655.
- Popovici IC, Lupascu N (2012) Ovidius University Annals of Chemistry 23: 128-132.
- Khopkar SM (2004) Basic concepts of analytical chemistry, 2nd (edn), New Age Inter (p) Limited, Publisher, New Delhi.
- https://jameskennedymonash.wordpress.com/2014/09/15/colourful-chemistry-chemistry-of-universal-indicator/
- MacFaddin JF (Edn), (2000) Biochemical Tests for Identification of Medical Bacteria. (3rd edn), Philadelphia: Lippincott. Williams & Wilkins.
- Morsi MM, Morsi RMM, Ibrahim S, Labib AA (2018) Egyptian Patent Applied no.1762/2018 on Nov.4.

Top Editors
-

Mark E Smith
Bio chemistry
University of Texas Medical Branch, USA -

Lawrence A Presley
Department of Criminal Justice
Liberty University, USA -

Thomas W Miller
Department of Psychiatry
University of Kentucky, USA -

Gjumrakch Aliev
Department of Medicine
Gally International Biomedical Research & Consulting LLC, USA -

Christopher Bryant
Department of Urbanisation and Agricultural
Montreal university, USA -

Robert William Frare
Oral & Maxillofacial Pathology
New York University, USA -

Rudolph Modesto Navari
Gastroenterology and Hepatology
University of Alabama, UK -

Andrew Hague
Department of Medicine
Universities of Bradford, UK -

George Gregory Buttigieg
Maltese College of Obstetrics and Gynaecology, Europe -

Chen-Hsiung Yeh
Oncology
Circulogene Theranostics, England -
.png)
Emilio Bucio-Carrillo
Radiation Chemistry
National University of Mexico, USA -
.jpg)
Casey J Grenier
Analytical Chemistry
Wentworth Institute of Technology, USA -
Hany Atalah
Minimally Invasive Surgery
Mercer University school of Medicine, USA -

Abu-Hussein Muhamad
Pediatric Dentistry
University of Athens , Greece

The annual scholar awards from Lupine Publishers honor a selected number Read More...


