


Lupine Publishers Group
Lupine Publishers
ISSN: 2644-1381
Research Article(ISSN: 2644-1381) 
Seismic Nowcasting Using Shannon Information Entropy with Copula Models and Artificial Neural Networks Volume 3 - Issue 2
Received: July 21, 2020; Published: August 21, 2020
*Corresponding author: Moatafa Allameh Zadeh, IIEES, 21 Arghavan, Farmaniyeh, Tehran, Iran
DOI: 10.32474/CTBB.2020.03.000156
Abstract
Recent advances made in Nowcasting Earthquakes using clustering analysis techniques are being run by numerical simulations. In this paper, Shannon Information Entropy and Self-Organizing Maps Neural Networks (SOFM) with Copula Models are used to obtain Earthquakes cluster patterns such as doughnut patterns shapes. SOFM can involve recognizing precursory seismic patterns before a large earthquake within a specific region occurs. The observed data represent seismic activities situated around IRAN in the 1970-2014 time intervals. This technique is based on applying cluster analysis of earthquake patterns to observe and synthetic seismic catalogue with Shannon Information technique. Earthquakes are first classified into different clusters by using Shannon Information Entropy, and then, patterns are discovered before large earthquakes with Copula and SOFM simulation. The results of the experiments show that recognition rates achieved within this system are much higher than those achieved only during the feature map is used on the seismic silence and the Doughnut pattern before large earthquakes.
Introduction
Pattern recognition technique has been shown to elegantly and powerfully realize solutions to problems in Seismology and earthquake forecasting. A few applications of advanced statistical methods to seismology have been carried out. For example [1-3] have applied artificial neural networks to the explosions seismology for discriminating natural earthquakes versus explosions. The Self- Organizing Map (SONN) [1-3] is a computational mapping principle that forms an ordered nonlinear projection of high-dimensional input data items onto a low-dimensional, usually 2D regular grid. The grid points are also called nodes. The display produced onto the nodes can be regarded as a similarity graph. Consider that some distance measure d (Xi, Xj) between any kind of items Xi and Xj can be defined: pairs of items that have a small mutual distance will then be mapped onto the same or nearby nodes. On the other hand, unlike in some other projection methods such as multidimensional scaling (MDS) [4,5], larger distances between items will in general not be preserved in the SOFM projection, not even approximately. The other goal of pattern recognition in seismology is to identify earthquake prone area using Gaussian Copula. Allamehzadeh et.al. (2009) make previous applications of pattern recognition to earthquake locations in Iran and Turky, for strictly predictive purposes in central Asia and Anatolia [3]. A pattern is a suite of traits that characterizes a group of objects, such as earthquake epicenters, and distinguishes this group of objects from another group, such as places that will not be epicenters. The other methodology is developed by Allamehzadeh and Abbassi that has been applied to many seismic regions of the world for the identification of seismogenic nodes [3,6]. Recent earthquakes in each of the regions studied have proved the reliability of the results obtained. have applied artificial neural networks to reflection and refraction seismic studies. have developed an approach to earthquake prediction using neural network techniques. have applied neural networks to phase identification at three- component stations. have applied neural networks to predict the spatial distribution of the Modified Mercalli intensity for the California area. Dai and Macbeth (1995) have performed a study to test the ability of an ANN to detect and pick local seismic arrivals. In many respects the above lists summarizes the features of conventional earth science data, and are the main reasons for the increasing popularity of advanced statistical techniques such as Nowcasting in geosciences. Nowcasting refers to the use of proxy data to estimate the current dynamical state of a driven complex system such as earthquakes, neural networks, or the financial markets. In this paper, Shannon Information Entropy and SOFM are used for pattern recognition of earthquake distribution. More recently artificial neural networks have been used in other fields such as climate, oceanography, hydrology, geodesy, reliability, evolutionary computation and engineering. By using copula theory, a joint distribution can be built with a copula function and, possibly, several different marginal distributions. Shannon Information Entropy with Copula theory has been used also for modeling multivariate distributions. [7] The advantage of using copula is to model dependencies in multivariate Data. Copula functions capture the complete dependence structure. The study of copulas and their applications in statistics is a rather modern phenomenon. Copulas are of interest to statisticians for two main reasons: Firstly, as a way of studying scale-free measures of dependence; and secondly, as a starting point for statistical seismicity analysis with a view to simulation earthquake data catalogue. The word copula originates from the Latin meaning link, chain, union. In statistical literature, according to the seminal result in the copula‟s theory stated by Fermanian J-D and M. Wegkamp in 2009, a copula is a function that connects multivariate distribution function to its univariate marginal distributions. One of the primary applications of copulas is in simulation and Monte Carlo studies. In this paper, It is addressed the problem of generating earthquake catalogue from a specified joint distribution with Shannon Information Entropy. Such samples can then be used to study mathematical models of real- world earth systems. They are used as a flexible alternative to traditional methods for non- Gaussian spatial modeling and interpolation. This methodology show how it can also be predicted aftershocks distribution in a Bayesian framework by assigning priors to all model parameters. The Gaussian spatial copula model is equivalent to trans-Gaussian kriging with transformation function. A restriction of the Gaussian copula is that it models not only a symmetric but even a radially symmetric dependence, where high and low quartiles have equal dependence properties. Experimental results show that the proposed models are superior to predict and identify seismic risk at high seismicity areas is very important work to assess the seismic hazard. A novel technique based on Copulas and Self-organizing Neural Networks (SONN) methods are used for pattern recognition of earthquake distribution on the earth regions is developed and applied to observed and synthetic seismic catalogs. The synthetic data were generated by numerical simulations using Copula and SOFM methods with Shannon Information Entropy. Earthquakes arrive without previous warning and can destroy a whole city in a few seconds, causing numerous deaths and economical losses. Nowadays, a great effort is being made to develop techniques that forecast these unpredictable natural disasters by using statistical methods.
In most studies of earthquake spatial distribution prediction are
used statistical estimation ,Earthquake spatial distribution is very complex because of the depth inhomogeneity, the fractal character
of spatial pattern, and various hypocenter location errors all make
model parameterization difficult and create various biases in
estimating parameters. However, these publications insufficiently
consider the systematic effects which influenced estimation of the
fractal or scaling dimensions of earthquakes. Some of the above
publications estimated several effects by using simulation data
catalogue; such simulations are insufficient for fully understanding
various geometrical distributions.
These destructive earthquakes in the world motivate to develop
the systematic and testable assessments capable of providing
consistent information about the sites where large earthquakes
may occur. This is highly important for knowledgeable seismic
hazard evaluation. Forecasting earthquake has been faced as a
great challenge in seismology more than 100 years. Many authors
have proposed different methods to predict the occurrence of
earthquakes. The work in added five different models to the RELM.
The first one, similar to the model presented in , was based on
smoothed seismicity and predicted earthquakes with magnitude
greater or equal to 5.0. The second model is similar to the one
proposed in Shen, [8]. The third is based on fault data analysis. The
fourth model is a combination of the first three models and, finally,
the last one is based on earthquake simulations. Pattern recognition
of Earthquakes distribution and aftershocks clustering are an
important and complicated issue in seismology for investigation of
the dynamics of earthquakes sources requires the use of advanced
statistical methods.
Copula Method
The word copula was first employed in a mathematical or
statistical sense by in the theorem (which now bears his name)
describing the functions that “join together” one-dimensional
distribution functions to form multivariate distribution functions.
One of the primary applications of copulas is in simulation and
Monte Carlo studies Prokhorov. In this paper, we are used the
problem of generating a sample from a specified joint distribution.
Such samples can then be used to study mathematical models
of earthquakes systems, or for statistical seismicity, such as the
comparison of a new statistical method with competitors with
small sample results. Copulas model is applied on temporal
earthquake data catalogue that can help to forecast medium
and large earthquakes. [9] The Iranian seismic temporal data
catalogue is provided by the International Institute of Earthquake
Engineering and Seismology (IIEES). This statistical procedure is
presented showing a remarkable performance and the significance
of the obtained results in seismicity analysis.
Copulas are also useful extensions and generalizations of
approaches for modelling quantitative earthquake forecasting
and its ability to predict the earthquake occurrence rate. In this
paper the results of modeling and statistical analysis are applied to evaluate the short and long term occurrence rates of future
earthquakes regionally, to test these forecast in Alborz events in
Iran (Figure 1). [10,11] Copulas are multivariate distributions
with uniform marginal. This property combined with the inversion
theorem allows generating multivariate distributions with given
marginal distributions. The form of the dependence comes from the
choice of an appropriate copula. Therefore, the variety of different
copulas can produce different dependence structures.
Figure 1: Visualization Doughnut patterns before Mainshocks by using generalization and simulation algorithms points are forecasted large earthquakes by means of the Kohonen neural network and the same as Copula methods(by earthquakes data catalogue simulation). Circles are seismogenic nodes are obtained before large earthquakes.Space-time plot of seismicity for mb≥ 4.5 earthquakes.

The dependence between random variables is completely
described by their joint distribution. However, dependence and
marginal behaviour can be separated. A copula of a multivariate
distribution can be considered to be the part describing the
dependence structure. Although Copula presented different
parametric families, but this category of Copula is for the very
useful properties [7]. we have design a type of Gaussian spatial
copula model that its ability is to discover seismic patterns (Pattern
Recognition) such as doughnuts patterns before large earthquakes
and also can predict the trend of earthquake aftershock‟s pattern in
nonlinear systems such as earth.
In this paper, we used a copula function that links (couples) the
univariate marginal distributions to the joint distribution (Figure
2). There are a variety of procedures used to generate observations
(x,y) of a pair or random variables (X,Y) with a joint distribution
function H. We will focus on using the copula as a tool. By virtue of
Sklar‟s theorem, we need only generate a pair (u,v) of observations
of uniform (0,1) random variables (U,V) whose joint distribution
function is C, the copula of X and Y, and then transform those
uniform variates via the algorithm such as the one in the preceding
paragraph. One procedure for generating such of a pair (u,v) of
uniform (0,1) variates is the conditional distribution method
(Figure 2).
Figure 2: observations (x,y) of a pair or random variables (X,Y) with a joint distribution function H.

The main purpose and contribution of the copula function is the separation of the joint dependency and the marginal behavior. If we have a collection of copulas, then, as a consequence of Sklar‟s theorem, we automatically have a collection of bivariate or multivariate distributions with whatever marginal distributions we desire. Clearly this can be useful in modeling and simulation. Furthermore, by virtue of Theorem, the nonparametric nature of the dependence between two random variables is expressed by the copula. Thus the study of concepts and measures of nonparametric dependence is a study of properties of copulas. For this study, it is advantageous to have a variety of copulas at our disposal.
a. Simplicity making this category of Copula (simply fit the
family’s data).
b. Many families fall into this category are parametric
Copula.
c. Diversity in the extraction and analysis of different
attachment structures.
d. Desirable characteristics of each member of the family of
Copula.
Archimedean Copula makes it possible to study multivariate Copula in the form of a function to provide us suppose set of functions φ, where ϕ : [0,1]→[0,∞) and φ is strictly decreasing continuous function, convex and values at zero and infinity and zero, respectively. If ϕ −1 reverse of j has the same properties, but its value at zero and infinity, respectively, one and zero, any member of j Copula will produce Archimedean C function bivariate with margins uniform on [0,1] is derived from the following equation

In this relationship ϕ makes C. Simple example is multiplication function that named Archimedean Copula (Nelsen, 2006). If X and Y are both independent then for all amount of X and Y in the real Integer set:
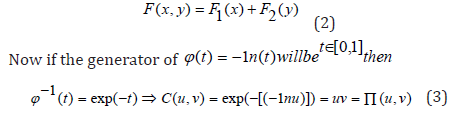
Therefore multiplication function is Archimedean Copula (Nelsen, 2006). It is generated the actual structure of dependency between statistical variables in various fields. Since the earthquake and seismic studies can be time-series statistical variables to be taken into account to determine the functional dependence between time series analysis critical communications (location of future earthquakes) and can be quite impressed with the results and analyse them place. If you have joint distribution of X1 and X2 variables, we can extract the dependence structure that lies in the distribution. In fact, with the help of conditional probabilities, marginal distributions and gain their behaviour by combining distribution. But along the distribution is often not a simple task. Copula extracts dependency structure without having to directly measure the distribution closer together for us. As stated Nelsen, Copula is important for two main reasons: (1) as a method to study the structure demographic variables and (2) as a starting point in the construction of bivariate distributions (usually to generate random numbers). The fact of the definitions Copula is also understandable. Copula and metrics based on the favorable properties to determine the association between demographic variables including time series are. To understand the importance and use of standardsbased performance measurement Copula affiliation, consider the limitations of cross-correlation criterion used in most studies. In theory, this standard only measures the linear dependence, whereas the time series of earthquake events can have a nonlinear relationship with each other. One of the disadvantages of mutual solidarity and many other metrics is that if variables X and Y are under strictly increasing conversions, this measure may not stick, in fact, if ρ is the correlation between X and Y and T show a linear increase will found: ρ (T (X ),T (Y ) ≠ ρ (X ,Y ). This restriction is highly effective in comparison dependencies. For example, if X and Y variables are measured in gram or kilogram, obtained dependence between them in the case of X or Y or both are measured on a logarithmic scale is different, because applying the logarithm (that linear and incremental function) change to dependence. This criterion is based on Copula also higher accuracy in measuring nonlinear relationships shows this ratio has good resistance to environmental factors. Since the other criteria depend on for measuring the correlation between each of their disadvantages. We have found that in this first study, the results of using magnitude information are similar to those found using only natural time counts of events. The primary reason for this is that even though large magnitude events carry more information than small magnitude events, there are many more small magnitude events at approximately the catalog completeness magnitude. Thus the information entropy at these small events dominates the total self- information sum. The Self-Organizing Map, SOFM, is a widely used tool in exploratory data analysis. A theoretical and practical challenge in the SOFM has been the difficulty to treat the method as a statistical model fitting procedure. Pattern recognition is a branch of machine learning that focuses on recognition of patterns and regularities in data. Pattern recognition systems are in many cases trained from labeled “training” data (supervised learning). However, when no labeled data are available, other algorithms can be used to discover previously unknown patterns (unsupervised learning). Kohonen Artificial Neural Network uses the SOFM algorithm for pattern recognition. The SOFM algorithm is an unsupervised-learning process. Theory of the SOFM is fairly well understood and a number of applications of it have also been developed. It defines a mapping from input data space onto an output layer by the processing units of e.g. 2-D laminar. The SOFM algorithm creates a vector quantizer by adjusting weights from common input nodes to output nodes arranged in a two-dimensional grid as shown in Figure 3. For building the Kohonen layer, two steps should be considered. First step is to initialize weight vectors of neurons in the layer properly. In second step, the weight vectors and input vectors should be normalized to a constant, fixed length usually one. Basic SOFM learning algorithm is as follows:
Figure 3: Seismotectonic map of the study in the Zagros area in Iran.

4) Updating: Adjust the synaptic weight vectors of all neurons by using the update formula as:

Where η(n) is learning-rate parameter and hj,i(x)(n) is Gaussian
topological neighborhood function centered around the winning
neuron i(x).Both η(n)and hj,i(x)(n) are varied dynamically during
learning for best results. Continuation: Continue with step 2 until
no noticeable changes in the feature map are observed. For training
the Kohonen neural network, all of the input vectors are presented.
Each input vector is compared to every weight vector associated
with every neuron, i.e. the Euclidean distance is computed. The
one feature map neuron having the weight vector with the smallest
difference to the current input is the winning neuron.
The weight of this winning neuron is now updated in the
direction of the input vector. This means if this input vector is
presented to the network for a second time, this neuron is very likely
to be the winner again, and thus represent the class (or cluster)
for this particular input vector. Clearly, similar input vectors will
be associated with the winning neurons that are close together on
the map. During training, after enough input vectors, weights will
specify cluster or vector centers that sample the input space [12].
Therefore, the point density function of the vector centers tends to
approximate probability density function of the input vectors. An
optimal mapping would be the one that matches the probability
density function best; i.e. to preserve at least the local structures of
the probability function. The feature map is a good approximation
to the input sample space.
This property is important since it provides a concentration of
representation of the given input space. The feature map naturally
forms a topologically ordered output space such that the spatial
location of a neuron in the lattice corresponds to a particular
domain in input space. The feature map embodies a statistical law.
In other words, the input with more frequent occurrence occupies
a larger output domain of the output space. This property helps to
make the SOFM an optimum codebook of the given input space.
If the input pattern is allowed to be in any unusual pattern or distribution, the Kohonen network will always generate a map of that distribution. These plots look a little like a topological map of a hilly region. Where many input vectors are clustered, the grid is similarly bunched and crowded. Where only a few input vectors are clustered, the grid is much sparser.
The straightforward way to take advantage of the above properties for prediction is to create a SOFM from the input vector, since such a feature map provides a faithful topologically organized output of the input vectors. The earthquake that occurs as a result of fault propagation has a different dynamical behavior in each tectonic region. Nowadays many types of researches have concentrated on realizing the quiddity of earthquake occurrence. Investigation of temporal variation of seismicity is an effective tool for interpretation of variation in seismic sequence. Recently, temporal properties of seismic processes have studied that can be very informative, concerning the geodynamical mechanisms underlying the presence of meaningful discipline in earthquake occurrence. The presence of temporal variations of seismicity properties show that the seismic process is cauterized in time, and the seismicity variables give quantitative information about the seismic patterns in different regions.
The statistics of the inter event (e.g. time, magnitude,...) between
successive earthquakes have recently become the center of interest.
Many studies have been done to investigate the existence of time
correlation between earthquakes [5-10]. Some of the investigators
by studying the precursors of past earthquakes believe that specific
space-time seismicity patterns can be detected. It seems that the
earthquake‟s pattern may include some information about an
upcoming large event. In this research, seismicity pattern of Zagros
fold and thrust belt is matter of interest. Zagros Mountains are NWSE
trending fold-and-thrust belt which is formed as a result of a
collision between the Arabian plate and block of Central Iranian
Miocene-Pliocene. This collision leads to shortening in the width
of the belt. The significant feature of this shortening is folding in
the surface that underlay with high angle reverse faulting in the
basement [13]. This belt is more thanc.1600 km long and is situated
between the Anatolian mountain belt in Turkey and the Strait of
Hormuz. From west to east, its width varies from c [14-20]. 200 km
to c. 350 km.
Main structures in Zagros are Main Zagros Revers Fault (MZRF),
Main Recent Fault (MRF), High Zagros Fault (HZF), Mountain Front
Fault (MFF) and the Zagros Frontal Fault (ZFF) (figure. 1.The
Zagros belt consists of two distinct parts that are North and South
Zagros. The North Zagros is separated from the South part with
north-south trending Kazerun Fault System. In the North Zagros,
deformation is divided respectively into strike-slip motion and
shortening on the Main Recent Fault and deformation front. To
the SE in the upper part of South Zagros, the strike-slip motion is
scattered on many sections of the Kazerun Fault System, and in
lower part the Zagros-Makran transition zone has been play the
main role in the seismotectonic of the region. GPS studies show that
rate of shortening in North
Zagros is about 5±3 mm a-1, whilst in South is about 9±3 mm
a-1. The Zagros basin is stratigraphically composed of two units,
basement and sedimentary cover. These units at least consist of
two important detachments in the Hormuz and Gachsaran salt
sequences in the different areas. Sedimentary cover in Zagros did
not rupture as a result of large earthquakes, Since the Phanerozoic
sedimentary cover decoupled from the Precambrian basement.
Zagros is a seismically active belt which plays an important role in
the seismotectonic of the region. Seismicity in Zagros is restricted
between two main structures, the MZRF and the ZFF (Figure 4).
Most of the earthquakes in Zagros are small but medium to large
earthquakes is also occurred. The earthquake depths in Zagros are
less than 20km.
Figure 4: Visualization Doughnut patterns before Mainshocks by using generalization and simulation algorithms points are forecasted large earthquakes by means of the Kohonen neural network and the same as Copula methods(by earthquakes data catalogue simulation). Circles are seismogenic nodes are obtained before large earthquakes. .Space-time plot of seismicity for mb≥ 4.5 earthquakes,Zagros–Makran transition zone

Coseismic surface faulting that is associated with Zagros earthquakes is rare, and the most information about active faulting comes from earthquake seismology. Last beliefs were that earthquakes occur in low-angle thrust or underlying decollement in all over the belt but studies (like Focal mechanism solutions and earthquake source parameters) show that reverse steep faults are responsible for active seismicity in this belt. Many studies have been done about the structures and seismicity in zagros fold and thrust belt but seismicity pattern in Zagros is still ambiguous. investigated spatial variation of earthquake hazard parameters in Zagros. They showed that there are various seismogenic zones like Zagros– Makran transition zone,Kazerun fault system and NW Zagros that have anomalous lowerβ-value and highest value of λ. Their data set consisted of historical and instrumental data until 2014. After that, 18th August 2014 earthquake with Mw=6.2 occurred in the Mormori region (NW Zagros) that was one of the three parts with lowerβ-value and higher λ. So, in this research these three parts have been selected as case studies to investigate temporal variation of some seismicity parameters before and after large earthquakes in the Zagros fold and thrust belt.
Examples for Visualization Earthquake Patterns
The first example region is located in NW Zagros. An important structure in this region is Mountain Front Fault with the significant seismotectonic characteristics. The MFF with more than 1350 km long is comprised of distinct segments of 15-115 km long which is located south of the Simple Folded Belt and north of the Eocene- Oligocene Asmari limestone outcrops. This fragmented structure that has known to be one of the old structures in the basement has moved as a thrust. Erosion of the uplifting mountains in the northeast of the MFF (the simple fold belt and the high Zagros) supplied debris particles in the frontal slope region of the Zagros in the southwest of MFF.
The Significant depression in the frontal slope and the Dezful Embayment besides thickening in post-Asmari sediments (Neogene Gachsaran Evaporites and the Aghajari-Bakhtiari) demonstrate relative movement of MFF relative to Dezful Embayment fault since Early Miocene [21-26]. This fault is displaced about 130 km by Balarud left-stepping shear zone in the northwest of Dezful Embayment. The largest earthquakes in this part are consists of 1) the 1977 earthquake with mb=5.6 whichoccurred at longitude of 48.08º E and latitude of 32.62º N with thrust faulting mechanism (HRVD) 2) the 18th August 2014 earthquake with mb=6which occurredat longitude of 47.64º E and latitude of 32.71º N,and followed with 5 aftershocks of Mw>5 till next 5 days (23 August) (IRSC). InSAR study has revealed the low angle thrust faulting. The activated faultis near to the Dalpari anticline (northwest –southeast trend), located within the Dezful embayment in the Lorestan province (figure.2) Focal mechanism solution (ISC, USGS and Global CMT) and fault models for the Mormori earthquake showed northeast-dipping of this fault .
Second part:
This part which is situated in the western Fars Arc hasthemain structure that is Kazerun fault system (KFS). This system includes a series of north-south, right lateral strike-slip faults that areKazerun- Borazjan, Karebas, Sabz Pushan and Sarvestan. Kazerun-Borazjanfault is the longest one in this system, have 300 km long and comprise of Dena, Kazerun and Borazjan segments. Each segment of Kazerun- Borazjan fault has 100 km length and terminates by SE-trending thrust. The KFS are seismically active faults that encountered many earthquakes through years that include1976 earthquake with mb=5.9, 1990earthquakewith mb=5.7, 1999earthquakewith mb=6.3, 2010 Kazerun earthquake with mb=6 and2013 Dashti, Bushehr,with mb=6.2. Earthquakes occur in different parts of the system particularly on Kazerun- Borazjan and Kareh Bas faults.
GPS measurements and separation of geological markers showed that fault ages of Dena and Kazerun segments are 2.8–4.5 and 2.0–2.7 Ma, respectively. The fault age of Kareh Bas faults in comparison withKazerun segments was characterized1.9–2.3 Ma. These results with respect to the strike-slip onset time of main rest fault (6–10 Ma) can indicate the propagation of right lateral strikeslip motion of this fault southeastward to the Dena, Kazerun and Karebas segments, respectively [27-34]. After determining nodes in the western Zagross by MZ method, the Kohonen self-organized neural network is used for determining the approximate location of next large earthquakes. A Kohonen neural network is used which consists of 36 neurons. Input vector to the neural network contains longitude and latitude of earthquakes with magnitude greater than 5.5 occurred in the studied region. Final weight vector of the 36 neurons (simulated points) forecast future large earthquakes (Figure 1). According to Figure 1, 36 simulated events as future earthquake with magnitude greater than 5.5 are located on the map. Among all nodes, node D1 contains highest amount of events (8large events). Therefore, node D1 is accompanied by highest potential risk. The result is expected since the node is situated on the Rudbar fault where the largest destructive earthquake of the studied region occurred (Ms~ 7.7, 20th June 1990). Node D21 containing 4 large earthquakes, is considered as next hazardous node. Seismic quiescence can be observed in middle of the Lahijan fault between D1 and D7 nodes where can be introduced as a new hazardous node. Furthermore, some trends can be considered as hazardous trends by the SOFM algorithm which show occurrence potential of large earthquakes [35-44]. D4, D3, and D6 provide transverse lineament. D1, D5, D21, D8, and D7 provide Doughnut pattern with trend of N
Conclusion
This paper introduces a new methodology to estimate the
occurrence of significant earthquake events based on Copulas
functions and SOFM neural networks for forecasting earthquakes
based on database of historic seismicity data. In order to formulate
the models, the input variables are selected among different
seismicity area between significant seismic events in Alborz region
in Iran. The resulting predictions reveal a strong correlation of
the input variables with the interevent times, thus confirming the
applicability of the proposed approach for successfully estimating
large earthquake by recognition of Doughnut patterns before
occurred. In this research Cross-validation is 95% confidence
intervals as red lines and true values as dots. The SOFM algorithm
isolates and numerically classifies seismic nonlinear patterns that
form a visually conspicuous earthquakes cluster of output values
such as Copula method in Alborz region.
The SOFM can capture underlying data patterns and provide
illustrative displays of crucial dimensions and characteristics of a
given catalog makes this algorithm a particularly important tool
when conducting any form of data catalog distinguish it from
classical multivariate statistical methodologies for earthquake
forecasting. The Copula algorithm has forecasted thirty seven
future earthquakes in west of the Alborz region. On the other hand,
SOFM can do this by twenty one seismogenic nodes are identified
around intersection of tectonic lineaments and faults in the studied
region. Seismogenic nodes prone to earthquake with M≥5.5 can be
recognized among all seismogenic nodes by considering epicenter
coordinate of the forecasted earthquakes. Seismic quiescence
concept can also be employed to recognize new earthquakeprone
areas. Hazardous trends are reconstructed by considering
seismogenic nodes and seismicity pattern. Considering historical
and instrumental earthquake catalogs with clear magnitudes,
observed that all recorded earthquakes with magnitude greater
than 7 has occurred at the hazardous trends by using Copula and
SOFM algorithms.
References
- Alexeevskaya MA, Gabrielov AM, Gvishiani AD, Gelfand IM, Rantsman E Ya (1977) Formal morphostructural zoning of mountain territories. J Geophys 43: 227- 233.
- Allamehzadeh M, M Abbassi (2008) Recognition of seismic precursory activities using Self-Organizing Feature Maps Neural Network. International Journal Diaster Advances I.
- Allamezadeh M, M Mokhtari (2003) Prediction of Aftershokcs Distribution using Self-Organizing Feature maps (SOFM) and its Application on the Birjand-Ghaen and Izmit Earthquakes. Journal of Seismology and Earthquake Engineering (JSEE) 5(3): 1-15.
- Armbruster JG, Seeber L, Jacob K (1978) The northern termination of the Himalayan mountain front: active tectonics from microearthquakes. J Geophysics Res 83: 269-282.
- Allameh Zadeh M (2011) Discrimination analysis of Earthquakes and Man-made Events Using ARMA Coefficients Determination by Artificial Neural Networks, Natural Resources Research Journal 20(4): 367-375.
- Nelsen RB (2006) An Introduction to Copulas, Springer Series in Statistics. Springer-Verlag New York, USA.
- Genest C, J Neslehova (2007) A primer on copulas for count data. Astin Bulletin 2(37): 475-515. 8
- Darsow WF, B Nguyen, ET Olsen (1992) Copulas and markov processes. Illinois Journal of Mathematics p. 642. 9
- Gorshkov Al, M Mokhtari, EP Piotrovskaya (2009) The Alborze Region: Identification of Seismogenic Nodes With Morphostructural Zoning And Pattern Recognition 11(1).
- Gorshkov A, Zhidkov M, Rantsman E, Tumarkin A (1991) Morphostructures of the Lesser Caucaus and sites of earthquakes, M ~ 5.5. Izvestyia USSR Ac Sci. Physics of the Earth 6: 30-38.
- Dowla FU, SR Taylor, Anderson R (1990) Seismic Discrimination with Artificial Neural Networks: preliminary Results with Regional spectral Data. Bull Seism Soc Am 80: 1910-1933.
- Fermanian JD, M Wegkamp (2004) Time dependent copulas. Journal of Multivariate Analysis 110: 19-29.
- Gavishiani A, Gorshkov A, Cisternas A, Rantsman E, Soloviev A (1988) Identification of earthquake-prone-areas in the regions of moderate seismicity. Nauka Moscow, Russia p. 189
- Jackson JA, DP McKenzie (1984) Active tectonics of the Alpine-Himalayan belt between western Turkey and Pakistan, Geophys JR Astron Soc 77: 185-264.
- Jones L, P Molnar (1976) Frequency of foreshocks. Nature 262: 677-1976.
- Mogi K (196) Some features of recent seismic activity in and near Japan, (1), Bull. Earthquake Res Inst Tokyo Univ 46: 1225-1236.
- Pomeroy PW, WJ Best, TV McEvilly (1982) Test ban treaty verification with regional data- a review. Bull Seism Soc Am 72: 89-129.
- Taylor SR, MD Denny, ES Vergino, RE Glaser (1989) Regional Discrimination between NTS Explosions and western U.S. Earthquakes. Bull Seism Soc Am 79: 1142-1176.
- Pulli JJ, PS Dysart (1990) An Experiment in the Use of Trained Neural Networks for Regional seismic Event Classifications. Geophys Res Lett 17: 977-980.
- Allameh Zadeh M, Hadizadeh M (1998) Discrimination between Earthquake and Nuclear explosion using SOM. Pajouheshnameh 6(4): 89-101.
- Cormier VF (1982) The Effect of Attenuation on seismic Body waves. Bull Seism Soc Am 72: S169-S200.
- Murphy JR, BW Barker, AO Donnell (1989) Network- Averaged Teleseismic p- wave spectra for Underground Explosions. part I. Definitions and Examples. Bull Seism Soc Am 89: 141-155.
- Murphy JR (1989) Network- Averaged Teleseismic p- wave spectra for underground Explosions, part II. Source characteristics of pahute mesa Explosions. Bull Seism Soc Am 79: 141-155.
- Kim WY, DW Simpson, PG Richard (1993) Discrimination of Earthquakes and Explosions in the Eastern United States Using Regional High-Frequency Data. Geophys Res Lett 20: 1507-1510.
- Lippman RP (1989) Pattern classification using neural networks. IEEE Communication Mag 27: 47-64.
- Farago A, G Lugosi(1993) Strong Universal Consistency of Neural Network classifiers. IEEE trans. Theory 39: 1146-1151.
- Vellido A, Lisboa PJG, Vaughan J (1999) Neural Networks in Business: A Survey of Applications (1992–1998), Expert Systems with Applications 17: 51–70.
- Chen YY, Young KY (2007) An SOM-based algorithm for optimization with dynamic eight updating. International Journal of Neural Systems 17(3): 171-181.
- Senouci AB, Adeli H (2001) Resource scheduling using neural dynamics model of Adeli and Park, Journal of Construction Engineering and Management. ASCE 127(1): 8-34.
- Fyfe C, Barbakh W, Ooi W C, Ko H (2008) Topological mappings of video and audio data. International Journal of Neural Systems 18(6): 481-489
- Chih Fong T, Yen Jiun Ch (2009) Earnings Management Prediction: A Pilot Study of Combining Neural Networks and Decision Trees. Journal of Expert Systems with Applications 36: 7183-7191.
- Moustra Maria, Marios Avraamides, Chris Christodoulou (2011) Artificial neural networks for earthquake prediction using time series magnitude data or Seismic Electric Signals. Expert Systems with Applications 38(12): 15032-15039.
- Alexandridis A, Chondrodima E, Efthimiou E, Papadakis G, Vallianatos F, et al. (2014) Large Earthquake Occurrence Estimation Based on Radial Basis Function Neural Geoscience and Remote Sensing IEEE Transactions 52(9): 5443-5453.
- Mahmoudi J, Rezaei M, Mohammadi MH (2015) Prediction of the Earthquake Moment Magnitude by Use of the Multilayer Perceptron Neural Network. 7th International Conference on Seismology & Earthquake Engineering.
- Mahmoudi J, Arjomand MA, Rezaei M, Mohammadi MH (2016) Predicting the Earthquake Magnitude Using the Multilayer Perceptron Neural Network with Two Hidden Layers. Civil Engineering Journal 2(1): 1-12.
- Alexander (1992) Identification of Earthquakes and Explosions Using pattern Recognition Techniques on Frequency- Slowness seismic Images. EOS 73: 360.
- Allamehzadeh M, Nassery P (1997) Seismic Discrimination Using a Fuzzy Discriminator. Pajouheshnameh, IIEES, Tehran. Iran.
- Allamehzadeh M (1999) Seismic Source Identification Using Self-Organizing Technique, 3rd International Conference on Seismology & Earthquake Engineering. Tehran, Iran.
- Haykin S (1999) Neural networks; a comprehensive foundation. 2nd
- Powell MJD (1987) Radial basis functions for multivariable interpolation: a review. In Mason JC, Cox MG (Eds.), Algorithm for Approximation. Clarendon Press, Oxford, USA.
- Broomhead DS, David Lowe (1988) Multivariable Functional Interpolation and Adaptive Networks. Complex Systems Publications Inc 2(3).
- Poggio T, Girosi F (1990) Extension of a theory of networks for approximation and learning: dimensionally reduction and clustering. In Proceeding Image Understanding Workshop, pages 597-63, Pittsburgh, Pennsylvania, USA.
- Der ZA, Less AC (1985) Methodologies for Estimating t (f) from short- period Body Waves and Regional variations of t*(f) in United states. Geophys J 82: 125-140.
- Burger RW, T Lay, LJ Burdick (1987) Average Q and yield Estimates from the pahute Mesa test site. Bull Seism Soc Am 77: 1274-1294.


-

Mark E Smith
Bio chemistry
University of Texas Medical Branch, USA -

Lawrence A Presley
Department of Criminal Justice
Liberty University, USA -

Thomas W Miller
Department of Psychiatry
University of Kentucky, USA -

Gjumrakch Aliev
Department of Medicine
Gally International Biomedical Research & Consulting LLC, USA -

Christopher Bryant
Department of Urbanisation and Agricultural
Montreal university, USA -

Robert William Frare
Oral & Maxillofacial Pathology
New York University, USA -

Rudolph Modesto Navari
Gastroenterology and Hepatology
University of Alabama, UK -

Andrew Hague
Department of Medicine
Universities of Bradford, UK -

George Gregory Buttigieg
Maltese College of Obstetrics and Gynaecology, Europe -

Chen-Hsiung Yeh
Oncology
Circulogene Theranostics, England -
.png)
Emilio Bucio-Carrillo
Radiation Chemistry
National University of Mexico, USA -
.jpg)
Casey J Grenier
Analytical Chemistry
Wentworth Institute of Technology, USA -

Hany Atalah
Minimally Invasive Surgery
Mercer University school of Medicine, USA -

Abu-Hussein Muhamad
Pediatric Dentistry
University of Athens , Greece
