


Lupine Publishers Group
Lupine Publishers
ISSN: 2644-1381
Research Article(ISSN: 2644-1381) 
Mathematical Model for the Transmission of Polio-Virus amongst Children with the Role of Vaccination and Treatment in Controlling the Outbreak and Spread of the Disease Volume 3 - Issue 5
Received: October 10, 2022 Published: October 21, 2022
*Corresponding author: S Ale, Department of Mathematic Federal University of Technology, Nigeria
DOI: 10.32474/CTBB.2022.03.000172
Abstract
In this research, a mathematical model has been proposed and analyzed for the transmission dynamics of polio virus amongst children with the role of vaccination and treatment in controlling the outbreak and spread of the disease. A threshold parameter (basic reproduction number R_0), was computed that completely determines the stability and persistence of the disease in a population. The model considered Treatment and vaccination as control measures using systems of first order ordinary differential equations. The equilibrium states were obtained and analyzed for stability relative to the basic reproduction number. The result shows that, the disease-free equilibrium was stable. The paper also revealed that the polio infection free equilibrium is locally and globally asymptotically stable if Ro < 1. The analytical solution of the model was obtained using Homotopy Perturbation Method (HPM). Numerical simulations of the model show that, the disease will be eradicated from the population with the proposed interventions of the model in due time.
Keywords: Mathematical model; transmission; polio virus; children; control; outbreak; Vaccination; Homotopy Perturbation Method
Introduction
Polio (also called Poliomyelitis) is a contagious, disabling and life-threatening disease caused by the poliovirus. The history of polio dates back about 6,000 years. Egyptian mummies have been found with withered and malformed limb that likely occurred because of polio infection [1]. Ranade and Ashish [2] talked about poliomyelitis in India. There are discoveries, also backed by a publication made by Harvard Health in 2015 recorded that polio was officially recorded in the World in the year 1789 for the first time, and in 1834, the first documented epidemic took place on the island of St. Helena. In the same publication, it was also mentioned that in 1855, Dr. Guillaume-Benjamin-Amand Duchenne showed polio involved the anterior horn cells (nerve cells) of the spinal cord. Landsteiner and Popper discovered the virus in 1908. Melnick [3] highlighted in his journal how Saturday, June 17, 1916, marked an official announcement of when the existence of polio infection that is, a known epidemic was made in Brooklyn, New York. Same year 1916, it was also registered that there were over 27,000 cases and more than 6,000 deaths due to polio in the United States (Richard Rhodes, A Hole in the world). Efforts were made to develop an Iron Lung which was developed around the late 1920s to help some polio survivors with polio breathe. The polio virus was first cultivated in tissue culture (1949), and in 1951, the three types of polioviruses were isolated and identified. The disease which is caused by poliovirus invades the nervous system and can cause total paralysis in a matter of hours. It can strike at any age but affects mainly children under 5 years of age. Human is the only natural host for poliovirus. Poliovirus is predominantly transmitted via mother and contaminated food. Statistics shows that 1 to 200 infections lead to irreversible paralysis.
Among those paralyzed, 5% to 10% will die when their breathing muscles become immobilized. As long as a single child remains infected, children in all countries are at risk of contracting polio. Failure to eradicate polio from any country could result in as many as 200 000 new cases every year, spreading all over the world within 10 years [4]. During the mid-1950’s, the first large-scale trial of the vaccine developed by Dr. Jones Salk (dead virus vaccine) was administered by injection which is the inactivated polio-virus vaccine (IPV) used in the U.S since the year 2000. In 1958, Dr Albert Sabin’s vaccine (live attenuated virus) was administered as an oral vaccine which is the Oral polio-virus vaccine (OPV) type used in Nigeria. These vital contributions made by animal research to the development of polio vaccines were not limited to the work of Albert Sabin, and include:
a) The discovery by Karl Landsteiner and Erwin Popper in 1908 that polio was caused by a virus, a discovery made by inoculating macaque monkeys with an extract of nervous tissues from polio victims that was shown to be free of other infectious agents.
b) The subsequent discovery by Simon Flexner that blood serum from Infected macaque monkeys could protect against polio infection.
c) The discovery by Carl Kling and colleagues in 1911, following an earlier discovery that polio virus could be isolated from the lymph nodes of the small intestines of monkeys, that polio virus was present in the throat and intestinal tissues of people who dies from polio (Sabin, 1995).
Paul Richard Alexander, born 1946 (age 75 years) is a lawyer, writer and paralytic polio survivor from the nearly 60,000 cases of the endemic reported in the U. S in the year 1952. He is popularly known as one of the last persons living in an iron lung after 69 years of contracting polio [5]. In 1988, the World Health Organization (WHO) launched the Global Polio Eradication initiative, which aimed to use large-scale vaccination with the oral vaccine to eradicate polio worldwide by the year 2000. Although important progress has been made, polio remains endemic in several countries. Also, the current control measures will likely be inadequate to deal with problems that may arise in the post-polio era [6]. Transmission of wild poliovirus (WPV) has never been interrupted in Afghanistan, Pakistan, and Nigeria since 2003. Infections with WPV of Nigerian origin have been detected in 25 polio free countries. In 2012, the Nigerian government created an emergency operations center and implemented a national emergency action plan to eradicate polio. The 2013 revision of the plan prioritized.
a. Improving the quality of Supplemental Immunization Activities (SIAs).
b. Implementing strategies to reach underserved populations
c. Adopting special approaches in security compromised areas
d. Improving outbreak response
e. Enhancing routine immunization and activities implemented between SIAs
f. Strengthening surveillance.
These activities were implemented during a period of unprecedented insecurity and violence, including the killing of health workers and the onset of a state of emergency in the northeast zone [7]. The purpose of this study is to investigate the effect of vaccination in controlling the transmission and spread of polio virus.
Methods
Model Formulation
This study proposes a non-linear mathematical model to study the spread and control of polio in a population system consisting of infants’ (0 -11 months) and toddlers (12-59 months) and further divide the children population at time t 0, into the classes, they are Immunized M(t); Susceptible S(t); Exposed E(t); Infected Ι(t); and the Removed children R(t). The size of the children population is given by;
N(t) = M(t) + S(t) + E(t) +Ι(t) + R(t)
Analysis of the Schematic Diagram of the Model (Basic Assumption)
The study assumed a homogenous mixing of the children population i.e. all children are equally likely to be infected by the infectious individual in the case of contact. The study assumed that only those in the infected class die from the disease at the rate (δ), and the per capita death rates for Immunized, Susceptible, Exposed, Infective and Removed individuals are; μM, μS, μE, μΙ and μR respectively. The immunized class (M) portrays the scenario in which infants’ finish their polio vaccine series before the age of 1(0 -11 months) so, they enter the immunized population by birth with rate (Λ) which is recruitment rate. The vaccination rate is represented by (Ω). The component (M) reduces due to progression of people in this class to the susceptible class as a result of the expiration of the duration of vaccine efficacy at the rate (λ). The study assumed that the susceptible class increases as fraction of unvaccinated toddlers (12-59 months) enters the population at the rate Λ (1 − Ω), we assume mass action incidence βΙS for susceptibility; we also assume that susceptible toddlers that were never exposed or infected with the virus got vaccinated and having completed all vaccination stages without a break in vaccination; becomes immune to the virus for life and thereby moving to the removed class at the rate (Ω). As polio incubation period can be as short as 4days or as long as 35days, the exposed compartment, E, takes into account the delay between the moment of the infection and the moment when an infected individual becomes infectious. The exposed population is reduced due to progression of exposed individuals to active polio infection at the rate (Ø). Then the infective class of children is reduced as a result of the successful treatment of infected polio patients at the rate (ρ) which also forms the removed class.
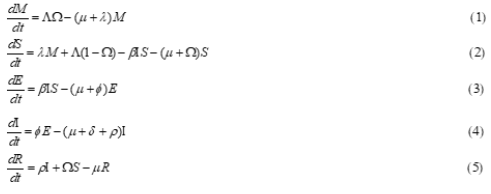
Model Equations
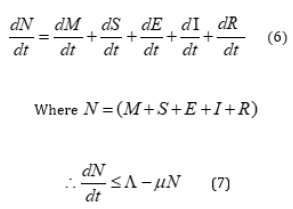
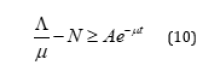
Invariant Region of the Model
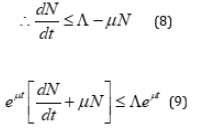
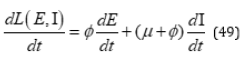
The rate of total population is given by:
Theorem 1
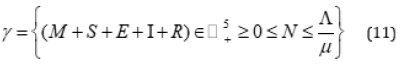
For the model to be epidemiologically meaningful, it is important to prove that its state variables are non-negative for all time(t). The system (1-5) has solutions which is contained in the feasible region for all

Proof
Let
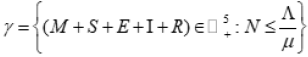
Therefore, all feasible solution of the human population of the model is in the region.
Positivity of the Solutions
Lemma 1:
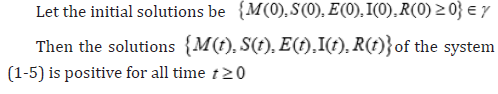
Proof
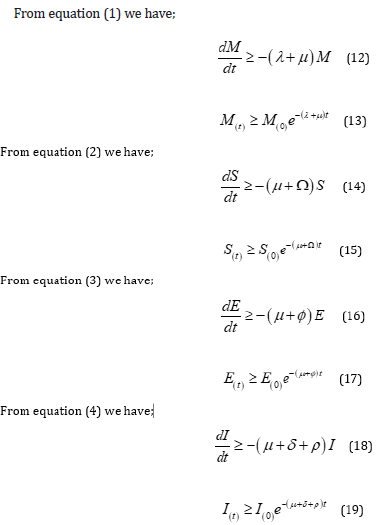
Therefore, all the solution of the equation (1 - 5) are positive for all time

The Equilibrium State of the Model
To obtain the equilibrium points for the system, we set all the system equations 1-5 to be equal to zero and then solve to get the equilibria, one being the disease-free equilibrium which is the state at which no infection is present in the population and the endemic equilibrium which is a state at which the infection persists in the population.
Disease Free Equilibrium of the Model
The disease-free equilibrium refers to the point at which the entire population is polio free.
Let

be the disease-free equilibrium points,
At the disease-free equilibrium,
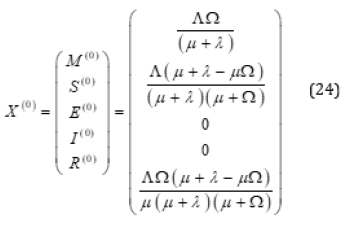
Thus, disease free equilibrium of the model is given by
Basic Reproduction Number ( R0)
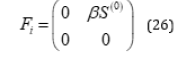
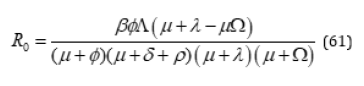
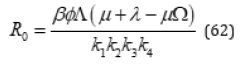
The interest of any infectious disease is the ability to infest a population. The model has a parameter known as the basic reproduction number which is the average number of new infections that one infected case will generate during her entire infection lifetime. Such that, when R0 < 1 , the DFE is locally asymptotically stable, and the disease can be monitored or controlled under certain conditions (Castillo-Chavez, 2002). The basic reproduction number (R0) is computed through the new generation matrix given as;
Where the matrix and are the infection terms and the remaining transfer terms respectively. κ is the spectral radius. From the two infectious compartments, we got the following Jacobian matrices for the infection and transmission terms;
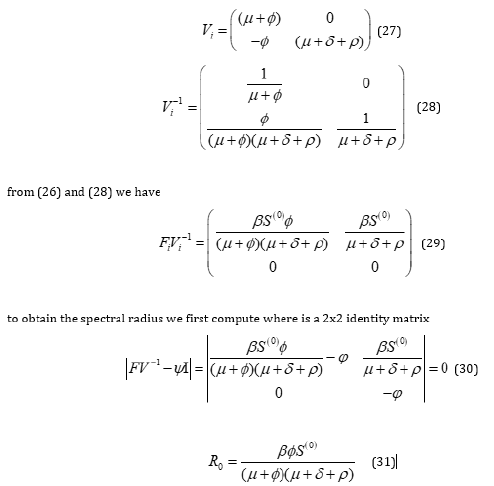
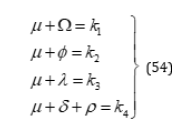
but
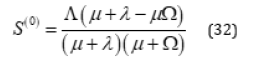
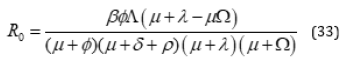
Thus, substituting (32) into (31) we obtain the basic reproduction number for the model system given as;
Local Stability of Disease-Free Equilibrium
The local dynamics of a general MSEIR model is determined by reproduction number R0 . If R0 < 1, then each infected individual in its entire period of infectiousness will produce less than one infected individual on average which implies that the disease will not persist in the population. Conversely, if R0 > 1, then each infected individual in its entire infection period having contact with susceptible individuals will produce more than one infected individual in their entire infectious period, implying that the disease persists in the population. If R0 = 1, is defined as the disease threshold, then one individual will infect one more individual (Castillo-Chavez, 2002).
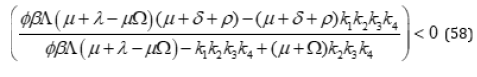
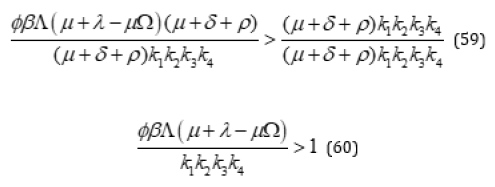
To discuss the local stability of the system (1)-(5), we compute the Jacobian matrix of system (1)-(5). The signs of the real parts of the eigenvalues of the variational matrix evaluated at a given equilibria determine its stability. If R0 < 1, then the disease-free equilibrium of the model is locally asymptotically stable and unstable if R0 > 1 .
Thus, from the Jacobian stability approach we have
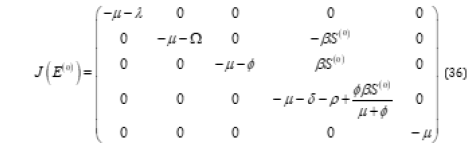
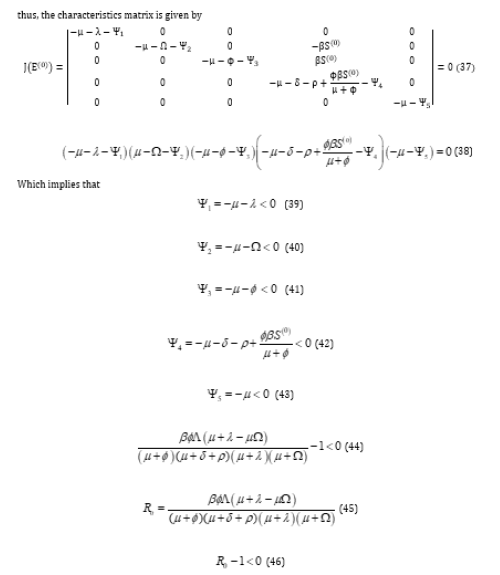
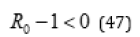
Thus, all eigenvalues of the Jacobian Matrix have negative real part if . Hence from Routh Hurwitz stability criteria we conclude that the diseases free equilibrium is locally asymptotically stable.
Global Stability of Disease-Free Equilibrium
Theorem 2: The disease-free equilibrium of the system is globally asymptotically stable on if [8].
Proof By constructing an appropriate Lyapunov function on the positive invariant compact defined by
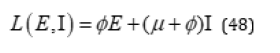
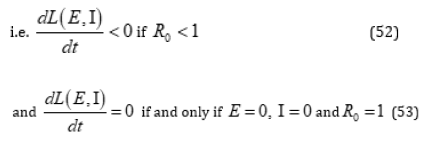
with Lyapunov derivative of equation (128) given as
which is strictly decreasing when R0<1
defining the set
Hence the Proof is complete.
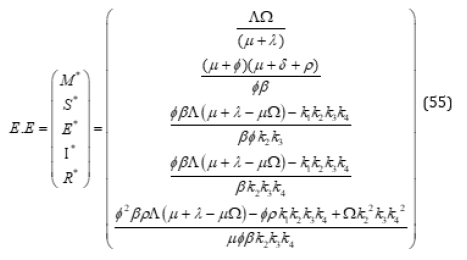
Endemic Equilibrium Points of the Model
Let;
Therefore, the endemic equilibrium points of the model are given by;
Local Stability of the Endemic Equilibrium
Theorem 3:
The endemic equilibrium state of the system (1-5) is locally asymptotically stable if.
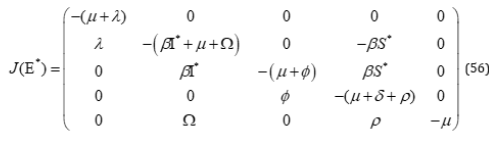
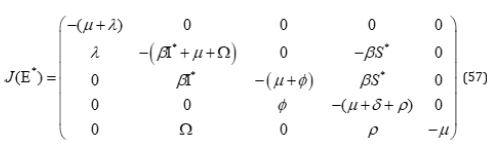
Proof
Using Jacobian stability approach, we consider the Jacobian matrix of (1-5) at endemic equilibrium points.
Reducing to upper triangular matrix,
simplifying
but
Substituting (54)
Thus,
This verifies the local stability of the endemic equilibrium for R0 > 1 . Hence, we conclude that the disease is locally asymptotically stable for the endemic equilibrium. The epidemiological implication of this is that the diseases persist in the population if R0 > 1 Table 1.
Table 1: Definition of model variables and parameters.

Results and Discussion
In this section, we presented some numerical simulation to monitor the dynamics of the full model (1)-(5) in order to have pictorial demonstration of the model dynamics using maple 18 software.
Variable Values Estimation
The values of the variables of the model were approximated based on the Nigeria demographic sketch and also on Polio epidemiology. Thus Tables 2 & 3 is a referenced and hypothetical values for the variables of the model. where the total population of the system (N) is assumed to be 31,000,000.
Table 2: Baseline values for variables of the Polio in Nigeria.

Table 3: Baseline Values for Parameters of the Polio.

Validation of Analytical Analysis
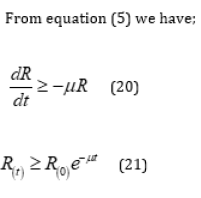
In this section some numerical simulations associated with different values of the effective reproduction number of the model were presented to further justify the analytical results. Total Number of Infected Individuals with different initial variable conditions (i.e. I(0)=100 and I(0)=1000. It could be noted that irrespective of the initial population of the infected individuals, the infected population decreases when RC < 1. Figures 1 & 2 Hence it is a validation of the stability analysis of the model. Figure 3 is the graph of exposed individuals against time for different immunity rate. It is observed that the population of Exposed individuals decreases with different values of immunity rate. The higher the immunity rate the faster the decrease in exposed population. Figure 4 is the graph of infected individuals against time for different treatment rate. It is observed that the population of Infected individuals increases with different values of treatment rate. The lower the treatment rate the higher the increase in infected population.
Total Number of Infected Individuals with different initial variable conditions (i.e., I(0)=100 and I(0)=1000. ( 2.891169) C R = . It could be noted that irrespective of the initial population of the infected individuals, Figure 5 the infected population increases when . Hence it is a validation of the stability analysis of the model.
Figure 5 the infected population increases when . Hence it is a validation of the stability analysis of the model.
Figure 1: Schematic Description of the Polio Model

Figure 2: Validation of Analytical result on Stability Analysis for The Disease-Free Equilibrium.

Figure 3: Graph of Exposed Individuals Against Time for Different Values of Immunity rate.

Figure 4: Graph of Infected Individuals Against Time for Different Values of Treatment rate.

Figure 5: Validation of Analytical result on Stability Analysis for the Endemic Equilibrium.

Conclusion and Recommendation
The findings show that, the disease-free equilibrium was stable. We were able to show that the polio infectious free equilibrium is locally and globally asymptotically stable if . The analytical solution was obtained using Homotopy Perturbation Method (HPM) and effective reproduction number was computed in order to measure the relative impact for individual or combined intervention for effective disease control. Numerical simulations of the model show that, the disease will be eradicated from the population with the proposed interventions of the model in due time. The graphs illustrate the impact of a combined effect of treatment rate and vaccination rate [9-11]. The work has shown that infected populations will be reduced when the treatment rates and their effectiveness are high. Thus, the simultaneous increase of effectiveness of vaccination rate and treatment rate are an effective control measures against polio infection. It is thereby recommended public health experts should emphasize on the improvement in early detection of polio infection cases so that transmission can be minimized and Infected individuals should be isolated and treated immediately, as this will largely help in controlling the spread of the disease.
References
- Agarwal M, Bhadauria AS (2011) Modelling Spread of Polio with the Role of Vaccination. An international Journal of Application and Applied Mathematics 6(2): 552-571.
- Ranade, Ashish S (2018) Poliomyelitis.
- Melnick J (1996) Current status of poliovirus infections, Clinical Microbiology Reviews. American Society for Microbiology 9(3): 293-300.
- WHO (2019) “Poliomyelitis”. World Health Organization, Archived from the origin on 22 July 2019.
- Charpentier M (2020) One of the Last People to Live in an Iron Long is a Longhorn. The official Publication of the Texas Exes.
- Abdulraheem IS, Saka MJ (2004) The Immune Response to Polio Virus After Natural Infection and Immunization with Oral Polio Vaccine: panoramic view of the issues and problems. Nig Med Pract 46 (3): 50-55.
- Ado MJ, Etsano A, Shuaib F, Damisa E, Mkanda P (2014) Progress Toward Poliomyelitis Eradication in Nigeria. The Journal of Infectious Diseases 210(1): 40-49.
- Ojo DD, Akinpelu FO (2017) Lyapunov Functions and Global Properties of SEIR Epidemic Model. International Journal of Chemistry, Mathematics and Physics. 2
- Castillo Chavez C, Feng Z, Huang W (2002) On the Computation of Basic Reproduction Number and its Role in Global Stability.
- Sabin H (1995) Animal Research Saves Human Lives. The Wall Street Journal.
- Statista (2021) Nigeria: reported paralytic polio cases Statista.


-

Mark E Smith
Bio chemistry
University of Texas Medical Branch, USA -

Lawrence A Presley
Department of Criminal Justice
Liberty University, USA -

Thomas W Miller
Department of Psychiatry
University of Kentucky, USA -

Gjumrakch Aliev
Department of Medicine
Gally International Biomedical Research & Consulting LLC, USA -

Christopher Bryant
Department of Urbanisation and Agricultural
Montreal university, USA -

Robert William Frare
Oral & Maxillofacial Pathology
New York University, USA -

Rudolph Modesto Navari
Gastroenterology and Hepatology
University of Alabama, UK -

Andrew Hague
Department of Medicine
Universities of Bradford, UK -

George Gregory Buttigieg
Maltese College of Obstetrics and Gynaecology, Europe -

Chen-Hsiung Yeh
Oncology
Circulogene Theranostics, England -
.png)
Emilio Bucio-Carrillo
Radiation Chemistry
National University of Mexico, USA -
.jpg)
Casey J Grenier
Analytical Chemistry
Wentworth Institute of Technology, USA -

Hany Atalah
Minimally Invasive Surgery
Mercer University school of Medicine, USA -

Abu-Hussein Muhamad
Pediatric Dentistry
University of Athens , Greece
