


Lupine Publishers Group
Lupine Publishers
ISSN: 2644-1381
Research Article(ISSN: 2644-1381) 
A Three-Way Discriminant Analysis of Ovulation Interval of Selected Women Volume 3 - Issue 3
Received: September 15, 2020; Published: September 22, 2020
*Corresponding author:Matthew Chukwuma Michael, Department of Mathematics and Statistics, Delta State Polytechnic, Ogwashi- Uku, Delta State, Nigeria
DOI: 10.32474/CTBB.2020.03.000162
Abstract
This paper aimed at discriminating between women that ovulate in shorter time than the expected twenty-eight (28) days, those that ovulate in the expected twenty-eight (28) days and those that ovulate in longer than the universally expected twentyeight (28) days. A total of two hundred (200) women in their reproductive age interval were selected for the study. Questionnaires were used to get the relevant information relating to their ovulation interval. The factors affecting ovulation considered in the study include Age, Height, Weight, Work Time (stress), Menstrual Duration, Number of Conceptions, Number of Births and Exposure to Sun. The three-way linear discriminant function was formulated for the data. Using the formulated functions, the women were classified and it was observed that the probability of misclassification into short ovulation and normal ovulation when a woman is actually in long ovulation interval is 0.9863; the probability of misclassifying a woman into short or long ovulation interval when she is actually experiencing normal ovulation is 0.3; the probability of misclassifying a woman into long or normal ovulation when she is actually experiencing short ovulation is 1.0 and the total probability of misclassification of the discriminant function is 0.715.
Keywords:Three-way; discriminant analysis; ovulation; misclassification; multivariate; probability.
Introduction
good knowledge of ovulation interval of women is imperative in preconception gender selection. Different beliefs and methods for procreation of off springs with desired sex have been adopted but recent development in research has shown that proper determination of ovulation interval has so much to contribute to the efficiency of sex determination. Discriminant Analysis has been applied to the post-mortem discrimination of Felis Catus by their sexes using skull measurements [1]. The level of fluctuation of ovulation interval in women is high and dependent on many variables. While some ovulate normally (every twenty-eight days), some experience short ovulation (not more than twenty-four days) and the other group experience long ovulation (greater than thirtytwo days). It is the objective of this paper to classify the women in the study population into their respective ovulation experience.
Methodology
The data for this study were collected from 200 selected women in Ika North-East and Ika South Local Government Areas, Delta State. The women were mainly health workers and teachers in primary and secondary schools in the selected area. Data were obtained on their age, height, weight, work time (hrs/day), menstrual duration, number of conceptions, number of births, exposure to sun and ovulation interval. The women were classified according to the length of their stated interval and the a priori probabilities for the groups were obtained. Discriminant analysis is concerned with the problem of discrimination between two or more groups and assigning a new observation into a group with low probability of misclassification [2-7]. Anderson [8] developed a method for discrimination and classification which shows that for known a priori probabilities and misclassification costs, the optimum rule is based upon the likelihood ratio of all pairs of multivariate normal populations f_i (X) and f_j (X). Then the ratio of the ith to the jth density is
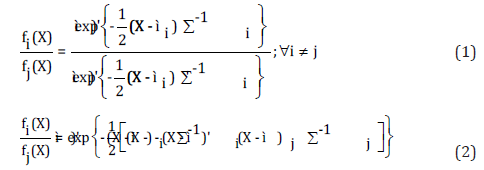
The region of classification into population, π_i is the set of X^’s for which Equation 2 is greater than k (k suitably chosen). That is,
The population parameters, μ_i, μ_j and Σ may be estimated with their respective sample estimators X ̅i, X ̅j and S where
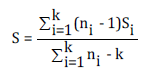 (4)
(4)is the pooled variance-covariance matrix for k groups.
For the common case of unknown parameters, the discriminant
function is
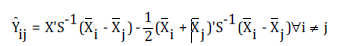 (5)
(5)The discriminant function, Y ij, for every i≠j will discriminate between two completely specified groups (populations), π_i and π_j. The classification rule now is: assign X to π_i if
 (6)
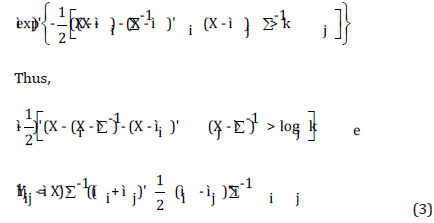
(6)But if a priori probabilities fi(X) and fj(X) are known then k is given by
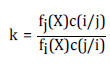 (7)
(7)as defined in Equation 1. If the two populations are equally
likely, that is, fi(X) = fj(X) ; and also the misclassification costs
being equal, that is C(i / j) = C( j / i) , this leads to k being equal
to 1. Then, logek = logek> 1 = 0. The best classification with known
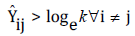
and equal a priori probabilities and misclassification cost is: assign observation with measurement X to population π_i if Yˆij > 0∀i ≠ j
; assign to π_j if otherwise. With the relations Yij = -Yij and
Y1i - Y1i = Yij , k , k populations or groups will require k-1 linearly
independent discriminant function(s) to obtain the best regions of
classification.
The discriminant procedure is evaluated with the aid of
confusion matrix. The Apparent Error Rate (AER), a measure
of the tendency that individual items are wrongly classified, is
appropriately determined as the proportion of misclassified items.
Let
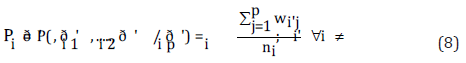
where P_i is the probability of misclassifying an item that truly
belongs to the i^th group into any of i^’ groups.
For the case of three groups
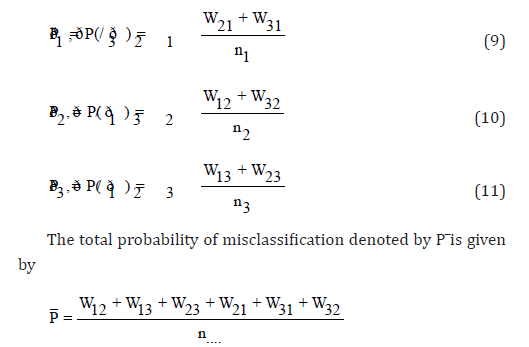
where wij is the number of items misclassified into i while they belong to j;< i ≠ j;Cij i = j are correctly classified items.
Data Analysis
x_i;i=1,2,…,9, represent Age in years, Height in meters, Weight in Kg, Work Time in hours/day, Menstrual Duration in days, Number of Conceptions, Number of births, Exposure to Sun in hours/day and x_9 is the ovulation interval in days. The average Ovulation Interval, x ̅9, is 16.06 for the 47 women experiencing short interval, 28.89 for the 80 women experiencing normal interval and 48. 95 for the 73 women experiencing long interval. The group variance-covariance matrices and the pooled variance covariance matrix were obtained. The two linearly independent discriminant functions, Y_12 and Y_13 was obtained
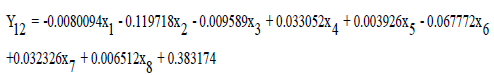
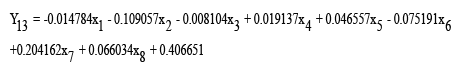
The Classification Rules: assign an individual with measurement X of unknown origin to π_1 if Y12>0.531879 and Y_13>0.440312 from Equation 6; assign the individual to π_2 if Y21>-0.531879 and Y32>0.0915672.P_3=0.9863, P_2=0.3 and P_1=1. The misclassification probabilities show that 986 out of every 100 of the women experiencing long ovulation were misclassified as experiencing short or normal ovulation; 300 out of 1000 women experiencing normal ovulation were misclassified as experiencing short or long ovulation; all the women experiencing short ovulation were misclassified as experiencing long or normal ovulation and the total probability of misclassification is 0.715 showing that 715 of the women were misclassified by the classification/discriminant function.
Conclusion
From the results of data analysis, the following conclusions may be reached: the discriminant function is associated with high probability of misclassification; there may be important variables excluded in the study and the selected women may be experiencing fluctuating ovulation intervals such that tracking a woman’s interval would require studying her experiences independently over a long period of time.
References
- Du Toit SH, Aarde RJ (1980) Sex Determination of the Feral Cat (Felis Catus) using Multivariate Analysis. South African Journal of Wildlife Research 10(2): 82-87.
- Onyeagu SI (2003) A First Course Multivariate Analysis. Mega Concept.
- Ogum GE (2002) Introduction to Methods of Multivariate Analysis. Aba Nigeria Afri Tower Limited.
- Johnson RA (1992) Applied Multivariate Statistical Analysis. New York Englewood Cliffs, USA.
- Cooley WW (1962) Multivariate Procedure for the Behavioural Sciences.Wiley and Sons Inc New York, USA.
- Lachnbruch PA (1975) Discriminant Analysis. Hafner Press New York, USA.
- Welch BL (1939) Note on Discriminant Functions. Biometrika 31(2): 218-220.
- Anderson TW (1958) An Introduction to Multivariate Analysis. John Wiley and Sons Inc New York, USA.


-

Mark E Smith
Bio chemistry
University of Texas Medical Branch, USA -

Lawrence A Presley
Department of Criminal Justice
Liberty University, USA -

Thomas W Miller
Department of Psychiatry
University of Kentucky, USA -

Gjumrakch Aliev
Department of Medicine
Gally International Biomedical Research & Consulting LLC, USA -

Christopher Bryant
Department of Urbanisation and Agricultural
Montreal university, USA -

Robert William Frare
Oral & Maxillofacial Pathology
New York University, USA -

Rudolph Modesto Navari
Gastroenterology and Hepatology
University of Alabama, UK -

Andrew Hague
Department of Medicine
Universities of Bradford, UK -

George Gregory Buttigieg
Maltese College of Obstetrics and Gynaecology, Europe -

Chen-Hsiung Yeh
Oncology
Circulogene Theranostics, England -
.png)
Emilio Bucio-Carrillo
Radiation Chemistry
National University of Mexico, USA -
.jpg)
Casey J Grenier
Analytical Chemistry
Wentworth Institute of Technology, USA -

Hany Atalah
Minimally Invasive Surgery
Mercer University school of Medicine, USA -

Abu-Hussein Muhamad
Pediatric Dentistry
University of Athens , Greece
