


Lupine Publishers Group
Lupine Publishers
ISSN: 2637-4579
Research Article(ISSN: 2637-4579) 
Corrosion Resistance of Absorbable Mg-Ca Based Alloys in Physiological Environment Volume 1 - Issue 4
Received: February 26, 2018; Published: March 07, 2018
Corresponding author: Daniel Jogaib Fernandes, Biomaterials Laboratory, Instituto Militar de Engenharia, PraÇa General Tiburcio, 80/sala 2030, Praia Vermelha, Rio de Janeiro, RJ 22290-270, Brazil, Tel: +55 21 25467080; Email: djfernandes@ime.eb.br
DOI: 10.32474/OAJBEB.2018.01.000116
Also view in:


Abstract
The objective of this work was to investigate the electrochemical behavior of Mg40Ca and Mg-Ca-Gd alloys for biomedical application as implantable absorbable devices. Electrochemical tests were performed under a physiological electrolyte of 0.9% NaCl, pH=7.4, 37°C, at a rate of 1, 0.1 and 0.01 V/s. Polarization curves showed similar mechanism of electrochemical behavior between alloys. The ternary Mg-Ca-Gd alloy showed lower values of current density and corrosion potential than Mg40Ca alloy. The Mg40Ca based binary alloy showed higher values of corrosion susceptibility and lower polarization resistance than Mg-Ca-Gd alloy. Corrosion resistance improvements were achieved in ternary Mg based alloy with Gd and Ca content. The alloy with Gd and Ca content seemed adequate electrochemical resistance to attend biomedical demand.
Keywords: Magnesium alloy; Biodegradable metals; Rare earth elements; Corrosion; Biocompatibility
Introduction
Absorbable metallic alloys have an outstanding potential for biomedical applications when their biocompatibility is adequate and its release sub products have toxicity to host tissues [1]. Although most of the biodegradable materials developed are based on polymers and ceramics, these materials have limitations regarding mechanical strength and brittleness, respectively [1]. The advantages of magnesium alloys as implantable devices for bone fracture stabilization rely on its adequate mechanical strength, toughness, and a variable elastic modulus most similar to human bone tissue. The basal slip or twinning strain from the hexagonal closed packed structure ensure improvements into mechanical strength since not all the five independent slip systems become operative at room temperature [2,3]. The potential wear debris and metal ions release toxicity expected depends on the friendly interactions of the metallic elements with human body [1]. In this perspective, magnesium has several advantages, being one of metals most committed in human metabolism, in a content just overcome by potassium element [1].
Magnesium has participation in different mechanisms reaction in human body like bone turnover process and maintenance of inorganic content of mineralized structures as teeth [1]. When associated with calcium, its potential enhances, encompassing cell membranes and intracellular organelles, systemic triggers glands and its hormones release, neural signal transduction, muscles and blood clotting [4,5]. Calcium also improves friendly behavior of magnesium in host body, as recognized by its co-factor for many enzymes and with stimulatory influence on growth of new mineralized tissues [4,5]. The performance of an absorbable alloy under physiologic environment is gambled on interactions between corrosion degradation and maintenance of its mechanical integrity [6]. In cases of device for bone fractures stabilization the degradation must occur at a range in synergism with the ability of human tissue to heal itself, otherwise failure should take over before bone fractures were consolidated [7,8].
Rare earth (RE) elements addiction is one of the strategies for control the corrosion rate dissolution of magnesium alloys under physiological environment. Besides degradation control, RE elements can also enhance mechanical and physical properties at once, allowing slower alloy deterioration, which prevent significant amounts of hydrogen evolution during corrosion process [9]. As fast as bio-absorbable magnesium alloys are degraded, higher is the possibility of painful gas pockets emergence interspersed to local tissues around implantation sites, serious local alkalization and hemolysis [4,6]. The objective of this work was to compare the corrosion resistance of Mg-Ca based alloys with and without RE alloy under simulated physiological environment.
Material and Methods
Mg-Ca-Gd alloy was produced by casting process from pure Mg (99.9%), Mg-Ca (30 wt. %) and Mg-Gd (30 wt. %) master alloys. Mg- Ca was casted from pure Mg and Ca elements. Melting process was executed in an induction crucible furnace at a melting temperature of 720oC, under a protective atmosphere of purged SF6 gas. Stirring (at 720oC) was performed for 5 minutes and molten metals were casted in cylinders ingots 80 mm in diameter. Cast ingots were annealed at 400oC for 12h and hot extruded in rods with 15 mm in diameter. For electrochemical test cylindrical samples with 1 mm in thick were prepared superficially in SiC paper up to grit of 1200 and included into a sample holder with an exposure area of 0.1257 cm2. The electrochemical test was performed using a three- electrode flat cell with physiological solution (0.9mol L-1 NaCl) as electrolyte. Corrosion cell was filled with 500 mL of electrolyte and maintained at 37°C under a pH=7.4. Saturated calomel electrode was used as reference and platinum was addressed as counter electrode, booth connected to a potentiostat (PG-3901, OMNIMETRA INSTRUMENTS). Potential dynamic measurements were acquired ± 1.5 V of the open circuit potential of each sample at scan rates of 1, 0.1 and 0.01 Vs-1.
In order to compare results, immersion corrosion tests were also carried out and mass loss was calculated. The samples were cut with close dimensions, sanded in 320 grit sandpaper, weighed in the analytical balance and they had their surface areas (initial) calculated. Each sample was placed in a conical tube with a capacity of 50 mL. Physiological solution (0.9mol L-1 NaCl) was added; the tubes were closed and placed in the oven at 36°C. Every 24 hours the samples were removed, cleaned with distilled water, weighed again and the electrolyte replaced into oven. This procedure was repeated with 48 and 72 hours of immersion. The tests were conducted in triplicate sample. The alloys had their chemical compositions determined by x-ray fluorescence spectrometry (Epsilon 3XLE, PANalytycal). Theoretical density and corrosion rates were calculated. The roughness measurement was performed by the Zygo three- dimensional rugosimeter model New View 7100 before and after the polarizations.
Results
Potentiodynamic polarization curves from Mg-40Ca and Mg- Ca-Gd alloys were shown in Figure 1. Experimental results were plotted in terms of I (current) vs. potential, being current the dependent variable when the potentiostat is initiated to overcome the free energy barrier by changes into potential intensity. Specific points considered for data acquirement included onset point, extrapolations and additional calculations Tafel constants, polarization resistance and corrosion rate. Table 1 shows the chemical composition of the alloys and theoretical densities. A density of approximately 1.80 g/cm3 was found for the MgCaGd alloy and 1.65 g/cm3 for the MgCa alloy. Both values are close to the density of pure magnesium which is 1.74 g/cm3. Open circuit potential (Table 2) of Mg-Ca and Mg-Ca-Gd alloys was -1.760 V and -1.550, respectively. OCP values identified on alloy with RE contents showed that these samples were chemically more stable than binary Mg-Ca alloy. Corrosion potential was equal to -1.715V for Mg-40Ca alloy and -1.550 V for Mg-Ca-Gd. From Tafel intersections and data calculations (Table 2), for tests conducted at the rate of 1 Vs-1, corrosion current density was measured as 4.35E-03 Acm-2 on Mg-40Ca alloy and 4.31E-03 Acm-2 was measured from Mg-Ca-Gd. Tafel constants calculated from cathodic curves revealed a gradient of pc= -0.028 Vdec-1 for Mg40Ca curve and pc= -0.033 Vdec-1 from Mg-Ca-Gd alloy. Polarization resistance was calculated as 99.928 fi/cm2 on Mg-40Ca alloy and 100.799 fi/cm2 from Mg-Ca-Gd. The corrosion rate was extrapolated as 104.637 mm year-1 from Mg- 40Ca sample and 95.620 mm year-1 from Mg-Ca-Gd.
Figure 1: Potentiodynamic polarization curves acquired at a rate of 1, 0.1 and 0.01 V/s. Samples were immersed in NaCl 0.9% solution at 37°C and pH=7.4. Electrodes were stabilized for 1 hour before data acquisition.

Table 1: Results of the chemical analyzes of the alloys and their respective calculated densities.

Table 2: Open circuit potential (OCP), corrosion current density (IcolT), corrosion potential (ECorr), Tafel coefficient at cathode (Pc), polarization resistance and corrosion rate from different samples. Rate was settled at 1, 0.1 and 0.01 V/s.

During electrochemical corrosion test with a rate of 0.1 Vs-1, the corrosion current density was measured as 3.01E-03 Acm'2 for Mg-40Ca alloy and 1.23E-03 Acm-2 for Mg-Ca-Gd. Tafel constants calculated from cathodic curves revealed a gradient of pc= -0.037 Vdec-1 for Mg-40Ca curve and pc= -0.040 Vdec-1 from Mg-Ca-Gd alloy. Polarization resistance was calculated as 144.246 fi/cm2 on Mg-40Ca alloy and 353.987 fi/cm2 from Mg-Ca-Gd. The corrosion rate was extrapolated as 72.489 mm year-1 for Mg-40Ca sample and 27.228 mm year-1 for Mg-Ca-Gd. Finally for the electrochemical corrosion test with a rate of 0.01 Vs-1, corrosion current density was measured as 6.30E-04 Acm-2 for Mg-40Ca alloy and 1.82E-03 Acm-2 was measured for Mg-Ca-Gd. Tafel constants calculated from cathodic curves revealed a gradient of pc= -0.030 Vdec-1 for Mg- 40Ca curve and pc= -0.040 Vdec-1 for Mg-Ca-Gd alloy. Polarization resistance was calculated as 238.139 fi/cm2 on Mg-40Ca alloy and 689.599 fi/cm2 for Mg-Ca-Gd. The corrosion rate was extrapolated as 43.908 mm year- 1 from Mg-40Ca sample and 13.977 mm year-1 from Mg-Ca-Gd.
Figure 2: Visual comparison of samples Mg-40Ca and Mg-Ca-Gd at 24, 48 and 72 hours of immersion in NaCl at 36°C.

Figure 2 shows the samples of the two alloys after immersion during in physiological solution at 36°C for 24 hours, 48 hours and 72 hours. In Figure 3 it is possible to compare graphically the evolution of mass loss over time. With the data obtained in the mass loss tests during immersion in physiological solution at 36°C, the corrosion rates were calculated (Table 3) and the hydrogen evolution for each alloy was estimated. The measurement of the roughness of the alloys was made by means of six different measurements of the same two parameters (Ra and PV) in three different regions of the sample. Table 4 shows the general averages and the standard deviation of these results for each parameter, all in micrometers.
Figure 3: Evolution of mass loss as a function of time.

Table 3: Corrosion rates (mm/ y) for the MgCaGd and MgCa alloys calculated from the mass loss results and their respective hydrogen evolution values (mg/ml/d).

Discussion
Comparing curves of Mg-40Ca and Mg-Ca-Gd alloys (Figure 1), differences in slopes curves can be identified and reflect straightly in Tafel constants. Despite the initial overlap of cathodic curves from alloys with RE content, as potential is raised by potentiostat, curves assumed different slopes being slower the slope of Mg- 40Ca sample than Mg-5Ca-5Gd. A more vertical anodic curve was identified on Mg-Ca alloy with Gd content which indicates that passivation film is easily formed; being also possible that passive film might be more stable than observed into Mg-40Ca during anodic reaction. The alloy with Gd addiction showed a lower value of current density and a nobler corrosion potential when compared to Mg-40Ca. Similarities into OCP value from alloys with RE content brought too little in indication of differences into chemical stability of both samples, although the sample without RE addiction and higher Ca content demonstrated the least chemical stability with the lowest OCP value (-1,760V). The influence of calcium addiction in the alloys corrosion behavior was previously discussed [5,10]. The kinetics of cathodic reaction in binary alloy with higher Ca content was faster, being the cathodic reaction more difficult into alloys with RE content.
This phenomenon had imposed a right slide of these alloy's corrosion potential toward a more positive direction. It is in line with the changes in corrosion potential and current density discussed above. The use of friendly elements as tailoring elements is justified in cases of magnesium alloys due to the positive effects in corrosion resistance. In case of Mg-Ca binary alloys, Harandi et al. [10] showed that the anodic corrosion potential increases for Ca percentual is higher than 4 wt.%. These authors stated that low percentage of calcium, not beyond 0.7 wt.%, should be recommended [10]. This information is in line with our results, where besides the influence of Gd, the least corrosion rate was observed in Mg-Ca-Gd alloy. From our perspective, the higher calcium content of binary Mg-Ca alloy should be the major reason of the higher corrosion susceptibility of this alloy when compared to the others ternary ones. Most of this susceptibility might come from the higher volume of Mg2Ca phase normally expected in binary alloys with higher calcium content.
Another two parameters showed in Table 2 are the corrosion rate (Rc) and the polarization resistance (R). Both factors need to be calculated from different equations and are referred to the rate of alloy corrosion degradation, as a consequence of current density. Polarization resistance is referred to the material refusal in allowing current passage. Rc and Rp were calculated from Tafel equation, where after rearrangements, Rc was related directly to the corrosion current through the equation:
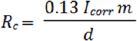
where Icorr = corrosion current density; m= equivalent weight of corroding species [11] and d=density of samples.
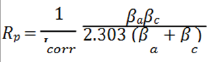
Polarization resistance (Rp) was calculated as an observance of the anodic and cathodic reactions from Tafel equations. The Tafel equation was rearranged in terms of Butler-Volmer equation for consideration of mutually influence of anodic and cathodic reactions, and then simplified to get the Stern-Geary equation [12]. The rearrangement was presented below. βa is the anodic β Tafel constant and βc is the cathodic one.
The calculated average corrosion rate related to mass loss were conducted according to technical standard ASTM G31:
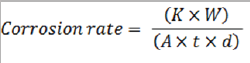
where K = a constant; W = mass loss in g; A = area in cm2; t= time of exposure in hours and d = sample corrosion density.
The results of Mg-5Ca-5Gd alloy presented lower values of corrosion rates than Mg-40Ca. This finding is coherent with the discussion above related to calcium content and the positive effects of RE elements effects into polarization resistance, since Mg- Ca- Gd showed higher polarization resistance (In all three cases) than hydrogen evolution rate (VH) with mass loss (ΔW) using:
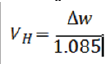
Where the results were coherent since higher is the mass loss, higher will be the hydrogen evolution.
Analyzing Table 4 It was found that the Ra mean values were close, for the two alloys. However, the standard deviation of the Mg-Ca alloy (Ra and PV) was higher indicating that there was considerable variation in the measured points. It means that the corrosion on the surface was more aggressive. This can be proved by the tridimensional images (Figure 4).
Table 4: The general averages and the standard deviation of the measurement of the roughness of the alloys.

Figure 4: Tridimensional representation of surface morphology after corrosion of Mg40Ca alloy (left) and Mg-Ca-Gd (right).

Conclusion
a) Magnesium based alloys with Ca and Gd has higher corrosion resistance than the binary alloy Mg-40Ca alloy;
b) The corrosion rate was adjusted with adequate RE elements and Ca content;
c) The most adequate results were achieved in ternary alloys with Gd and limited Ca addition.
Acknowledgement
The authors thank Prof Dexue Liu for supporting magnesium samples with Gd content, Carlos Chagas Foundation for Research Support from the Rio de Janeiro State (FAPERJ) and the National Council of Technological and Scientific Development from Brazilian Government (CNPq) for supporting this study via grants: E-26/201.759/2015, E- 26/201.828/2015, E-26/010.001.262/2015 and 168807/2017-3.
References
- Hou L, Li Z, Pan Y, Du L, Li X, et al. (2014) In vitro and in vivo studies on biodegradable magnesium alloy. Prog Nat Sci Mater Int 24(5): 466-471.
- Sandlobes S, Friak M, Neugebauer J, Raabe D (2013) Basal and non-basal dislocation slip in Mg-Y. Mater Sci Eng A 576: 61-68.
- Erturk S (2009) Thermo-mechanical Modelling and Simulation of Magnesium Alloys during Extrusion Process. Geesthacht : GKSS- Forschungszentrum Geesthacht GmbH, pp. 104.
- Staiger MP, Pietak AM, Huadmai J, Dias G (2006) Magnesium and its alloys as orthopedic biomaterials: A review. Biomaterials 27(9): 17281734.
- Bakhsheshi-Rad HR, Idris MH, Abdul-Kadir MR, Ourdjini A, Medraj M, et al. (2014) Mechanical and bio-corrosion properties of quaternary Mg- Ca-Mn-Zn alloys compared with binary Mg-Ca alloys. Mater Des 53: 283292.
- Tan L, Wang Q, Lin X, Wan P, Zhang G, et al. (2014) Loss of mechanical properties in vivo and bone-implant interface strength of AZ31B magnesium alloy screws with Si-containing coating. Acta Biomater 10(5): 2333-2340.
- Persaud-Sharma D, McGoron A (2012) Biodegradable Magnesium Alloys: A Review of Material Development and Applications. J Biomim Biomater Tissue Eng 12: 25-39.
- Niinomi M, Nakai M, Hieda J (2012) Development of new metallic alloys for biomedical applications. Acta Biomater 8(11): 3888-3903.
- Yang Z, Li JP, Zhang JX, Lorimer GW, Robson J (2008) Review on Research and Development of Magnesium Alloys. Acta Metall Sin (Engl Lett) 21(5): 313-328.
- Harandi SE, Mirshahi M, Koleini S, Idris MH, Jafari H, et al. (2013) Effect of Calcium Content on the Microstructure, Hardness and In-Vitro Corrosion Behaviour of Biodegradable Mg-Ca Binary Alloy. Mater Res 16(1): 11-18.
- ASTM B893-98 (2013) Standard Specification for Hard-Coat Anodizing of Magnesium for Engineering Applications.
- Qin F, Xie G, Dan Z, Zhu S, Seki I (2013) Corrosion behaviour and mechanical properties of MgeZneCa amorphous alloys. Intermetallics 42: 9-13.
- Song G, Atrens A, John D St (2001) An hydrogen evolution method for the estimation of the corrosion rate of magnesium alloys, (In JN Hryn (Eds), Magnesium Technology 2001 Symposium, Mineral, Metals & Materials Society). New Orleans, LA, pp. 255-262.
- Song G (2005) Recent progress in corrosion and protection of magnesium alloys. Adv Eng Mat 7(7): 563-586.
- Shi Z, Liu M, Atrens A (2010) Measurement of the corrosion rate of magnesium alloys using Tafel extrapolation. Corrosion Science 52(2): 579-588.

Editorial Manager:
Email:
biomedicalengineering@lupinepublishers.com

-

Mark E Smith
Bio chemistry
University of Texas Medical Branch, USA -

Lawrence A Presley
Department of Criminal Justice
Liberty University, USA -

Thomas W Miller
Department of Psychiatry
University of Kentucky, USA -

Gjumrakch Aliev
Department of Medicine
Gally International Biomedical Research & Consulting LLC, USA -

Christopher Bryant
Department of Urbanisation and Agricultural
Montreal university, USA -

Robert William Frare
Oral & Maxillofacial Pathology
New York University, USA -

Rudolph Modesto Navari
Gastroenterology and Hepatology
University of Alabama, UK -

Andrew Hague
Department of Medicine
Universities of Bradford, UK -

George Gregory Buttigieg
Maltese College of Obstetrics and Gynaecology, Europe -

Chen-Hsiung Yeh
Oncology
Circulogene Theranostics, England -
.png)
Emilio Bucio-Carrillo
Radiation Chemistry
National University of Mexico, USA -
.jpg)
Casey J Grenier
Analytical Chemistry
Wentworth Institute of Technology, USA -

Hany Atalah
Minimally Invasive Surgery
Mercer University school of Medicine, USA -

Abu-Hussein Muhamad
Pediatric Dentistry
University of Athens , Greece
