


Lupine Publishers Group
Lupine Publishers
ISSN: 2644-1403
Research Article(ISSN: 2644-1403) 
A Social Network Analysis of Provider Networks Leading to Opioid Initiation Among US Adults Volume 4 - Issue 2
Received:May 08, 2021; Published: May 25, 2021
Corresponding author: Bradley C Martin, PharmD, PhD, Professor, Division of Pharmaceutical Evaluation and Policy, University of Arkansas for Medical Sciences College of Pharmacy, 4301 W. Markham, slot 522 Little Rock, AR 72205, 501.603.1992 (office), USA
DOI: 10.32474/GJAPM.2021.04.000187
Abstract
Background: About 38% of U.S. adults use prescription opioids. Opioid-related overdoses have risen in the last decade. Studies suggest that duration and type of first opioid prescribed play a significant role towards risky and chronic opioid use. Objective: The primary objective was to identify key players involved with initiation of patients on opioids. This study also identified patient characteristics most likely to receive care from influential opioid providers as opioid initiation interventions could be directed to such physicians.
Design/Participants: A cohort of patients with incident opioid use were identified using Arkansas All-Payer Claims Database from 2013-2018. A social network comprising provider as nodes and referrals as edges was constructed based on healthcare utilization 180 and 90 days preceding incident opioid use for potentially non-acute and potentially acute pain patients respectively.
Main Measures: Network centrality measures such as indegree (referrals received), eigenvector (neighbor centrality), betweenness (involvement) and closeness (reach) were estimated. Outcomes included influential providers determined by network centrality measures, initial opioid providers, and patients of influential providers. Covariates included provider demographics, patient demographics and clinical characteristics. Generalized linear mixed effect models were used for statistical analyses.
Key Results: There were 150,676 incident opioid users who visited 12,629 healthcare providers. Primary care providers (PCPs) were found to have higher centralities except for betweenness. Initial opioid prescribers showed higher network centralities. More complex patients such as those with more pain conditions and higher levels of comorbidity were more likely to seek opioid providers at the periphery of the network (lower indegree and eigen centrality).
Conclusions: This study highlights the characteristics of networks leading to opioid use. Findings that PCPs have higher influence and higher influence of initial opioid prescribers can guide opioid initiation guidelines as targeted interventions. Moreover, efforts should be undertaken to direct patients requiring judicious opioid prescribing to influential providers.
Keywords: Opioids; physicians; social network analysis; centrality.
Introduction
An estimated 50 million U.S. adults suffer from chronic pain [1]. Chronic pain conditions have been responsible for increased utilization of medical care, difficulty with activities of daily living and poor health [2,3]. The increasing incidence of chronic pain and the burden associated with it has led to a rise in the use of opioids over the previous decades [1]. Measures have been undertaken to improve the ongoing opioid epidemic such as treatments for opioidrelated overdoses including expanding access to naloxone, policies mandating use of Prescription Drug Monitoring Programs (PDMPs) and uptake of prescribing guidelines reserving opioid use when benefits outweigh the risks [4-7]. Guidelines issued by the Center for Disease Control and Prevention for providers have focused to some extent on the duration, type and dose of opioids to be used when initiating a patient on opioids [8]. They recommend the use of the lowest possible dose of a particular opioid medication which should not be an extended-release or a long-acting formulation when initiating opioids to patients. Moreover, initial opioid prescriptions greater than a three-day or a seven-day period should be justified. Recent research highlights the importance of initial opioid prescriptions and their association with chronic opioid use. A study conducted using Oregon prescription data [9] found that patients who had two opioid fills were 2.25 times as likely to develop long-term opioid use. Moreover, the study found that patients receiving higher doses or initiated with long-acting opioids showed significant risk of long-term opioid use. Another study using nationwide data found the probability of long-term use to be significantly associated with the duration of the first opioid prescription, increasingly more noticeably after the fifth day of opioid use [10].
It is important for providers to follow guidelines regarding initial opioid prescribing, as misuse of opioids is associated with high-transitions to heroin use and subsequent high-overdose rates [11,12]. In addition to characterizing initial opioid prescriptions, identifying the characteristics of providers of initiating patient on opioids and the referrals leading to opioid initiation would result in better opioid management.
Previous research on reducing opioid use has mainly focused on patient-level attributes [13,14]. Incorporation of modifiable provider-level characteristics have been studied to some extent in the past [9,10]. A study by Pearson et al., also suggests that physicians tend to look to peers for advice and suggestions, reporting 40% of the surveyed physicians, especially the younger ones felt that they lacked confidence and training in prescribing opioids [15]. The need to refer to another provider who is more experienced or specializes in care generates an inherent hierarchy in a referral network of providers highlighting the role of studying the networks of physicians. Studies in the literature, backed by network centrality theories have used information from networks created using healthcare claims. They mainly constitute indegree, eigen, betweenness and closeness centrality [16-23]. Indegree centrality denotes the number of referrals received by a provider (referrals received); eigenvector centrality of a provider depends on the indegree centrality (neighbor centrality) of neighbors; betweenness centrality denotes provider involvement in paths between other providers (involvement) and closeness centrality is a measure of the reach of providers in a network (reach). Our first objective was to identify characteristics of influential providers in the network of patients leading to opioid use. Our second objective was to identify the network positions of opioid initiators. Our third objective was to characterize patients treated by influential providers.
Methods
Data Source
Claims for commercial and Medicaid insurance carriers from the Arkansas All-Payer Claims-Database, an integrated multipayer data warehouse describing the reimbursed claims for 4.8 million persons were used [24]. It comprises of the pharmacy, medical, dental, enrolment and provider information from all entities providing insurance coverage in AR except from plans not mandatorily required to submit claims.
Study Subjects
Patients
Patients with incident opioid analgesic use between July 1, 2013 and June 30, 2018, residing and seeking healthcare services in AR were identified. The date of first opioid analgesic prescription fill was used as the index date. Baseline period was the 6 months prior to the index date. All patients were required to have continuous pharmacy and medical benefits in the baseline period. Patients with malignant neoplasm, hospice or nursing care in baseline period were excluded as they could potentially warrant a different care approach. Patients with opioid use in the baseline period were also excluded. Patients were required to be between 18 and 63 years of age on the index date. (Codes used to identify exclusion criteria have been listed in Appendix Table 1)
Providers
Providers providing healthcare services in the baseline period leading to opioid initiation of patients in the study cohort were identified. Providers were then restricted to potential opioid providers (POP) as the objective was to identify providers involved in care transitioning to opioid use (Supplementary Methods 1). Provider specialties that constituted POP have been listed in (Supplementary Methods 2). All providers were required to have a service provider zip code within AR.
Referral Formation
Plurality Provider
Each patient was assigned one plurality provider based on the maximum visits by that patient. In the event of a tie, a hierarchy of PCP>Specialist>Pain>Emergency Medicine (EM)>Facility was used, based on providers most likely to coordinate patient care. For further ties the provider who saw that patient the earliest was identified as the plurality provider for that patient.
Network formation
The notion of shared patients between providers was used to define connections between two or more providers. These connections were weighted by the number of shared patients between any two providers, suggesting higher patient sharing leading to stronger connections as previously validated [25,26]. All claims meeting our referring provider ID or proxy referral algorithm in the baseline period were used. Details regarding the algorithm are described in Supplementary Methods 3. Patients with a first opioid prescription with a supply greater than or equal to 11 days or those with two initial prescriptions for an opioid analgesic with a gap of less than or equal to 7 days and total days supplied over the two prescriptions greater than or equal to 11 days were classified as potentially non-acute pain patients. For potentially non-acute pain patients the entire baseline period was used for network formation, whereas for potentially acute pain patients, 90 days prior to index opioid prescription was used for network formation to exclude any referrals that might not be related to the opioid prescription received.
Network Graphs Formation
To graphically display the referrals between providers, networks were graphically represented using GEPHI® software. The Force Atlas 2 algorithm was used after evaluation of various layout algorithms available (Fruchterman-Reingold, Kamada- Kawai, Yifan-Hu Force Atlas). Specifications of the visualization algorithm have been described in Supplementary Methods 4. Statewide network graphs containing providers and their connections were created. The graphs were difficult to interpret given the high number of providers (n=12,629) and it was decided to additionally display the graphs for two regions based on patient residence of a predominantly urban region, central (3-digit zip: 721 and 722) and a predominantly rural southeastern AR region, referred to as the delta (3-digit zip: 720, 723, 716).
Appendix Table 1: Codes Used to Identify Inclusions/Exclusions.

Outcomes
Influential Providers
The influence of providers was determined by assessing network centrality measures such as indegree (referrals received), eigen (neighbor centrality), betweenness (involvement) and closeness (reach). Network measures were defined for each provider and were computed using R (igraph) and GEPHI®. Additional details on how network measures were computed have been described in Supplementary Methods 5
Initial Opioid Providers
Providers who initiated at least one patient on an opioid were designated as initial opioid providers (IOPs). Additional details on the algorithm used to identify providers associated with opioid prescriptions are in Supplementary Methods 6.
Influential provider patient
Patients who received their opioid prescriptions from providers falling in the top 10th percentile of network characteristics were classified as influential provider patients (IPP). A sensitivity analysis was also conducted wherein providers falling in the top 25th percentile was classified as influential providers and the patients they saw IPP
Covariates
Patient covariates included age, gender, mental health (MH) conditions, number of MH conditions, pain conditions, number of pain conditions and Charlson Comorbidity Index (CCI) evaluated over baseline period. Codes for covariates are listed in Appendix Table 2 and Appendix Table 3 . Provider covariates included provider age, gender, rural urban commuting area code (RUCA) and provider region which were assigned using provider zip codes. Details on how zip codes were classified into RUCA categories are in Supplementary Methods 7. Patient mix was calculated for each provider as summary variables for patient age, gender, CCI, pain conditions and MH conditions to account for the difference in patient characteristics seen by each provider. Continuous summary measures like age and CCI were represented as means and categorical summary variables represented as percentages.
Table 2: Codes Used to Identify Mental Health Conditions.

Table 3: Codes Used to Identify Pain Conditions.

Statistical Analyses
Categorical measures are reported as frequency and percentages. Continuous measures are reported as mean ± SD. For objective 1 which included identification of influential providers, network measures were used as dependent variables and provider characteristics as independent variables and analysis was conducted at provider level. Generalized linear mixed effect regression models were used. Identity link functions were used as the dependent variable was continuous in nature. For examining the network positions of providers acting as IOP for objective 2, IOP was used as the dependent variable and network measures were used as the independent variables along with provider characteristics, patient count and patient mix as covariates. Analyses were carried out at the provider level using generalized linear mixed effect regression models. Considering the binary nature of the dependent variable, logit link was used. For assessing patient characteristics associated with patients visiting influential providers in objective 3, analysis was carried out at the patient level. The dependent variable used was IPP and the independent variables were patient characteristics (Figure 1). Analyses were carried out using generalized linear mixed effect regression models. Considering the binary nature of the dependent variable, logit link was used. All statistical tests were two sided and performed at 0.05 significance level.
Figure 1: Statewide Network Graph Depicting Initial Opioid Prescribers. IOP: Initial Opioid Provider Nodes are represented by providers and colored by provider initial opioid prescribing status (IOP); edges are represented by referrals weighted by patient volume and are colored by source node. Network represents referrals in the state of AR among patients with incident opioid use. IOPs were found to be at the center of each clusters of the network.

Results
Study Subjects
There were 1,047,779 patients with incident opioid analgesic use. After application of inclusion and exclusion criteria Table 1 150,676 patients that visited 12,629 individual providers in AR on or before their incident opioid use constituted the final study sample. Patients were predominantly middle aged to elderly and females Table 2. Commonly encountered mental health conditions were anxiety and depression in 12.76% and 11.63% patients respectively. Back/neck and joint pain were commonly encountered pain conditions in 22.57% and 20.09% patients respectively. Of the 12,629 individual providers, most were in the 35-64 age groups (67.35%) and males (61.40%) Table 3. PCPs constituted the majority provider specialty (57%) followed by specialists (29%). Providers mainly belonged to urban areas (79.33%). About 70% of the providers-initiated opioids to at least one patient in the study sample.
Table 4: Patient Attrition.

Table 5: Demographics and Clinical Characteristics of Patients.

PTSD: Post-Traumatic Stress Disorder, CCI: Charlson Comorbidity Index.
Table 6: Demographics and Prescribing Characteristics of Providers.

PCP: Primary Care Provider, RUCA: Rural Urban Commuting Area Code.
Network Characteristics
Descriptive information about the network characteristics is depicted in Table 4.
Table 7: Descriptive of Network Characteristics.

All network measures were standardized to fall between 0 and 100. Indegree, eigen and betweenness centrality were calculated using undirected and weighted networks. Closeness was calculated using directed (out closeness) and unweighted networks. Indegree reflected referrals received, eigen reflected referrals received by neighbors, betweenness reflected involvement in referrals and closeness reflected network reach.
Characteristics of Influential Providers
Adjusted analysis Table 5 showed that providers in age groups 35-49 and 50-64 had higher centralities (indegree, eigen and closeness) compared to younger providers (age: 21-34), except for betweenness centrality. Similarly, males showed higher influence in all centrality measures except for betweenness centrality compared to female providers. Specialists, pain and EM providers showed lower indegree (referrals received), eigen (neighbor centrality) and closeness (reach) compared to PCPs, however specialists were found to have higher betweenness centrality (involvement) in the network. Providers in urban regions showed higher indegree (referrals received) and eigen centrality (neighbor centrality), whereas providers in the rural regions showed higher closeness (reach) centrality. (Unadjusted analysis in Appendix Table 4.)
Table 8: Adjusted Analysis of Provider Characteristics and Influential Providers Determined by Network Influence.

CI: Confidence Interval, PCP: Primary Care Provider, RUCA: Rural Urban Commuting Area Code, OR: Odds Ratio *indicates significance at p<0.05.
Table 9: Unadjusted Analysis of Provider Demographics and Influential Providers Determined by Provider Network Characteristics.

CI: Confidence Interval, PCP: Primary Care Provider, RUCA: Rural Urban Commuting Area Code, OR: Odds Ratio *indicates significance at p<0.05
Influence of Initial Opioid Providers
Overall, adjusted analysis Table 6 showed that providers with higher centralities were found to have a higher likelihood of initiating patients on opioids. It can also be observed in network graphs (Figure 1, Appendix Figure 1, Appendix Figure 2), which clearly depict IOPs to be at the center of each of the clusters in the network. Providers with a unit increase in indegree centrality (referrals received) were more than 3 times as likely to initiate patients on opioids (OR = 3.719 (95% CI = 2.719-5.086)) compared to non-initial opioid providers. Similarly, a unit increase in eigenvector centrality and closeness centrality (reach) was associated with increased likelihood of being an initial opioid provider by 75% (OR = 1.746 (95% CI = 1.536-1.986)) and 4% (OR = *1.044 (95% CI = 1.037-1.050)) respectively. Providers having higher betweenness centrality (involvement) were more likely to initiate patients on opioids (OR = 2.563 (95% CI = 2.016-3.257)). Unadjusted analysis is reported in Appendix Table 5. There were no differences in direction of estimates when facilities were also included in the analysis. (Appendix Table 6.)
Table 10: Unadjusted Analysis of Provider Network Characteristics and Initial Opioid Providers to At Least One Patient.

CI: Confidence Interval, OR: Odds Ratio *indicates significance at p<0.05.
Figure 2: Network Graphs By Initial Opioid Prescribing And Provider Region Among Patients Of Central Region. IOP: Initial Opioid Provider Nodes are represented by providers and colored by provider initial opioid prescribing status (IOP) and provider region, edges are represented by referrals weighted by patient volume and are colored by source node. Network represents referrals in the central region of AR among patients with incident opioid use living in the central region of AR. IOPs were found to be at the center of each clusters of the network.

Figure 3: Network Graphs By Initial Opioid Prescribing And Provider Region Among Patients Of Delta Region. IOP: Initial Opioid Provider Nodes are represented by providers and colored by provider initial opioid prescribing status (IOP) and provider region, edges are represented by referrals weighted by patient volume and are colored by source node. Network represents referrals in the central region of AR among patients with incident opioid use living in the delta region of AR. IOPs were found to be at the center of each clusters of the network, and providers of central region were found to be predominantly present in networks of patients living in delta region of AR.

Table 11: Unadjusted Analysis of Patient Characteristics and Influential Provider Patients.

CI: Confidence Interval, PTSD: Post-Traumatic Stress Disorder, CCI: Charlson Comorbidity Index, OR: Odds Ratio, MH: Mental Health *indicates significance at p<0.05.
Table 12: Adjusted Analysis of Provider Network Characteristics and Initial Opioid Providers to at Least One Patient.

CI: Confidence Interval, PCP: Primary Care Provider, RUCA: Rural Urban Commuting Area Code, OR: Odds Ratio *indicates significance at p<0.05
Models also adjusted for patient mix and patient volume.
Characteristics of Patients Visiting Influential Opioid Providers
It was found that with increasing age the likelihood of patients visiting influential providers for opioid prescription in terms of indegree (referrals received), eigen (neighbor centrality) and betweenness centrality (involvement) Significantly increased Table 7. Males were at a lower likelihood of visiting influential providers. Presence of anxiety, depression and other MH conditions was associated with a higher likelihood of visiting influential providers, however the presence of PTSD or prior SUD was associated with a lower likelihood of seeing an influential provider for opioids. Patients with back/neck, headache/migraine, other pain and those with more pain conditions were at a lower likelihood of seeing influential providers in terms of indegree (referrals received) and eigen centrality (neighbor centrality). Patients with higher comorbidities were also found to visit providers with lower influence. Unadjusted analysis is depicted in Appendix Table 7. Sensitivity analysis wherein influential providers were classified as those falling in top 25th percentile is depicted in Appendix Table 8 which report similar findings.
Table 13: Adjusted Analysis of Patient Characteristics and Influential Provider Patients.

CI: Confidence Interval, PTSD: Post Traumatic Stress Disorder, CCI: Charlson Comorbidity Index, OR: Odds Ratio *indicates significance at p<0.05.
Table 14: Unadjusted Analysis Between Network Characteristics and Initial Opioid Providers Including Facilities.

CI: Confidence Interval, PCP: Primary Care Provider, RUCA: Rural Urban Commuting Area Code, OR: Odds Ratio *indicates significance at p<0.05.
Table 15: Adjusted Analysis of Patient Characteristics and Influential Provider Patients Using Top 25 Percentile as Influential Providers.

CI: Confidence Interval, PTSD: Post-Traumatic Stress Disorder, MH: Mental Health, OR: Odds Ratio *indicates significance at p<0.05.
Discussion
Our objective was to describe the network of providers that led to opioid use and determine characteristics of influential providers. The study found that middle aged, males and PCPs predominantly showed higher influence in networks of patients leading to opioid use. The fact that PCPs had higher referrals directed towards them is in line with our previous study conducted in patients using opioids. Another study which found PCPs and males in opioid prescription networks in hospitals having higher indegree (referrals received) and eigen centrality (neighbor centrality) corroborates our findings [27]. Our study also showed that providers who initiated patients on opioids were at central positions in terms of referrals received and were shown to have better reach in the network as IOPs had significantly higher indegree, eigen and closeness centralities. This finding is similar to our previous studies which show that physicians prescribing naloxone and opioids to patients with chronic pain tend to be located centrally in the network. It has also been observed that younger providers do not feel confident towards opioid prescribing and often look up to peers [15]. Although no studies have looked at centralities of opioid prescribers, there have been studies which show that providers with high centralities are early adopters of evidence-based therapies [18,28]. Our findings suggesting patients with certain pain conditions (back/neck, headache/migraine and other pain conditions), MH conditions (PTSD, SUD) and increasing comorbidities who showed lower visits to influential providers for their opioids is novel but concerning. A study previously found that Medicaid patients generally visited physicians with lower centralities, which can also be seen in our study [29].
Findings from this study may have implications in reducing patients being initiated on opioids and identify physicians which can be targeted for interventions about judicious opioid prescribing, which is especially important when initiating patients on opioids. Our results that highlight the characteristics of influential providers suggests that providers with high centralities in the network are mainly PCPs, and hence play an important role in initiating patients on opioids. Our study also suggests that providers who may benefit the most from intervention about judicious opioid initiation would be physicians who are highly involved in prescribing opioids as they were found to be influential and held central positions in the network. It is promising to observe that intervention strategies can be targeted to central physicians and hence may benefit their peers too. However, the behavior of influential physicians in terms of opioid prescribing is a matter of concern considering the current rates of opioids prescribed in the U.S. Our results highlighting characteristics of IPPs are novel and surprising. It appears that patients with higher levels of pain, mental health and other comorbidities are seeking care from providers with less influence. It may be that patients with less complex health care needs are able to get appointments with providers more centrally located in the network leaving the more complex patients seek or be referred to providers located at the periphery of the network. Interventional strategies focused on influential providers would however not benefit these more complex patients who may need judicious opioid prescribing the most.
This study is the first to highlight characteristics of providers who initiate patients on opioids and patients who visit influential providers for opioids. This study also constructed a proxy referral algorithm which can be used in future studies using claims to build referral networks. The study is subject to several limitations. First, there was no way to find out if referrals using proxy algorithm were true referrals. Though an attempt was made to obtain complete ascertainment of edges, certain edges reflective of cash prescriptions could not be obtained. Second, a cross-sectional approach rather than a dynamic approach was used. Third, the analyses are derived from AR which has above average opioid prescribing which may limit generalizability. Fourth, patient characteristics such as race, socioeconomic status, pain scores and provider characteristics such as experience and informal connections could not be captured. Fifth, individuals getting part of their care in other states could not be captured. This study highlights the characteristics of physician networks leading to opioid use. Findings such as PCPs having higher influence and reach, higher influence of initial opioid prescribers can help target opioid initiation guidelines and interventions. Moreover, efforts to direct patients who need judicious opioid prescribing to influential providers need to be undertaken.
Acknowledgement
Disclosures
Divyan Chopra was awarded a grant by the National Council of Prescription Drug Programs (NCPDP) to support this work. Bradley C. Martin receives royalties from TrestleTree LLC for the commercialization of an opioid risk prediction tool, which is unrelated to the current study. Bradley C. Martin and Chenghui LI are paid consultants for eMaxHealth Systems for unrelated projects. National Institute of General Medical Sciences of the National Institutes of Health [P20GM125503] awarded to Intawat Nookaew. Access to the All-Payer Claims Database for this study was provided by support from the Arkansas Biosciences Institute/Arkansas Insurance Department/Arkansas Center for Health Improvement Collaboration.
Supplementary Methods
Supplementary Methods 1: Provider Identification
The prescribing provider ID on the opioid analgesic pharmacy claims was used to identify the medical claim (outpatient/ inpatient/ER) which led to the opioid prescription. The medical claim associated with the opioid pharmacy claim was required to have a date of service at least 6 months prior or 14 days post the fill date of the opioid prescription. When a prescribing provider ID was not provided on the opioid pharmacy claim, the service provider on the earliest ER, inpatient or outpatient hospitalization occurring within 90 days prior to the opioid analgesic prescription was used. For opioid pharmacy claims not having a prescribing provider ID and not having an ER, inpatient or outpatient hospitalization occurring within prior 90 days, the service provider on the earliest medical claim occurring before 90 days of the opioid analgesic prescription was used. This approach enabled us to assign a prescribing provider to each opioid analgesic pharmacy claim in the outcome period of the study cohort.
Supplementary Methods 2: Provider Specialty
Taxonomy codes as described on the medical claims for patients were initially used to assign specialty for each NPI based on the premise that the specialty coded during the patient encounter was the best measure the role that provider played for that patient. When more than 1 taxonomy code was detected across all the medical claims per NPI, the maximum taxonomy code occurrence was used. If taxonomy codes were not found on the claims, standardized taxonomy codes and primary taxonomy codes in the provider table were used hierarchically. Specialist included (surgery, ENT, rheumatologists, otolaryngologists, podiatrists, psychiatrists, optometrists), PCPs (general medicine, family medicine, internal medicine, osteopathic physicians, physician assistants, nurse practitioners, preventive medicine, obstetricians/ gynecologists), pain specialists, emergency providers and facilities. For NPIs having multiple specialties a hierarchy of Pain>EM>Specialists>PCP>Facilities was used to assign specialties to NPIs. Certain providers captured in our network did not have age reported and many had unknown gender. Upon examining the provider details such as provider names we concluded that they reflected group practices or facilities. In order to prevent misclassification of facilities into individual specialties and to prevent facilities with higher patient volumes being characterized as individual providers, the analysis was restricted to individual practices for our main analyses and excluded providers in facilities. Sensitivity analyses were carried out which included these facilities.
Supplementary Methods 3: Network Formation
Shared connections among physicians were formed using paid claims occurring within the state of AR. The referring provider ID, when available on the claims was initially used to obtain true referrals in the data. For claims where the referring provider ID was missing, we designed a proxy referral algorithm based on temporality and physician specialty. All encounters excluding the first for each patient were defined as referred claims. Each referred claim was required to have only one referring claim occurring within 90 days prior to that claim (decided based on true referrals seen with referring provider ID). Referred claims with no referring claim found in the 90-day lookback period did not form a part of our referral dyad network. For others, ties between multiple referring claims for each referred claim were resolved hierarchically to Plurality provider>PCP>Specialist>Pain>EM>Facility as defined on the claim (decided based on theoretical rationale of referring patients). In case of further ties (i.e., PCP-PCP), they were resolved by the claim closest to the date of the referred claim. Using this algorithm, dyads between each referred-referring claim was formed which were called referrals. In addition to the above criteria, emergency visits as defined by place of service were not allowed to act as referred claims, but only referring claims.
Supplementary Methods 4: Network VIISUALIZATION
Force Atlas 2 was selected for our network considering memory usage and time compared to other algorithms. (Details of Force Atlas 2: Dissuade hubs: Inactive, LinLog Mode: Inactive, Prevent Overlap: Inactive, Scaling:100, Gravity:1.0, Tolerance Speed:0.1, Approximate Repulsion: Active)
Supplementary Methods 5: Network Measures
Indegree was calculated as a weighted and directed measure. It was defined as the number of referrals directed towards a physician, accounting for the number of patients to provide strength to the indegree measure. Eigen degree was calculated as a weighted and directed (in) measure. A score was assigned Betweenness was calculated as a weighted (Djikstra’s algorithm) and undirected measure. Betweenness for a physician is a measure of the ability of a physician to fall between the most efficient paths connecting any two physicians in a network. Closeness was used as an unweighted and directed (out) measure. Closeness for a physician is a measure of the reach of a physician within a network.
Degree Centrality: Degree centrality is a localized measure of a node’s structural position in a network [30]. Generally, for computation of degree centrality of a node for identification of opinion leaders, the number of edges directed towards the node are considered [31]. This highlights the relative importance of the node in terms of other nodes in the network. Since degree can be influenced by the number of nodes in a network, it is standardized by using a node’s maximum degree possible, which is equal to all other nodes connected to the node of interest [32]. The maximum degree possible can be represented as n-1 [33]. Thus, degree centrality of node i in a network can be expressed as: [33]
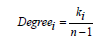
Where Degreei is the degree of node i, ki represents the number of connections to node i, n-1 represents the number of nodes in a network other than node i.
The weighted counterpart of degree centrality can be calculated by incorporating the strength of the ties used for the calculation of degree centrality which can be represented as: [34]

where kiw represents the weights on all the edges to node i.
Eigenvector Centrality: As seen with degree centrality, which does not consider the importance of the neighboring nodes in a network, eigenvector centrality accounts for that limitation. A node with high eigenvector centrality suggests that it is connected to nodes which have high degree centralities [35,36]. Similar to degree centrality, eigenvector centrality is influenced by node volume and needs to be standardized for comparison across networks and interpretation. The maximum eigenvector centrality for a node is calculated for standardization. A node can be connected to a maximum of n-1 nodes [37] . Eigenvector centrality in a network of size n is standardized by (n-1) (n-1), which equals n2-2n+1, which indicates a network wherein all nodes are connected to all nodes.
Betweenness Centrality: Betweenness centrality is defined as the presence of a node n1 between the shortest paths (geodesic) between any two nodes in the network (excluding n1) [38,39]. Betweenness centrality can be interpreted as the probability of a piece of information from node n2 to n3 to pass through node n1. Nodes with high betweenness centrality thus tend to control the flow of information across the network. Interpretation requires standardization of this measure as well, like other centrality measures. The maximum number of geodesic paths a node can be a part of is (n-1) (n-2) which equals n2-3n+2 [33]. Thus, betweenness centrality of a node i can be represented as [33]
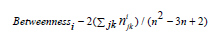
Where  represents the number of geodesic paths
between j and k (j,k≠i) passing through i, n2-3n+2 represents the
maximum number of geodesic paths in the network between any
nodes j and k which can have node i through them. For weighted
networks, a weighted geodesic is calculated by inverting the
weights of paths [18,40]. For networks of the same path length,
the path with the highest weights will have lower values and will
be assigned as the geodesic for further calculations. A weighted
geodesic can be defined as [41,42]
represents the number of geodesic paths
between j and k (j,k≠i) passing through i, n2-3n+2 represents the
maximum number of geodesic paths in the network between any
nodes j and k which can have node i through them. For weighted
networks, a weighted geodesic is calculated by inverting the
weights of paths [18,40]. For networks of the same path length,
the path with the highest weights will have lower values and will
be assigned as the geodesic for further calculations. A weighted
geodesic can be defined as [41,42]

where gxz is the geodesic distance between nodes x and z, wxy is the weight between the path from x to y, wyz is the weight of path between nodes y and z.
Closeness Centrality: Closeness centrality is the sum of the shortest path (geodesic) from a node to all other nodes within a network [43]. Closeness centrality can be interpreted as information that originates at node n1 with high closeness centrality would reach any node n5 faster compared to if the information originated at n2 having lower closeness centrality compared to n1. Compared to other centrality measures, in closeness centrality, a high value means less important; hence, closeness centrality is inverted. Closeness centrality, like all other centrality measures, would be influenced by the number of nodes in the network. Hence, a standardized measure is obtained by dividing by the minimum possible value of closeness centrality [44-46]. Thus, if a node is connected to all other nodes within a step (star network), the sum of the paths from that node to all other nodes would be n-1. (Because a self-connection is not counted, connecting n-1 nodes directly with a path length of 1 would give the sum as 1*(n-1) = n-1).[37] Thus, closeness centrality for an undirected network is represented as [37]

Where closenessi represents closeness centrality of node i,
 represents geodesic between nodes j and k (j,k ≠ i) and n-1
represents the minimum distance from node n to all other nodes
in case of a star-shaped network. Similar to weighted betweenness
centrality, weighted inverse geodesic distance is calculated using
the weighted distance from one node to all other nodes in a
network. Weighted closeness centrality representing the inverse of
the average weighted distance from node i to all other nodes can be
represented as:[41]
represents geodesic between nodes j and k (j,k ≠ i) and n-1
represents the minimum distance from node n to all other nodes
in case of a star-shaped network. Similar to weighted betweenness
centrality, weighted inverse geodesic distance is calculated using
the weighted distance from one node to all other nodes in a
network. Weighted closeness centrality representing the inverse of
the average weighted distance from node i to all other nodes can be
represented as:[41]

Where  represents the weighted geodesic distance from
node i.
represents the weighted geodesic distance from
node i.
Supplementary Methods 6: IOP
In order to identify IOPs, the prescribing provider ID on the pharmacy claims was used to determine the outpatient/inpatient/ ER visit which led to the opioid prescription as long as it was 6 months prior to the prescription date. When a prescribing provider ID was not provided on the opioid pharmacy claim the earliest ER, inpatient or outpatient hospitalization occurring within 90 days prior to the opioid prescription was used. For claims not meeting the previous criteria, the earliest medical claim occurring before 90 days of the opioid prescription was used.
Supplementary Methods 7: RUCA
The classification was as follows: urban (1.0, 1.1, 2.0, 2.1, 3.0, 4.1, 5.1, 7.1, 8.1, 10.1) and rural ( 4.0, 4.2, 5.0, 5.2, 6.0, 6.1, 7.0, 7.2, 7.3, 7.4, 8.0, 8.2, 8.3, 8.4, 9.0, 9.1, 9.2, 10.0, 10.2, 10.3, 10.4, 10.5, 10.6).30
References
- Dahlhamer J, Lucas J, Zelaya C, Nahin R, Mackey S, DeBar L, et al. (2016) Prevalence of Chronic Pain and High-Impact Chronic Pain Among Adults -United States 67(36): 1001-1006.
- Schappert SM, Burt CW (2006) Ambulatory care visits to physician offices, hospital outpatient departments, and emergency departments: United States 2001-2002.
- Dueñas M, Ojeda B, Salazar A, Mico JA, Failde I (2016) A review of chronic pain impact on patients, their social environment and the health care system. J Pain Res Dove Press 9: 457-467.
- Kominek Courtney (2018) Current and Emerging Options to Combat the Opioid Epidemic.
- Postmarket Drug Safety Information for Patients and Providers - Abuse-Deterrent Opioid Analgesics. Center for Drug Evaluation and Research.
- Mandating PDMP (2016) participation by medical providers: current status and experience in selected states.
- Littrell J (2001) Expanding access to Medication Assisted Treatment: The U.S. government’ s response to the current heroin epidemic.
- Dowell D, Haegerich TM, Chou R (2016) CDC Guideline for Prescribing Opioids for Chronic Pain—United States, JAMA, American Medical Association 315: 1624.
- Deyo RA, Hallvik SE, Hildebran C, Marino M, Dexter E, et al. (2017) Association Between Initial Opioid Prescribing Patterns and Subsequent Long-Term Use Among Opioid-Naïve Patients: A Statewide Retrospective Cohort Study. J Gen Intern Med 32: 21-27.
- Shah A, Hayes CJ, Martin BC (2017) Characteristics of Initial Prescription Episodes and Likelihood of Long-Term Opioid Use- United States 66: 265-269.
- Bonnie RJ, Ford MA, Phillips JK, (2017) Pain Management and the Opioid Epidemic [Internet]. Washington, D.C National Academies Press.
- Meyer R, Patel AM, Rattana SK, Quock TP, Mody SH (2018) Prescription opioid abuse: a literature review of the clinical and economic burden in the United States. Popul Health Manag 17: 372-387.
- Sehgal N, Manchikanti L, Smith HS (2018) Prescription opioid abuse in chronic pain: a review of opioid abuse predictors and strategies to curb opioid abuse. Pain Physician 15: 67-92.
- Barnett ML, Gray J, Zink A, Jena AB (2017) Coupling Policymaking with Evaluation-The Case of the Opioid Crisis. N Engl J Med [Internet]. Massachusetts Medical Society 377: 2306-2309.
- Pearson A, Moman R, Moeschler S, Eldrige J, Hooten WM (2017) Provider confidence in opioid prescribing and chronic pain management: results of the Opioid Therapy Provider Survey. J Pain Res Dove Press 10: 1395-1400.
- Brunson JC, Laubenbacher RC (2018) Applications of network analysis to routinely collected health care data: A systematic review. J Am Med Informatics Assoc 25: 210-221.
- Barnett ML, Christakis NA, O’Malley J, Onnela J-P, Keating NL, et al. (2012) Physician Patient-sharing Networks and the Cost and Intensity of Care in US Hospitals. Med Care 50: 152-160.
- Moen EL, Austin AM, Bynum JP, Skinner JS, O’Malley AJ (2016) An analysis of patient-sharing physician networks and implantable cardioverter defibrillator therapy. Heal Serv Outcomes Res Methodol. Springer 16: 132-153.
- Landon BE, Keating NL, Onnela JP, Zaslavsky AM, Christakis NA, et al. (2018) Patient-sharing networks of physicians and health care utilization and spending among medicare beneficiaries. JAMA Intern Med 178: 66-73.
- Uddin S, Hossain L, Kelaher M (2012) Effect of physician collaboration network on hospitalization cost and readmission rate. Eur J Public Health, Oxford University Press, USA 22: 629-633.
- Pollack CE, Lemke KW, Roberts E, Weiner JP (2015) Patient sharing and quality of care: measuring outcomes of care coordination using claims data. Med Care. NIH Public 53: 317-323.
- Dugoff EH, Fernandes-Taylor S, Weissman GE, Huntley JH, Pollack CE (2018) A scoping review of patient-sharing network studies using administrative data. Transl Behav Med 8: 598-625.
- Bae SH, Nikolaev A, Seo JY, Castner J (2015) Health care provider social network analysis: A systematic review. Nurs Outlook 63: 566-584.
- https://www.arkansasapcd.net/Docs/209/
- Barnett ML, Landon BE, O’Malley AJ, Keating NL, Christakis NA (2011) Mapping physician networks with self-reported and administrative data. Health Serv Res 46: 1592-609.
- Landon BE, Onnela JP, Keating NL, Barnett ML, Sudeshna P, O’Malley AJ, et al. (2014) Using Administrative Data to Identify Naturally Occurring Networks of Physicians. Med Care 51: 715-721.
- Choudhury A, Kaushik S, Dutt V (2017) Social-Network Analysis for Pain Medications. Proc 2017 IEEE/ACM Int Conf Adv Soc Networks Anal Min New York, NY, USA, ACM pp. 881-885.
- Nair HS, Manchanda P, Bhatia T (2010) Asymmetric Social Interactions in Physician Prescription Behavior: The Role of Opinion Leaders. J. Mark. Res. American Marketing Association pp. 883-895.
- Geissler KH, Lubin B, Marzilli Ericson KM (2016) Access is Not Enough: Characteristics of Physicians Who Treat Medicaid Patients. Med Care 54: 350-358.
- Bell JR (2012) Relative Centrality Measures.
- Shaw ME (1954) Group Structure and the Behavior of Individuals in Small Groups. J Psychol [Internet]. Taylor & Francis Group 38: 139-149.
- Freeman LC (1978) Centrality in Social Networks Conceptual Clarification. Soc Networks 1.
- Freeman LC (1978) /79) 215-239 @Elsevier Sequoia S.A., Lausanne-Printed in the Netherlands [Internet]. Soc. Networks.
- Barrat A, Barthélemy M, Pastor-Satorras R, Vespignani A (2004) The architecture of complex weighted networks. Proc Natl Acad Sci U S A [Internet]. National Academy of Sciences 101: 3747-3752.
- Bonacich P (1972) Technique for Analyzing Overlapping Memberships. Sociol Methodol 4: 176.
- Bonacich P (2018) Some unique properties of eigenvector centrality. Soc Networks 555-564.
- Newman MEJ. Networks an Introduction.
- Freeman L (2018) A Set of Measures of Centrality Based on Betweenness | BibSonomy .
- Freeman L (1980) The gatekeeper, pair-dependency and structural centrality. Qual Quant. Kluwer Academic Publishers 14: 585-592.
- Dijkstra EW (1959) A note on two problems in connexion with graphs. Numer Math.
- Moen EL, Kapadia NS, O’Malley AJ, Onega T (2018) Evaluating breast cancer care coordination at a rural National Cancer Institute Comprehensive Cancer Center using network analysis and geospatial methods. Cancer Epidemiol Biomarkers Prev. cebp.0771.2018.
- Newman MEJ (2018) Scientific collaboration networks. II. Shortest paths, weighted networks, and centrality.
- Sabidussi G (1966) The centrality of a graph. Psychometrika. pp. 581-603.
- Carrington PJ (2011) Scott, Carrington_The SAGE handbook of social network analysis pp.622.
- Burt RS (1992) Structural holes: the social structure of competition. Harvard University Press, USA.
- Thomas Valente (2010) Social Networks and Health: Models, Methods, and Applications. Oxford University Press, USA.


-

Mark E Smith
Bio chemistry
University of Texas Medical Branch, USA -

Lawrence A Presley
Department of Criminal Justice
Liberty University, USA -

Thomas W Miller
Department of Psychiatry
University of Kentucky, USA -

Gjumrakch Aliev
Department of Medicine
Gally International Biomedical Research & Consulting LLC, USA -

Christopher Bryant
Department of Urbanisation and Agricultural
Montreal university, USA -

Robert William Frare
Oral & Maxillofacial Pathology
New York University, USA -

Rudolph Modesto Navari
Gastroenterology and Hepatology
University of Alabama, UK -

Andrew Hague
Department of Medicine
Universities of Bradford, UK -

George Gregory Buttigieg
Maltese College of Obstetrics and Gynaecology, Europe -

Chen-Hsiung Yeh
Oncology
Circulogene Theranostics, England -
.png)
Emilio Bucio-Carrillo
Radiation Chemistry
National University of Mexico, USA -
.jpg)
Casey J Grenier
Analytical Chemistry
Wentworth Institute of Technology, USA -

Hany Atalah
Minimally Invasive Surgery
Mercer University school of Medicine, USA -

Abu-Hussein Muhamad
Pediatric Dentistry
University of Athens , Greece
