


Lupine Publishers Group
Lupine Publishers
ISSN: 2637-4676
Research Article(ISSN: 2637-4676) 
Viability of Ifad/Vcd Rice Project among Smallholder Farmers in Niger State of Nigeria Volume 7 - Issue 1
Received: June 17, 2019; Published: June 28, 2019
Corresponding author: Sadiq, Mohammed Sanusi, Department of Agricultural Economics and Extension, FUD, P.M.B. 7156, Dutse, Nigeria
DOI: 10.32474/CIACR.2019.07.000254
Abstract
Failure to sustain most of the rural poor and food security programmes in Nigeria after their life span is due to poor productivity of the capital investment of a project to generate a remunerative income to sustain a typical agrarian farming household in Nigeria. Thus, to critically investigate this hypothetically proposition, this research aimed evaluating the viability of the IFAD rice project among the beneficiaries in Niger State of Nigeria. Undated data of 2018 rainfed cropping season was elicited from 111 farmers through multi-stage sampling technique and the information were collected via structured questionnaire complemented with interview schedule. Both descriptive and inferential statistics were used to analyze the data collected. The empirical results showed that the rice project in the study area is likely not to be sustained after the stipulated time frame for the programme as inspite of the programme aim of doubling farmers’ income viz. value chain, the capital investment is not productive to sustain an average farming household composed of 8 persons having an operational holding of less than two hectares. Therefore, the study recommend provision of consumption credit in addition to the production credit advanced to the farmers in order to make the capital investment viable so that its turnover after each production season will be consistently re-invested into the rice project and possibility of a farmer taken-up additional activities along the chain, thus keeping the business going concern viable and sustainable.
Keywords: Viability; Rice; IFAD Project; Niger State; Nigeria
Introduction
Andrea [1], reported that globally, approximately 1.5 billion people are engaged in small-scale agriculture which include 75% of the world’s poorest people, whose food, income and livelihood prospects depend on agriculture. In Nigeria, peasantry has been the major mode of agricultural production and livelihood sustenance for over 70 percent of the population that is engaged in various agricultural activities as a career upon which the large nonfarming population of the nation depends on for food security Atala and Hassan [2]. Literature showed that poverty has been more prevalent among the food supplying rural populace which is majorly made up of smallholder farmers, as such agriculture still remain the major source of income to the rural poor Schubert [3]. Therefore, in Nigeria, it is impossible to achieve poverty reduction without rapid agricultural growth. In developing economies such as Nigeria, concern over poverty surge and the need for its alleviation as a means of livelihood improvement has led to conceptualization and implementation of various programmes in the world which aimed at poverty alleviation Babatunde [4]. Ashley and Maxwell [5] as cited by Nxumalo and Oladele [6], reported that the low performance of agriculture sector does not only threaten the livelihood but it also affects the production capacity of the natural resources base, accelerates environmental degradation and fails to address poverty and malnutrition. In order to enhance the performance of agricultural sector, food security and poverty intervention programmes such as International Fund for Agricultural Development-Value Chain Development (IFAD/ VCD) was introduced in Nigeria. The programme is essentially people oriented as it support the Nigerian Government’s poverty reduction programme in rural areas with special focus on large numbers of smallholder farmers. According to Chambers [7] as reviewed by Kumba [8] and cited by Etwire et al. [9] in the past few decades, bottom-to-up approaches that view beneficiaries as partners, utilize local experience and endeavour to empower target beneficiary have been promoted.
This is because the developmental efforts that used the top-tobottom approach with minimal input and involvement of target beneficiaries have long been recognized as an unsustainable and poor pathway to beneficiary empowerment and development. The essence of the IFAD-VCD programme is to improve the livelihood of the rural populace particularly the vulnerable groups in order to enable them to escape the suicidal vicious cycle of poverty. The empowerment of rural poor communities to enable them identify their needs, implement a broad range of agricultural and rural development initiatives will bring about economic growth and development in the country. Most of the agricultural projects failed to be sustained due to poor capital investment productivity which is not remunerative to sustain the livelihood of the beneficiaries or target groups. Therefore, for the IFAD programme not to take a cue among the failed projects it becomes very imperative to evaluate the viability of the capital investment of the farmers participating in the programme in Niger State of Nigeria. This research focused on the rice project as the state is well known for the production of rice in Nigeria. The broad objective of the study is to evaluate the viability of IFAD rice project among the participating farmers in the study area while the specific objectives were to estimate the profitability of the IFAD anchor rice project in the study area; to assess the motivating factors influencing participation in the rice project in the study area; and, to determine the problems affecting the farmers participating in the rice project in the study area.
Research Methodology
The study was conducted in Niger State of Nigeria and the state is located on latitudes 8°20’N and 11°30’N of the equator and longitudes 3°30’E and 7°20’E of the Greenwich Meridian time. The vegetation of the state is northern guinea savannah with sparse of southern guinea savannah. Agriculture is the major occupation in the study area and it’s complemented with civil service jobs, artisanal, craftwork, Ayurveda medicines and petty trade. The present study relied on cross-sectional/undated data obtained from 111 rice farmers drawn viz. multi-stage sampling technique using sampling frame obtained from IFAD-VCDP. In the state, only five (5) Local Government Areas were chosen as the pilot phase for the programme with Agricultural Zone A (Bida) and C (Kontagora) having two LGAs each namely Bida and Katcha; and, Wushishi and Kontagora respectively, while Zone B has one participating LGA viz. Shiroro. In the first stage, for Agricultural Zone A, one LGA viz. Katcha LGA was randomly selected; for Zone B the only participating LGA viz. Shiroro LGA was automatically selected; while for Zone C, Wushishi LGA was purposively selected based on its comparative advantage as rice is produce throughout the year owing to the presence of Tungan Kawo irrigation dam. In the second stage, two villages were randomly selected from each of the chosen participating LGAs. Thereafter, two active co-operative associations from each of the selected villages were randomly selected. It is worth to note that Microsoft excel inbuilt random sampling mechanism was used for the random selections of the villages and the co-operative associations. In the last stage, using the sampling frame obtained from IFAD/VCD office (Table 1), Cochran’s formula was used to determine the representative sample size. Thus, a total of 111 active rice farmers form the sample size for the study.
Table 1: Sampling frame of participating and non-participating farmers.

Source: IFAD-VCDP farmers’ database, 2018
Note: SF and SS means sampling frame and sample size respectively.
Structured questionnaire complemented with interview schedule was used to elicit information from the respondents during the 2018 cropping season. The first objective was achieved using pseudo-profit function (cost concepts and income measures), the second objective was achieved using measure of dispersion and Kendall’s coefficient of concordance (KCC) model and the last was achieved using KCC model and exploratory factor analysis. The Cochran’s formula used is shown below:
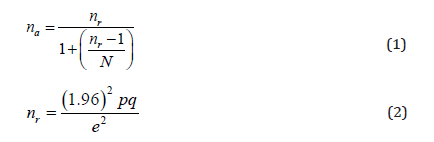
Where:
na= adjusted sample size for finite population
nr = sample size for infinite population
N= population size
P= proportion of population having a particular characteristic
q= 1 – p
e2 = error gap (0.07)
Thus, p = 0.40 and q = 1 – 0.60 = 0.50
Empirical model
Cost Concepts and Income Measures
The cost concepts and income measures developed by the Indian Commission of Agricultural Cost and Prices (CACP) and adopted by Subba et al. [10,11], are specified below:
Cost Concepts
Costs related to sesame production are split up into various cost concepts such as A, A1 , B and C
Opportunity/Implicit cost: costs of self-owned and selfemployed resource i.e. imputed cost Accounting/Explicit cost: costs for purchasing and hiring of inputs and input services i.e. paid out costs/cash costs/ nominal/ money cost
Economic cost: Opportunity cost + Accounting cost
I. Cost A: The following items are included in Cost A
Wages of hired labour
Market rate of fertilizers
Market rate of seeds
Market value of biocides
Land revenue, cess and other tax
Depreciation of farm implements
Interest on working capital
Miscellaneous expenses
II. Cost A1: Cost A + rent paid for leased in land
III. Cost B: Cost A1 + interest on fixed capital excluding land + rental value of owned land
IV. Cost C: Cost B + 10% of TVC as management cost Sidharth and Pankaj [12].
Income Measures
These are the returns over different cost concepts. Different income measures are derived using the cost concepts. These measures are given below:

Farm investment income = Farm business income – Imputed value of family labour – Imputed management cost (OR) Net income + Imputed rental value of owned land
Kendall’s Coefficient of Concordance (W)
Kendall’s coefficient of concordance (W) uses the χ2 statistic for testing. If the test statistic W is 1, then all the survey respondents have been unanimous and each respondent has assigned the same order to the list of subjects or situations. If W is 0, then there is no overall trend of agreement between the respondents and their responses may be regarded as essentially random. Intermediate values of W indicate a greater or lesser degree of agreement among the various respondents. Following Sadiq et al. [13]. Kendall’s coefficient of concordance developed by Kendall and Smith (1939); Wallis (1939) is given below:
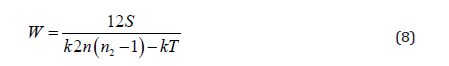
Where;
S = Sum over all subjects
k = Number of respondents ranking the attributes or objects
n = Number of attributes or objects that are evaluated by respondents
T = Tie-correction factor
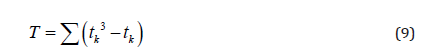
tk is the number of tied ranks in each (k) of g groups of ties. The sum is computed over all groups of ties found in all m variables of the data table. T is 0 when there are no tied values.
The Chi2 (x2)statistic is given as follow:
Where;
k = Number of respondents
n = Number of objects or attributes being ranked
W = Kendall’s coefficient of concordance (KCC)
Friedman’s Chi-Square Statistic
The Friedman’s Chi-square statistic proposed by Friedman [14] was developed primarily to test the hypothesis that the ratings assigned to subjects under investigation come from the same statistical population. This is an indirect way of evaluating the extent of agreement among raters. Due to its close mathematical relationship with Kendall’s coefficient of concordance (W) it is used in studies of inter-judge reliability. The Friedman’s Chi-square statistic is given below:
Where;
χr2 = Friedman’s chi2 statistic
k = Number of respondents
n = Number of objects or attributes being ranked
W = Kendall’s coefficient of concordance (KCC)
Results and Discussion
Cost and Income Structures of Rice Production
A perusal of the Table showed the incurred economic cost of
cultivation to be  158793.60 with the working and fixed capital
costs been 127676.1 (80.40%) and 31117.52 (19.60%)
respectively (Table 2). However, a review of the cost implication
from accounting point of view, the cost of cultivation, working and
fixed capital costs plummeted to 91794.36, 88658.55 (96.58%)
and 3135.82 (3.42%) respectively. In addition, the economic cost
of production stood at 43.83 while the money cost of production
plummeted to 32.89. Furthermore, the accrued economic revenue
cum gross margin and net income were 543429.60, 415753.50
and 384636.00 respectively. Though, the farm business
income, family labour income and farm investment income were
441421.10, 436421.10 and 389636.00 respectively. Thereafter,
it can be deduced from the income measures that for every 1
invested a profit of 2.26kobo will be gain and the 1 incurred will
be returned as indicated by the RONI index value of 3.26. Thus, a
profit of 69.04% was gained.
158793.60 with the working and fixed capital
costs been 127676.1 (80.40%) and 31117.52 (19.60%)
respectively (Table 2). However, a review of the cost implication
from accounting point of view, the cost of cultivation, working and
fixed capital costs plummeted to 91794.36, 88658.55 (96.58%)
and 3135.82 (3.42%) respectively. In addition, the economic cost
of production stood at 43.83 while the money cost of production
plummeted to 32.89. Furthermore, the accrued economic revenue
cum gross margin and net income were 543429.60, 415753.50
and 384636.00 respectively. Though, the farm business
income, family labour income and farm investment income were
441421.10, 436421.10 and 389636.00 respectively. Thereafter,
it can be deduced from the income measures that for every 1
invested a profit of 2.26kobo will be gain and the 1 incurred will
be returned as indicated by the RONI index value of 3.26. Thus, a
profit of 69.04% was gained.
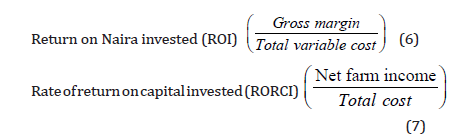
The RORCI index value of 2.45 showed that the investment in
the long-run is solvent i.e. has the ability of defraying its liabilities.
Therefore, money markets are advised to advance credit to these
farmers as their capital base is capable of defraying the principal
and interest as the 59.09% gain will liquidate the principal of
30.71% plus the interest rate of 8%, thus leaving a farm with 20.38%
gain on capital invested. Therefore, it can be inferred that the IFAD
rice project from business point of view is worth investing in and
participating in as the rice venture is very profitable but from the
economic point of view it cannot sustain an average household size
of 8 persons as the monthly income per household head translate
into 32053.00 ($104.07). Consequently, it will amount to N4006.63
($13.01) per head/month in the household, which will translate to
$0.43 (133.55) per day, thus far below the FAO recommended
$1.9 for required calorie intake per head/day for sub-Saharan
Africa. Therefore, the programme should incorporate consumption
credit so as to make the capital investment productivity in order to
achieve her major goal of food security for the subsistence farming
household and sustainability of the programme after the life span
of the programme.
Table 2: Cost concepts and income measures per hectare of rice farm.

Source: Field survey, 2018
Motivational Factors Influencing Participation in the Study Area
Table 3: Motivational factors influencing participation.

Source: Field survey, 2018
Using the mean rank of the Kendall’s coefficient of concordance (KCC), a cursory review of the results showed the most important factors that influenced farmers’ participation in the programme to be motivation given by the change agents (1st), provision of subsidized inputs (2nd), assurance of off-takers (3rd), access to training (4th) and access to market information (5th) (Table 3). However, the identified least influencing factors were non-profitability of other interventions (11th) and size of the operational holding (12th). Thus, it is very obvious that the programme goal of enhancing livelihood status and food security of subsistence farming household had resound acceptability in the study area. Furthermore, the KCC value of 0.68 implies that there is good concordance or agreement among the farmers with regard to this ranking of the factors influencing their participation. In addition, the significance of the Friedman’s Chi2 at 1% degree of freedom indicates that the assigned attributes to the motivational factors by the farmers came from the statistical population.
Perceived Constraints Affecting IFAD Farmers
A perusal of the Table showed the major barriers confronting
the farmers participating in the programme to be sharp practices/
irregularities of change agents viz. extortion and financial
exploitation (1st), inadequate access to improved rice varieties viz.
poor availability of licensed agro-seed vendors (2nd), inadequate
extension service delivery (3rd), scarcity of farm inputs also
owing to poor availability of licensed agro-vendors (4th) and
poor coordination among the actors involved in the value chain
(5th). Inadequate processing material was the only identified
perceived moderate constraint affecting the participants as it
had a mean value equal to the likert scale benchmark ( 3.50).
However, the programme participants perceived inadequate
counterpart fund contribution and inadequate financing to be the
lesser constraints. Thus, it can be suggested that there is no much
problem of administrative bottleneck in the release of fund by the
programme organizers in the state to the target group. The grand
mean value (3.66±0.353) been higher than the likert scale mean
value (3.5±1.87), imply that most of the farmers had negative or
unfavorable perception with respect to the identified problems
affecting them in the rice production project in the study area. Also,
the constraint index value of 0.61 implies that 61% of the farmers
had unfavorable disposition with respect to the problems identified
to be affecting them in rice production in study area (Table 4). The
significance of the estimated value of KCC index (0.70) at 1% degree of freedom indicates that there is concordance or agreement
among the farmers with respect to the ranking of the constraints
affecting them in rice production in the study area. In addition, the
significance of the Freidman’s test at less than 1% probability level
means that the attributes assigned to the constraints by the farmers
came from the statistical population. Therefore, it is suggested that
the programme policy makers should tacitly use this ranking to
address the problems affecting the rice production project in the
study area Table 4.
Table 4: Constraints affecting IFAD farmers. .

Source: Field survey, 2018. Note: value in ( ) is rank and Base line mean ( )= 3.
Furthermore, a perusal of the Table showed the rotational analysis to be suitable as the KMO value is 0.898, a meritorious level, and is above the Kaiser recommended value of 0.50, thus the adequacy of the sample for the analysis. A value of “zero” means that the sum of partial correlation is large relative to the sum of correlation, implying diffusion in the pattern of correlation; hence, factor analysis is likely to be inappropriate. While a value close to “one” indicates that the patterns of the correlations are relatively compact, thus factor analysis will yield distinct and reliable factors Sadiq et al. [13] In addition, the original correlation matrix is not an identity matrix as evident by the Bartlett’s Test of Sphericity which is significant at less than 1% degree of freedom. For factor analysis to work there is need for some relationships between variables because if the R-matrix is an identity matrix, then all the correlation coefficients will be zero. For the principal factor analysis, the varimax rotation reduced the perceived constraints to an interpretable four factors as evident by their respective Eigen value which is above 1. The existence of internal consistency between the factor loadings for each of the four (4) factors was observed as indicated by each rotated factor Cronbach’s Alpha values which were greater than the recommended value of 0.70 as posited by Nunnaly [15] and cited by Purnomo and Lee [16].However, Churchill [17]. suggested a cutoff point of 0.60 to be appropriate for exploratory research. The Behaviour of individual items in relation to others within the same factor provides confirmation of content validity because the highest factor loading is central to the domains assessed by these factors Francis et al. [18].
The extracted four factors accounted for 70.099% of the total variance which is above the percentage recommended to be satisfactory for social science research by Hair et al. [19,20] as cited by Bagheri and Fami. The extracted factors exclude those factors loadings whose values were less than 0.40. Thereafter, the four extracted factors were labeled as ‘production and social constraints’, ‘market and extension constraints’, ‘technological constraint’ and ‘financial constraint’. Factor 1 (F1), named ‘production and social constraints’, highly loaded from ten factor loadings and accounted for 47.58% of the total variance showed farmers concern on time and form utilities, land tenure problem and illiteracy. Therefore, this called for the provision of scientific storage facilities and farmers field schools in the studied area to address these constraints. Factor 2 (F2), named ‘market and extension constraints’, which explained 11.52% of the total variance and loaded from seven factor loadings showed farmers concern on market imperfections and ineffectiveness of change agents, and thus the study call for interventions viz. input subsidies and farmer to farmer extension approach to tackle this constraints affecting rice production in the studied area. Factor 3 (F3), named ‘technological constraint’, loaded from three factor loadings and explained 6.31% of total variance, revealed farmers worry on inadequate availability of improved seed varieties, and thus the study call for creation of adequate and proper input link in the chain viz. licensing some of the farmers as agro-seed dealers and providing them with adequate credit for seed marketing in the study area. The 4th Factor (F4), named “Financial constraint”, loaded from three factor loadings and accounted for 4.69% of the total variance, showed farmers concern on the effect of capital paucity on rice production and thus call for the need to provide consumption credit apart from the production credit in order to make the production credit productive so as to generate a remunerative turnover that will enhance the solvency status of their enterprise in the study [21-24].
Conclusion and Recommendation
Inspite of the programme packages that motive good participation in the IFAD programme in the study area, it can be inferred that the rice production project anchor by the programme in the study area is likely not to be sustainable in the long-run as the gained profit from the capital investment is not productive or remunerative to sustain an average subsistence farming household composed of 8 persons having less than two hectares of farm. In addition, four factors viz. production and social constraints, market and extension constraints, technological constraint and financial constraint were empirically established to be the constraints affecting the rice project in the study area. Therefore, it was recommended that in addition to the production credit advanced to the farmers, consumption credit should be advanced to the farmers so as to make the capital investment productive so that its turnover will be consistently re-invested into the business instead of being feasted by capital consumption items.
References
- Andrea B (2014) Linking Smallholder Farmers to Markets and the Implication for Extension and Advisory Services. MEAS Discussion Paper No. 4. United State Agency for International Development.
- Atala TK, Hassan MB (2012) Adopted Village Concept and Vision 20: 2020. Paper presented at the North West Zonal REFILS Workshop, held at the Institute for Agricultural Research, Ahmadu Bello University, Zaria, pp. 23-24.
- Schubert R (1994) Poverty in developing countries, its definition, extent and implications. Economics 49(50).
- Babatunde O (2006) Differential poverty reduction impact of small-scale irrigated development between its beneficiaries and non-beneficiaries in Nigeria. Technical Report on the Agropolis Award.
- Ashley C, Maxwell S (2001) Rethinking rural development. Development Policy Review 19(4): 395-425.
- Nxumalo KKS, Oladele OI (2013) Factors affecting farmers’participation in Agricultural Programme in Zululand District, Kwazulu Natal Province, South Africa. Journal of Social Science 34(1): 83-88.
- Chambers R (1983) Rural development: Putting the last first. Essex. Addison Wesley Longman Limited.
- Kumba FF (2003) Farmer participation in agricultural research and extension service in Namibia. Journal of International Agricultural and Extension Education 10(3): 47-55.
- Etwire PM, Dogbe W, Wiredu AN, Martey E, Etwire E, et al. (2013) Factors influencing farmer’s participation in agricultural projects: The case of the Agricultural Value Chain Mentorship Project in the Northern Region of Ghana. Journal of Economics and Sustainable Development 4(10): 36-43.
- Subba RS, Raghu RP, Neelakanta STA, Bhavani DI (2016) Agricultural Economics First Edition. Oxford and IBH publishing company PVT Limited, New Delhi, India.
- Subba RS, Raghu RP, Neelakanta STA, Bhavani DI (2004) Agricultural Economics Second Edition. Oxford and IBH publishing company PVT. Limited, New Delhi, India.
- Sidhart B, Pankaj KS (2012) Agricultural economics at glance. Sharma publisher and distributors, New Delhi, India.
- Sadiq MS, Singh IP, Ahmad MM, Lawal M, Kamaldeen N, Sani TP (2018) Determining the perceived constraints affecting cassava farmers in Kwara State of Nigeria. FUDMA Journal of Agriculture and Agricultural Technology 4(2): 235-247.
- Friedman M (1937) The use of ranks to avoid the assumption of normality implicit in the analysis of variance. Journal of American Statistical Association 32(200): 675.
- Nunnaly JC (1978) Psychometric Theory, 2nd ed., McGraw Hill, New York, USA.
- Purnomo SH, Lee Y (2010) An assessment of readiness and barriers towards ICT programme implementation: Perceptions of agricultural extension officers in Indonesia. International Journal of Education and Development using Information and Communication Technology 6(3): 19-36.
- Churchill GA (1979) A Paradigm for Developing Better Measures of Marketing Constructs. Journal of Marketing Research, 16(1): 64-73.
- Francis L, Katz, Y, Jones S (2000) The reliability and validity of the Hebrew version of the computer attitude scale. Computer Education 35(2): 149-59.
- BagheriA, Fami HS (2016) Potato growers’ risk perception: A case study in Ardabil.
- Hair JF, Anderson RE, Tatham RL, Black WC (1998) Multivariate Data Analysis, (5th Edn). Prentice Hall, Upper Saddle River, NJ, USA.
- Kendall MG, Smith BB (1939a) On the method of paired comparisons. Biometrica 31(3-4): 324-345.
- Kendall MG, Smith BB (1939b) The problem of m ranking. The Annals of Mathematical Statistics 10(3): 275-287.
- Sadiq MS, Singh IP, Isah MA, Greima IJ, Umar SM (2017) Strategy of minimizing the cost of cultivation vis-à-vis boosting farm income of small-holder maize farmers in Niger State of Nigeria using Efficiency Measurement System (EMS). Indian Journal of Economics and Development 17(2a): 722-728.
- Wallis WA (1939) The correlation ratio for ranked data. Journal of the American Statistical Association 3(207): 533-538.


-

Mark E Smith
Bio chemistry
University of Texas Medical Branch, USA -

Lawrence A Presley
Department of Criminal Justice
Liberty University, USA -

Thomas W Miller
Department of Psychiatry
University of Kentucky, USA -

Gjumrakch Aliev
Department of Medicine
Gally International Biomedical Research & Consulting LLC, USA -

Christopher Bryant
Department of Urbanisation and Agricultural
Montreal university, USA -

Robert William Frare
Oral & Maxillofacial Pathology
New York University, USA -

Rudolph Modesto Navari
Gastroenterology and Hepatology
University of Alabama, UK -

Andrew Hague
Department of Medicine
Universities of Bradford, UK -

George Gregory Buttigieg
Maltese College of Obstetrics and Gynaecology, Europe -

Chen-Hsiung Yeh
Oncology
Circulogene Theranostics, England -
.png)
Emilio Bucio-Carrillo
Radiation Chemistry
National University of Mexico, USA -
.jpg)
Casey J Grenier
Analytical Chemistry
Wentworth Institute of Technology, USA -

Hany Atalah
Minimally Invasive Surgery
Mercer University school of Medicine, USA -

Abu-Hussein Muhamad
Pediatric Dentistry
University of Athens , Greece
