


Lupine Publishers Group
Lupine Publishers
ISSN: 2637-4676
Review Article(ISSN: 2637-4676) 
The Systems of Consumer Demand Analysis: A Review Volume 1 - Issue 4
Received: March 01,2018: Published: March 21,2018
Corresponding author: Irfan Ullah, Department of Agricultural & Applied Economics, The University of Agriculture Peshawar, Pakistan
DOI: 10.32474/CIACR.2018.01.000118
Also view in:


Abstract
For several decades both theoretical and empirical economist have shown interest in consumers behavior and regarding consumer's preferences has increased our understanding enormously. This paper is based on the comparative assessment of the demand system selected; the Linear Expenditure System fails to describe consumers demand behavior as specified by Engel's-Law. With the increasing expenditures, inferior commodities lean towards luxuries which are not plausible. So, for food demand analysis the LES is not appropriate. With utility maximizing behavior the Rotterdam is not consistent even if corresponds-to-generally- accepted-empirical-facts-and-is flexible (e.g. the substitutive or complementary relationship among goods and demand description for inferior commodities, necessities and luxuries). The parametric restrictions given by AIDS and Indirect Trans log System, theoretical properties of demand function can be imposed. Both systems depict generally empirical facts and are derived from flexible function from. However, estimation process may become difficult due to relatively high number of independent parameters the Indirect Tans log System. Linear Approximate Almost Ideal Demand System are much simpler in estimation and linear in parameters and therefore, LA/AIDS can be widely applied as basic model for empirical studies.
Introduction
For several decades both theoretical and empirical economist have shown interest in consumers behavior and regarding consumer's preferences has increased our understanding enormously Brown and Deaton, 1972. Due to increased computing capacities and well as availability of detailed dataset, recently renewed interest has been registered. In particular, empirical research has come up with more sophisticated models of consumer's behavior [1]. Modern consumer demand analysis is practiced by formulating and estimating demand system, which can be defined as given the prices of goods, income and with specific characteristics how consumers allocated their total expenditures to consumption of these goods or services is described by sets of equations. Thus, information on demand responses to change in prices of goods, income (expenditure) and other variables of interest is provided by complete demand system. In order to get meaningful information and justified outcomes, the conditions required by neoclassical microeconomic theory and fit the data well must be satisfied by such system [2].
Using a given dataset, among many of the available functional form for estimation of demand, the best model specification cannot be answered by any economic theory. Since the ambiguity of any model having finite number if parameters cannot be spanned by the space of the neoclassical functions. In literature, different approaches have been proposed for comparison. An elementary approach for estimation of different demand function is one having goodness of fit-statistics [3,4]. Another approach which possesses neoclassical preferences of the demand functions is known in the region where the function meet the theoretical regularity conditions. By knowing the location and size of the regular region superiority of one functional form over another can be supported [5,6].
According to Blanciforti [7] when we trying to estimate demand system two basic approached are used. The first which fulfills various axioms of choice starts with utility maximization. By utility maximization function subject to budget constraint demand functions are obtained. The second one starts by imposing restrictions on the system having an arbitrary demand system. As compared to the first approach, to a much closer extend the second approach corresponds with micro and macroeconomic theories. It is useful to know the meaning of utility in order to understand the general framework of consumer utility maximization. Utility is defined as an index of satisfaction from consuming goods and services and can be additive or comparable across consumers [8]. The use of duality allows a considerable increase in the flexibility with which empirical demand equations can be specified and permits much more intimate relationship between theory and practice [9]. The last but not the least approach to study a Monte Carlo study to explore the demand model accuracy is when the true elasticity's of substitution are known [10].
Partial Versus Complete Demand System
Partial demand system is still estimated to describe consumer behavior in empirical research due to results interpretation and ease of estimation. Among many of the advantages of partial demand model is that smaller number of observations are required than the complete demand models which enables estimation simpler having limited number of parameters. However, under special circumstances such as time, data constraint and theoretical consideration this should only be done. In recent decades, most of the researcher concentrated on complete demand system for estimation. To use and estimated the complete demand system in empirical studies few of its advantages are listed below [11].
1. Expenditures and own/cross price demand elasticity's (uncompensated and compensated) are usually generated by empirical estimation of a complete demand system.
2. The substitutive or complementary relationship among the commodities can be described by considering the interdependence already existed.
3. Many of the welfare indicators such as subsistence level of expenditures or consumption for a specific good and marginal propensity to consume are also provided by some of the system specification.
4. In addition, testing of hypothesis about restrictions derived from demand theory, information is provided by the complete demand system.
There are also some difficulties beside the above-mentioned advantages which are related to the use of complete demand system.
1. To estimate the number of parameters adequate large dataset is required. Therefore, in order to reduce the number of parameters restrictions of separability are imposed.
2. By applying the demand theoretical problems like "aggregation problem over individuals" of the neoclassical demand theory exists [11,12]. Individual’s decisions of consumption in the neoclassical demand theory, it is assumed restrictively and implicitly that all the individuals have same utility functions, if average expenditures and consumption data are used for empirical estimation. In empirical estimations household take decisions based on household data and not the individuals.
3. Similarly, aggregation over different commodities is another problem which need assumptions on preferences structure and the use of index theory to choose suitable values for quantities and prices for these aggregated commodities. Demand system categorized it into three sub groups:
First, the directly specified demand system like the Rotterdam System. Second, based on expenditures function or indirect utility, demand systems are derived such as the Linear Expenditures System (LES). Third, from a flexible functional form demand systems are estimated, for example the Indirect Trans log System (ITS) and The Almost Ideal Demand System (AIDS) as presented in the following section.
The linear expenditure system
The Linear Expenditure system was developed in 1954 by stone to begin with a simple expenditure model [13]. Form the stone Geary utility functions LES is derived and has previously been considered by Klein Rubin (1948). The stone Geary utility function is as follows:
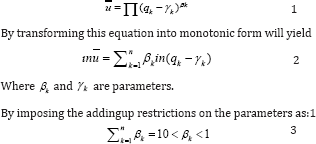
LES does not allow for inferior goods as suggested by the coefficient βk in the Stone Geary function having positive marginal share. As the marginal utility foreachgood βk (qk - qk) is positive, qk is greater than the corresponding than γk .
The sum of individual expenditures for these goods is equal to the total expenditures which indicates that the above utility function is strongly additive or separable. In addition, thelevel ofconsumption ofall other goodsis independentof themarginal utilityof each good iv

Maximizing the Stone Gearyutility functionw.r.t thebudget constraint yields the expenditure on good i as:
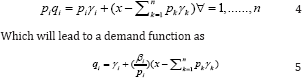
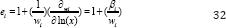
The expenditure function on good i is interpreted for all positive γ_i as follows.
At the cost of piγi for good i, the consumer will purchase first the quantity γi representing subsistence consumption level of good i. Leaving supernumerary expenditures  after the total consumption on all goods is Pkγk, which is allocated between the goods in the fixed proportion βi. The main features of the Linear Expenditures System can be summarized as:
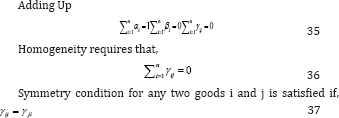
Homogeneity, addingup and Slutsky symmetry restrictions of the demand system are satisfied by this system. The LES cannot be complemented using the linear estimation method because it is linear in parameter, but not linear in parameters. As indicated by the positive coefficient the description for inferior goods demand does not allowed by the Linear Expenditures System i.e. (0< βk <1).
1. For good i the expenditure elasticity.com defined as (0< βk <1) .
2. No two good may be substitutes which is implied by the strongly separable property and is justifiable only for large aggregates of goods.
3.The relationship between the expenditure elasticities and price is proportional as implied by the additive utility function, but this restrictive assumption cannot be justified.
4.
Under LES all cross price elasticities  are negative which means that all pairs of goods are complements, while the own price elasticities
  for positive γi , ranges between minus
one and zero, implies that all goods are price inelastic.
for positive γi , ranges between minus
one and zero, implies that all goods are price inelastic.
5. The compensated ownprice elasticities (ε*ii) = εii +βi are positive, also the positive cross-price elasticities  indicated that every commodity cannot be complements of each other and must be substituted for one another.
The Rotterdam System
The Rotterdam system was introduced by Theil [14] and Barten [15] which is similar to the Linear Expenditures system of stone (1954). Instead of level of logarithms it works in differentials [16,17].
The resultant demand functions as:
where εi represent the expenditure elasticity for commodity i, andthecross-priceelasticities are εij
The compensatedcrossprice elasticities ε*ij can be writtenas ε*ij =εi- wj (Slutsky decomposition), so that:
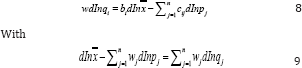
Where the budget constraint is followed by the second equality. For good i, the marginal propensity to spend on good is represented by the variable bi, the compensated cross price elasticity cij, weighted by the budget share such that
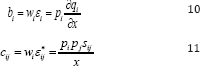
Where the Slutsky substitution matrix is composed of , i and j.
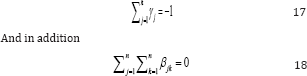
Theoretical consistency: The theoretical restriction can easily be related with the parameters of the Rotterdam system. The basic requirements of the adding-up property indicate that the net effect of change in price will be equal to zero and the marginal propensity to spend on all k will result in unity.
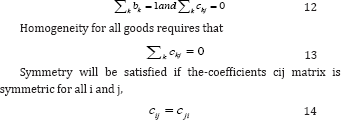
If the Slutsky matrix is semi definite then the substitution matrix will also be negative and semi definite as indicated by the negativity restriction. The Rotterdam system is although not derived from explicitly the expenditures or utility function but it is linear in parameter and easy to estimate. Using the marginal budget shares bi and ci. income elasticity's can be calculated and whether a good is luxury or necessity can also be concluded. All the substitutive or the complementary relation can be described among all the commodities. The Slutsky term and the marginal shares are supposed to be constant in the Rotterdam model.
The indirect translog system
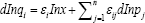
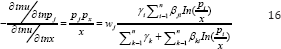
Christensen, Jorgenson, Lau [18] developed the Indirect Trans log System and can be derived using the logarithmic second ordered Taylor series approximates from the indirect utility function. Which can be written as:

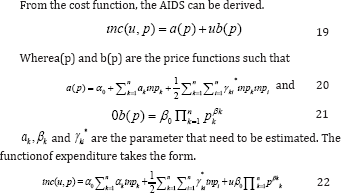
Under the symmetry restriction βij=βji, the parameters α0,γi,and 946;ij can be estimated. Symmetry and Homogeneity restriction imposition leaves independent parameters of  which need to be estimated.
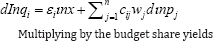
In budget share form application of Roy's identity will lead to the following demand system.
The following normalization is needed to ensure the nondecreasing in expenditures nature of the indirect utility function.
To estimate the system several parameters are needed which yield a high nonlinear demand function. If many goods are included, the demand system become very complex causing difficulties in estimation. The Trans log system may also yield problems in empirical estimation as it is nonlinear in parameters. The demand for necessity, luxury and inferior goods and substitutive or complementary relation can also be described by the Tans log system.
The almost ideal demand system (AIDS)
Deaton [19] introduced the Almost Ideal Demand System, which is derived from flexible expenditures function having many desirable and is extremely useful for demand system estimation. With simple parametric restrictions, such as symmetry and homogeneity, it automatically satisfies the aggregation restriction. In addition, this model is consistent with household budget data and has the ability to portray non-linear Engel curve. Due to its properties and simplicity in estimation the Linear Approximate Almost Ideal Demand System (LA/AIDA) is popular for empirical studies [16,20].
By applying the Shephard’s Lemma Hicksain demand function can be derived.
Hicksa in demand functions can be obtained by applying the Shephard's Lemma. The level of utility depends on total expenditures and prices are described by the indirect utility function when the cost function is inverted. By substituting the indirect utility function into the Hicksian demand function the Marshallian demand function can be obtained in its budget share form.
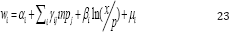
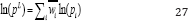
Where wi represents the budget share of good i, αi , 946;i and γij are the parametersneed to be estimated, pj is the price of good j, while x is the total expenditures and P is the aggregate price index that is defined by:
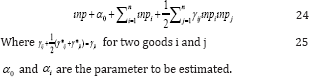
Simplicity of estimation: By using the above price index (24) will result in a non-linear relationship between price index and food prices and will appear in the form of a complicated nonlinear system. Deaton [19] proposed that by replacing the above mentioned price index (p) with Stone's price index the relationship can be linearized.

The AIDS model in which the stone price index is incorporated is called as the Linear Approximate Almost Ideal Demand system (LA/AIDS). It is widely cited that by using stone price index will introduce unit of measurement error [20]. The fundamental property of index number is not violated by the stone index because it is variant to changes in the unit if measurement for prices. The units of measurements error can be corrected if sample mean is used for prices. As suggested by Moschini 1995, to overcome the measurement error a Laspeyres price index can be used. If wi in Equation 58 is replaced by  the log linear analogue can be obtained. Hence, the Laspeyres price index becomes a geometrically average of prices. As linear estimation procedure, can be used so its estimation is much simpler.
By incorporating Equation 61 into Equation 58 yields a Linear Approximate Almost Ideal Demand System having Laspeyres Price index as below:
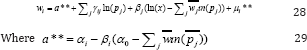
Using the relationship proposed by Pollak, wales [21], equation 28 is augmented with household socioeconomic characteristics as follows:

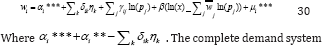
Where δ_(ir ) is the vector of parameters and η_r is a matrix of socioeconomic variables. The socioeconomic characteristics included in Equation 88 become as follows:
 that uses dummies and the demographic variables is the same as the single equation model.
Where the number of demographic and other dummies is represented by m.
When the property of additively is imposed, the expenditure function resulted in a singular matrix of variance and covariance. Thus, to estimate the LA/AIDS model one of the equations needed to be omitted. The expenditure equation for "other food" is omitted and by using the theoretical conditions imposed during the estimation process the coefficient for the omitted equation are derived. However, the coefficients estimated using the LAAIDS is invariant to omitted equation.
Derivation of demand elasticity's for the LA/AIDS model: For the LA/AIDS model elasticity derivation are extensively investigated and well documented. Following Green [20] and Buse [21] with respect to ln(x) taking the derivative of equation 64, the expenditure elasticity can be obtained as below:
Taking the derivatives w.r.t to ln (pj), uncompensated own price elasticities (j=1) and cross price elasticities (j ≠ i), eij LA/AIDS , becomes as follow

where δij is Kronecker delta that is 1 if i=j otherwise 0. Sample mean was used in this study for the point of normalization. The compensated price elasticities sij LA/AIDS,, become as follows:

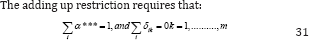
Theoretical consistency: Restrictions can be imposed on the parameters in the LA/AIDS model as follows:
The negativity condition can be tested by estimation of the all compensated own-price elasticity's. By using LA/AIDS the βi parameter determines the effect of a change in real expenditures on the budget share of good i and whether the good is necessity, luxury or an inferior good [22-36]. βi < 0 for a necessity and the expenditure elasticity lies between 0 and 1 (0 < εi < 1). Decrease with increasing total expenditures and for luxury βi > l and the expenditure elasticity is greater than 1 (εi > 1 ), and increases with increasing total expenditures. The expenditure elasticity is less than 0 (εi < 0) for inferior good and βi < 1. It is also possible to examine the complementary and substitutive relations between pairs of goods by estimating the compensated price elasticity’s.
Conclusion
Theoretical consistency is required for specific demand function in any kind of empirical study. Moreover, the selected functional form should be sufficiently simple and flexible. The estimated preferences function has no restrictions on its free parameters to get the required flexibility, and can approximate the second order twice continuously differentiable preference function. On the other hand, for simplicity in the estimation procedure increase in the degree of freedom available can be used as a procedure if the numbers of parameters are limited and the functional form is limited. Furthermore, the complementary or substitution relationship between good is also described by the functional form which allows demand description for necessities, luxuries and inferior commodities [37-50]. A comparative assessment of the demand system selected, the Linear Expenditure System fails to describe consumers demand behavior as specified by Engel's-Law.
With the increasing expenditures, inferior commodities lean towards luxuries which are not plausible. So, for food demand analysis the LES is not appropriate. With utility maximizing behavior the Rotterdam is not consistent even if corresponds- to-generally-accepted-empirical-facts-and-is flexible (e.g.the substitutive or complementary relationship among goods and the description of demand for luxuries, necessities and inferior goods). The parametric restrictions given by AIDS and Indirect Trans log System, theoretical properties of demand function can be imposed. Both systems depict generally empirical facts and are derived from flexible function from. However, estimation process may become difficult due to relatively high number of independent parameters the Indirect Tans log System. Linear Approximate Almost Ideal Demand System is much simpler in estimation and linear in parameters and therefore, LA/AIDS can be widely applied as basic model for empirical studies [51-70].
References
- Siriwardana KMM (2016) State of the Economy as reflected in the Central Bank Annual Report-2015. Central Bank of Sri Lanka.
- CBSL (2014) Annual Report, Central Bank of Sri Lanka.
- Calnaido D (1971) An ecological approach to pest management in tea.
- Senarathne KADW, K Mohotti (2008) Management of Insect and Mite pest in Tea. Tea Research Institute, Talawakelle, Sri Lanka.
- Walgama R, R Pallemulla (2005) The distribution of shot hole borer, xyleborus fornicatus Eichh. (Coleoptera: Scolytidae), across tea-growing areas in Sri Lanka a reassessment.
- Sutherst R (1995) The potential advance of pests in natural ecosystems under climate change: implications for planning and management Impacts of climate change on ecosystems and species: terrestrial ecosystems. 83-98.
- Samways M, P Hitchins, O Bourquin, J Henwood (2010) Tropical island recovery: Cousine island Seychelles. John Wiley & Sons.
- Vitarana SI (2003) 75 Years of Research in Tea Entomology. The Tea Research Institute of Sri Lanka.
- Jayakody JAAM, HW Shyamalie (2002) Cost of Tea Cultivation from Nursery to the Field. Tea Research Institute, Talawakelle, Sri Lanka.
- Danthanarayana W (1970) The Control of Shot-hole borer (Xyleborus fornicatus Eichh.) of Tea. First Annual Report of Research Conducted Under Grant Authorized by.com Public Law 480, Tea Research Institute of Ceylon, Talawakelle.
- Sivapalan P (1975) The dispersion of brood galleries of Xyleborus fornicatus Eichh. (Coleoptera, Scolytidae) in tea plants. Bulletin of Entomological Research 65(3): 501-506.


-

Mark E Smith
Bio chemistry
University of Texas Medical Branch, USA -

Lawrence A Presley
Department of Criminal Justice
Liberty University, USA -

Thomas W Miller
Department of Psychiatry
University of Kentucky, USA -

Gjumrakch Aliev
Department of Medicine
Gally International Biomedical Research & Consulting LLC, USA -

Christopher Bryant
Department of Urbanisation and Agricultural
Montreal university, USA -

Robert William Frare
Oral & Maxillofacial Pathology
New York University, USA -

Rudolph Modesto Navari
Gastroenterology and Hepatology
University of Alabama, UK -

Andrew Hague
Department of Medicine
Universities of Bradford, UK -

George Gregory Buttigieg
Maltese College of Obstetrics and Gynaecology, Europe -

Chen-Hsiung Yeh
Oncology
Circulogene Theranostics, England -
.png)
Emilio Bucio-Carrillo
Radiation Chemistry
National University of Mexico, USA -
.jpg)
Casey J Grenier
Analytical Chemistry
Wentworth Institute of Technology, USA -

Hany Atalah
Minimally Invasive Surgery
Mercer University school of Medicine, USA -

Abu-Hussein Muhamad
Pediatric Dentistry
University of Athens , Greece
