Lupine Publishers Group
Lupine Publishers
Menu
ISSN: 2637-4676
Research Article(ISSN: 2637-4676) 
Determination of Sugar Beet Leaf Spot Disease Level (Cercospora Beticola Sacc.) with Image Processing Technique by Using Drone Volume 5 - Issue 3
Ziya Altas1, Mehmet Metin Ozguven1* and Yusuf Yanar2
- 1Department of Biosystems Engineering, Turkey
- 2Department of Plant Protection, Turkey
Received: November 10, 2018; Published: November 27, 2018
Corresponding author: Mehmet Metin Özgüven, Department of Biosystems Engineering, Turkey
DOI: 10.32474/CIACR.2018.05.000214
Abstract
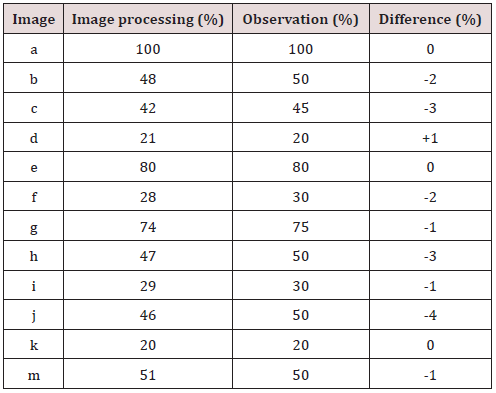
This study was conducted to determine the cercospora leaf spot disease level in the local sugar beets field in Tokat province using the image processing algorithms and to check the maching between the leaf spot disease assessment done by using the image processing algorithms and visual assessment done by expert using disease severity scale. For this purpose, 12 images showing different levels of development of the disease, taken at different times and different natural lighting conditions from the field have been determined by image processing technique using Image Processing Toolbox module of MATLAB program. As a result of the study, the disease severity results acquired; a: 100%, b: 48%, c: 42%, d: 21%, e: 80%, f: 28%, g: 74%, h: 47%, i: 29%, j: 46%, k: 20%, m: 51% with observation results; a: 100%, b: 50%, c: 45%, d: 20%, e: 80% , f: 30%, g: 75%, h: 50%, i: 30%, j: 50%, k: 20% m: 50% have been compared. These values are very close indicates that the study was successfully carried out. In addition, it has been determined that the results of the study using image processing techniques give precise and accurate value that can not be determined by observation.
Keywords: Drones; İmage Processing; Sugar Beet; Leaf Spot Disease; Disease Detection
Introduction
The technical processes emerged in line with the technological advances contribute to the economical, sustainable and productive industry, which are the goals of plant and animal production. Image processing techniques have become an important tool in facilitating agricultural operations and in bringing alternative solutions to the problems that need to be solved or improved. Thanks to the developed algorithms and software, numerous studies have been carried out by researchers on disease, harmful and weed detection, plant identification and detection, determination of plant stresses, yield estimation, determination of obstacles, determination of distances between the rows and row-tops, classification of soil and land cover, estimation of botanical composition, evaluation of vegetation indexes, green area index, determination of plant growth variability, follow-up of product development, followup of root development, modeling of irrigation management practices, determination of soil moisture in plant production, and monitoring of animal development in a herd, movement skill scoring, measurement of body characteristics, determination of body condition score, monitoring body weight, lameness detection, determination of pain locations, body temperature monitoring, location determination in animal production. Examples of these studies are shown in Table 1. the development of real-time and automated expert systems, autonomous tractors or agricultural machines and agricultural robotics applications have been realized, by applying the experience gained during the implementation of image processing techniques in agriculture together with the machine learning, deep learning, artificial intelligence, modeling and simulation applications (Table 2). For this reason, image processing techniques will continue to be one of the most important agricultural research topics in the present and future.
Increasing the quality and productivity of crops in agricultural activities depends on the monitoring the growing plants well and carrying out the necessary operations at the right time. Drone systems, which have a simple technical structure and are easy to use, offer farmers an opportunity to make plans in agricultural activities using their embedded sensors and cameras, providing high quality and 3D images [1]. Image processing techniques are used to extract information from a moving or fixed image captured by a camera or scanner, in digital format, using a number of algorithms. MATLAB and C++ programs are widely used analysis programs today. Color and shape analysis can easily be performed in real-time on digitized objects through these programs [2]. Sugar beet is the most important plant species used in sugar production in the world after sugar cane, and it is a two-year, summer cultivar. In the first year, it creates its root stem under the soil, allowing the sugar yield. In the second year, the plant grows its organs above the earth to form seeds [3]. Sugar beet production contributes to the development of plant and animal production, improves the physical structure of the soil, improves ecological balance, and maximizes the yield of the products to be planted after. For this reason, early detection of diseases and pests in sugar beet farming and the prevention of loss of yield by carrying out the required agricultural pest control are very important [4]. Sugar beet leaf spot disease (Cercospora beticola Sacc.) is one of the most significant, common and harmful fungal diseases affecting sugar beet. Individual leaf spots are almost circular and are 3-5 mm in diameter at maturity. The lesion changes from light brown to dark brown with reddishpurple boundaries depending on the anthocyanin production of the leaf. As the disease progresses, individual spots merge and the severely infected tissue first becomes yellow and then becomes brown and necrotic. Healthy leaves stay green and are less affected or do not contain lesions [5].
Table 2: Examples of studies conducted using the image processing together with different techniques.
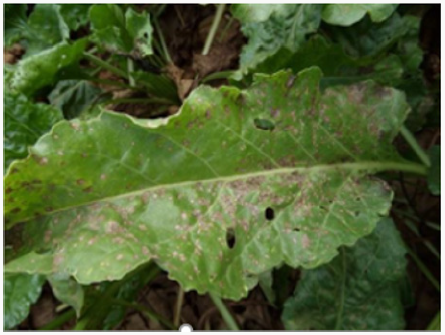
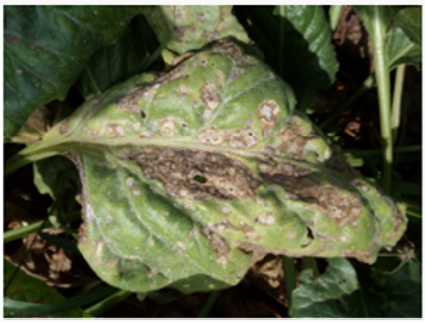
Cercospora beticola Sacc. damages the plant by harming the leaves (Figure 1). The number of spots seen in very small numbers and small rounds initially, increases rapidly and covers the whole leaf surface. As a result, the leaf dries completely and dies. The disease, starting from the outermost leaves of the beet, develops from the outside to the inside, drying all the leaves while the beet constantly blooms new leaves from the body to maintain its vital activities. As a result of this, beet consumes its energy constantly to form new leaves, leading to insufficient polar and beet root growth [6] Cercospora leaf spot is one of the most important diseases of sugar beet both in Turkey and in the world [7-9]. Depending on the severity of the disease in the field, it can cause a loss in sugar yield by 10% to 50% [8,10]. In Turkey, the disease reduces the tuber yield by 6-35% in sugar beet, and sugar yield by 1-26% [11]. In addition, the disease increases the rates of potassium (6%), sodium (25%) and alpha-amino nitrogen (40%), which affect the sugar production from sugar beet negatively [9]. The control of the disease is achieved through integrated pest management programs that include use of tolerant varieties, alternation and fungicide applications [12]. In order for an effective integrated pest management program to be implemented, it is vital to timely and correctly identify the outbreak of the disease, its severity, and its progress in the field. In addition, rapid and accurate identification of disease severity will greatly help reducing the product loss [13].
Traditionally, disease severity in plants is determined visually by experienced specialists using different scales according to type of the disease. In determining the severity of Cercospora leaf spot disease, the 1-9 [14], 1-5 visual scale of Vereijssen et al. [15] or Schmittgen [16] is used. Then, by using Townsend-Heuberger [17] formula, the percentage disease severity is calculated using the values obtained from these scales. These methods are costly and time-consuming methods that require labor, and they can cause mistakes and errors depending on the level of experience of the specialist in plants produced in large areas such as sugar beets and wheatgrass [18]. In order to eliminate these problems, there is a need for faster and practical methods that reduce human errors in the identification of plant diseases, disease severity and progress of the disease, especially in large production areas. In this study, it was aimed to determine the severity of leaf spot disease by using image processing techniques with various algorithms developed, using drone in the field conditions of sugar beet produced in large areas.Materials
Sugar beet leaf spot disease
The study was carried out in a sugar beet field, in the vicinity Tokat-Amasya highway 74th Branch of the Highways Authority, under natural infection conditions. The study was carried out on an area of approximately 200m2, having various levels of disease severity.
The drone used in the study
The drone used in the study is the DJI Phantom 3 Advanced brand, which features a 12-megapixel camera with up to 1080P video recording at 60FPS. In addition, the camera has a 94-degree viewing angle and f/2.8 lens. It can send real-time images in 720p HD format to a smartphone or tablet within approximately 2 km range. There is a GPS positioning system on the drone and it is able to determine its position by scanning the ground level with the aid of ultrasonic sensors. With the autopilot feature, it is able to start its engines fly at a preset altitude. When GPS is active, it can come back to the position it took off with the return button. When the battery is low or when the connection with control is disconnected for any reason, its Failsafe feature returns the drone back to the take-off position for safe landing [19].
Image Processing
MATLAB version R2014a program was used for image processing. MATLAB is a numerical computation and fourth generation programming language. MATLAB allows the processing of matrices, drawing functions and data, applying algorithms, creating a user interface, and interacting with programs written in other languages, including C, C ++, Java, and Fortran languages. The power that MATLAB brings to the field of digital image processing is the broad set of functions for processing multidimensional arrays of image features. Image processing was performed using the Image Processing Toolbox module of the MATLAB program. Image Processing Toolbox is a collection of functions that extend the capacity of the MATLAB digital computing environment. These functions and the expressive power of the MATLAB language make it easy to write image processing operations compactly and clearly, thus providing an ideal software prototyping environment for solving image processing problems.
Methods
Detection of the Disease
Leaf spot disease in sugar beet is determined by local observations made by plant protection experts. Local disease assessments were made by the expert according to the 0-9 scale given in Table 3 [14] and the visual scale given in Figure 2. Images were taken from a height of 30-60 cm using the camera system installed on the drone. Then, disease severity was calculated according to the Townsend-Heuberger formula using the disease severity values obtained by the terrestrial observations [17,20]. The equation used for the calculation of disease severity percentage is: “Disease severity (%) = Σ (n x V/Z x N) x 100”. Where, n: number of plants with different disease severity in the scale, V: scale value, Z: the highest scale value, N: observed total number of plants”. The images taken with the drone were processed with the developed image processing algorithms and disease rates at leaf and plant level were calculated [21-29]. As a result, the compatibility between the two methods was determined by comparing the values of disease severity obtained by image processing with the terrestrial values in the direction of the goals of the study [30-41].
Taking Images
Sugar beet is a summer season culture plant grown in two years. It is planted at the end of March and harvested in early October. In climatic conditions of Tokat, the first infections of the disease appear in May-June, and the disease continues to damage plants throughout the entire production season. The disease is most intense in August [42-48]. For this reason, images were taken between August and September 2016, when the disease was most intense. Images were obtained using Drone under natural lighting conditions. The first image was taken on August 10, 2016, and a total of images were taken every 15 days until the end of September. of the images taken at 4000x2250 pixel resolution under natural lighting conditions on the August 7, August 25 and 7th of September in the study, 12 images showing different development levels of the disease in sampling area were processed [49-52]. Since all the leaves were dead, images taken on 22nd of September were not subjected to image processing. Preliminary studies have shown that sunlight and shadows adversely affect plant images taken under natural lighting conditions in field, if the drone’s flying height exceeds 60 cm images. For this reason, images were taken at distances of about 30-60 cm since the plant lengths and plant-drone distances differ as well.
Sugar Beet Leaf Image Disease Segmentation
Leaf image disease segmentation, which is the most important process in diagnosing the disease, tries to classify pixels into K classes according to a series of features by using typical algorithms such as K-means clustering [53,54]. In this study, K-means clustering algorithm was used to identify disease using the diseased leaf images. Algorithm steps are given below.
a) Step 1: Data entry; sugar beet leaf images taken from the field are entered into the program. The leaf images are RGB images in JPEG format as shown in Figure 3.
b) Step 2: Each image is converted from RGB color space to L*a*b* color space since the color space to be worked limits the image distortions caused by brightness while working with color. The disease information in L*a*b* color space is stored in only two channels (a* and b* components).
c) Step 3: Classification; The colors in the “a*b*” area is classified using K-means clustering. Pixels in the diseased image (colors carried with “a*” and “b*” values) clustered with K-means using euclidean distance.
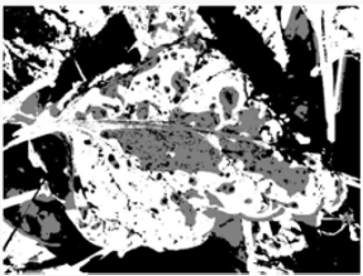
d) Step 4: Pixel tagging; Each pixel in the image is tagged using the results from the K-means clustering. For each pixel in the input, the K-means returns an index that corresponds to a cluster. As shown in Figure 4, each pixel in the image was tagged with cluster index.
e) Step 5: Separating the diseased leaf image according to the color, using pixel tags, the pixels in the image are separated by color, resulting in three images (i.e., K = 3) as shown in Figure 5.
Figure 5: K-means cluster segmentation of diseased leaf image: (A) black segment; (B) green segment; (C) brown segment (disease image).

f) Step 6: The diseased image is selected among three clusters.
Contrast Enhancement
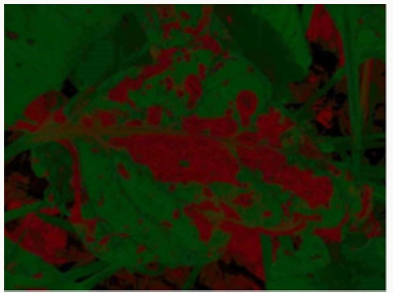
Contrast enhancement of color images is typically carried out by transforming intensity component of a color image [55-60]. Such a color space is L*a*b*. Color conversion functions were used to convert the image from RGB to L*a*b* color space, and then worked on the brightness (L*) layer of the image. The brightness layer is replaced by the processed data, and then the image is converted into the RGB color space (Figure 6). Brightness alignment affects the density of the pixels while preserving the original colors.
Determination of the Severity of the Disease
The diseased areas on the leaf is calculated by dividing the number of pixels constituting those areas by the total number of pixels forming the leaf [61-65], hence its proportion on the leaf indicates the severity of the disease. Let B (x,y) expresses the value at row x and column y of an image having m rows and n columns. Then, area of the kth object can be found by the following equations.
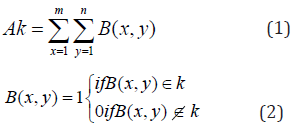
Ak = area of the object on the picture (diseased area)
B(x,y) = value at given row and column of the image recognized (xth row, yth column)
Disease severity (%) = Ak / Total Area (3)
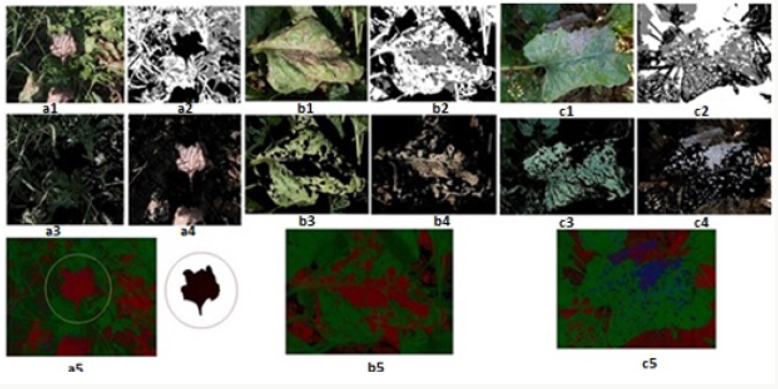
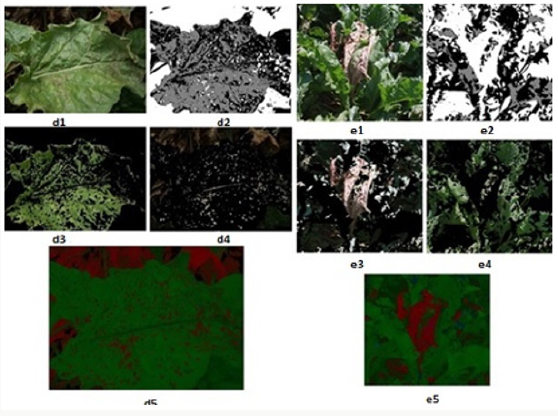
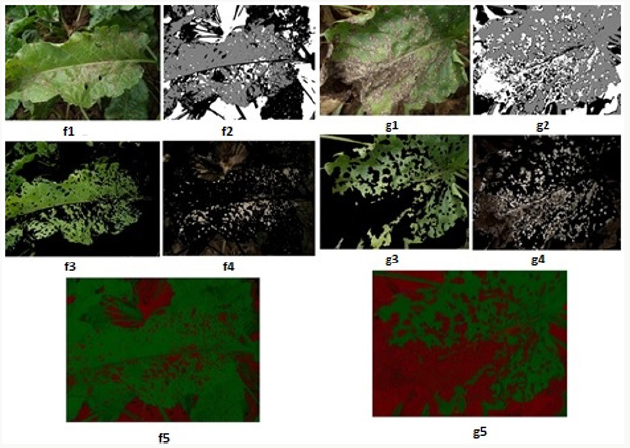
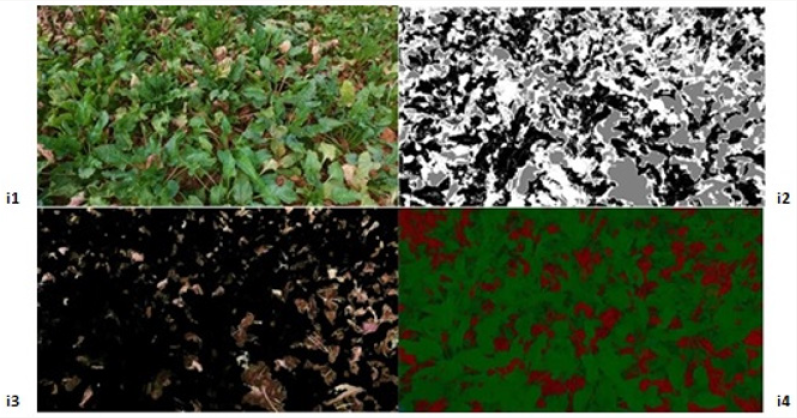
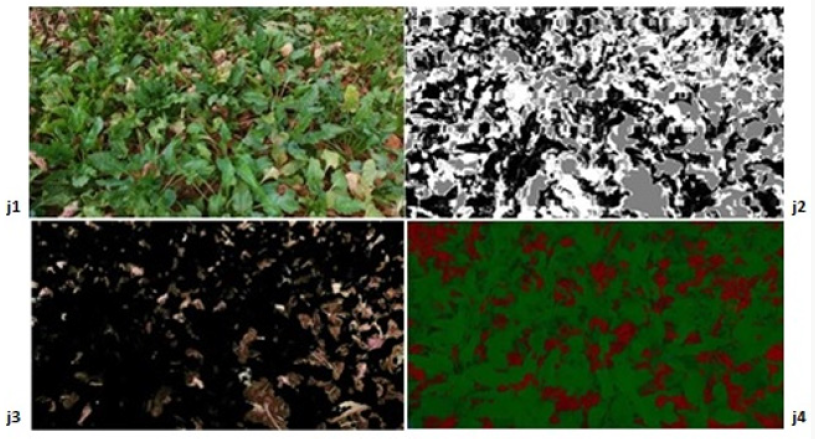
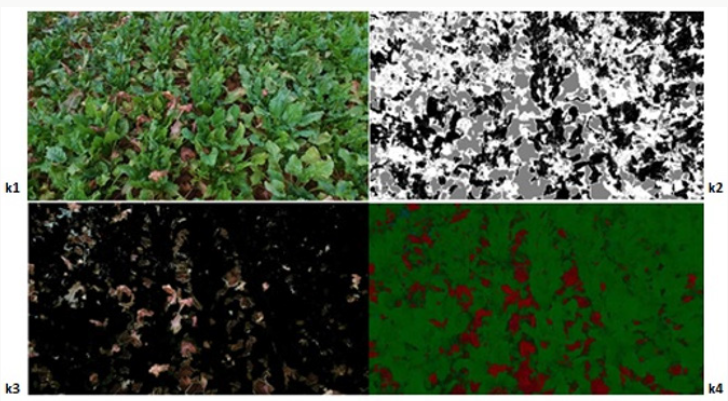
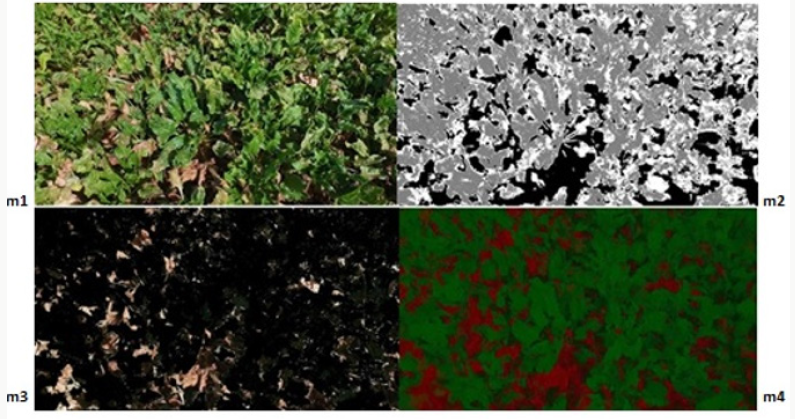
Within the scope of the specified method [66-69], 12 images showing different levels of development of the disease in the sampling area were processed using the developed algorithms, and the image processing results obtained are given below. The original images in JPEG format are shown in Figures 7-14 with (1), and the pixel tagging results on colors classified by K-means clustering are shown with (2). After the clustering process, the images were separated into color components: (3) showing the green component of the plant [70-73], (4) showing the brown parts, indicating the disease. Then, the number 5 shows the contrast enhanced images, processed with algorithms developed to make the green parts and diseased parts of the plant more apparent. The spatial image processing results are shown from h to m, where 1 shows the original image, 2 shows the pixel labeling image after clustering, 3 shows the brown [74,75], diseased parts among the color separated images, and 4 shows the contrast enhanced images of the brown parts.
Conclusion
In the study, the Image Processing Toolbox module of the MATLAB program was used to see whether there is a sugar beet leaf spot disease (Cercospora Beticola Sacc), and disease severity in 12 images showing different development levels of the disease in the sampling area. The results obtained are presented in Table 4. When Table 4 is examined, it is seen that the study results obtained using the drone system and image processing technique and the results obtained by observation are very close to each other. These quite close results indicate the success of the study. In addition, it was determined that the evaluation results obtained by observation are approximate, integer values and that the results of the study obtained using image processing techniques give the precise value of diseased area with the sensitivity that cannot be achieved by observation.
In this study, the fact that the image processing techniques applied on the images taken by the camera attached to the drone identified the diseased areas precisely suggests that it can be used for disease identification as an alternative to the observation method, and that may be preferable since it gives exact values. This study puts forth that labor and time losses can be prevented and diseases on the plants can be effectively controlled throughout the whole season thanks to the success of the method and ease of observation through drones in the field for disease identification, by taking images without disturbing the field. Thus, yield losses due to disease in sugar beet, which contributes greatly to the country economy, will be prevented through necessary pest management carried out timely.
It is believed that the study will contribute significantly to agricultural activities with its unique design, conducted in the field under natural lighting conditions, instead of a closed laboratory environment. The successful identification of leaf spot disease in sugar beets in the study suggests that the method can be used in applications such as plant growth monitoring, yield determination, disease and pest detection in different plant species. Since it has been shown that sunlight and shadows adversely affect plant images taken under natural lighting conditions in field, if the drone’s flying height exceeds 60 cm images, images in the study were taken at distances of about 30-60 cm since the plant lengths and plant-drone distances differ as well. These heights determined in the study are believed to be helpful for the researchers who will conduct similar studies in the future.
References
- Tan M, Özgüven MM, Tarhan S (2015) The Use of Drone Systems in Precision Agriculture, 29th Agricultural Mechanization Congress and Energy Congress, 2-5 September Diyarbakır S:543-547.
- Kahya E, Arın S (2014) A Research on Determination of Fruits on Branch with Image Processing. Hasad Magazine pp. 80-84.
- Geçit HH, Çiftçi CY, Emeklier HY, İkincikarakaya S, Adak MS (2011) Field Crops (Corrected Second Edition). Ankara University Faculty of Agriculture Publications. No: 1588, Textbook: 540, Ankara.
- Anonymous (2015) http://www.cinarziraat.com/haberler/sekerpancarinin- ulke-ekonomisindeki-yeri-ve-uretimi.html.
- Whitney ED, Duffus JE (1991) Compendium of Beet Diseases and Insects. The American Phyto pathological Society USA S: 8.
- Soylu S, Boyraz N, Zengin M, Şahin M, Değer T, et al. (2012) Crop Production Farmer’s Guide. Konya Sugar Inc. Konya, Turkey.
- Weiland J, Koch G (2004) Sugar Beet Leaf Spot Disease (Cercospora beticola Sacc) Molecular Plant Pathology 5 (3): 157-166.
- Mohamed FR, Smith K, Larry J (2005) Evaluating Fungicides for Controlling Cercospora Leaf Spot on Sugar Beet. Crop Protection. 24(1): 79-86.
- Kaya R (2011) Sugar Beet Diseases and Struggle. Candy Institute Seminar Notes, pp. 25.
- Rossi V (1995) Effect of Host Resistance in Decreasing Infection Rate of Cercospora Leaf Spot Epidemics on Sugarbeet. Phytopathologia Mediterranea 34(3): 149-156.
- Özgür OE (2003) Sugar Beet Diseases in Turkey. General Directory of Turkish Sugar Factories Inc. Publication 219: 192.
- Karaoglanidis GS, Ioannidis PM, Thanassoulopoulos CC (2001) Influence of Fungicide Spray Schedules on The Sensitivity of Cercospora Beticola to The Sterol Demethylation Inhibiting Fungicide Flutriafol. Crop Protection 20(10): 941-947.
- Bock CH, Poole GH, Parker PE, Gottwald TR (2010) Plant Disease Severity Estimated Visually, by Digital Photography And Image Analysis and by Hyperspectral Imaging. Critical Reviews in Plant Sciences 29(2): 59-107.
- Anonymous (2017a) Plant Medicine Standard Drug Trial Methods. TAGEM Department of Plant Health Research.
- Vereijssen J, Schneider JHM, Termorshuizen AJ, Jeger MJ (2003) Comparison of Two Disease Assessment Keys to Assess Cercospora Beticola in Sugar Beet Crop Protection 1: 201-209.
- Schmittgen S (2014) Effects of Cercospora Leaf Spot Disease on Sugar Beet Genotypes with Contrasting Disease Susceptibility. Forschungszentrum Jülich. Energie & Umwelt/Energy& Environment Band pp. 244.
- Townsend GK, Heuberger JW (1943) Methods for Estimating Losses Caused by Diseases in Fungicide Experiments. Plant Dis Reptr 27(17): 340-343.
- Mutka AM, Bart RS (2015) Image Based Phenotyping of Plant Disease Symptoms. Frontiers in Plant Science 5: 734.
- Anonymous (2017b) Phantom 3 Advanced Manual. DJI Innovations.
- Bora T, Karaca İ (1970) Measurement of Disease and Damage in Cultures. Ege University Faculty of Agriculture Supplementary Course Book No 52(2): 169-179.
- Aggelopoulou AD, Bochtis D, Fountas S, Swain KC, Gemtos TA, et al. (2011) Yield Prediction in Apple Orchards Based on Image Processing. Precision Agriculture. 12(3): 448-456.
- Ashan Salgadoe AS, Robson AJ, Lamb DW, Dann EK, Searle C (2018) Quantifying The Severity of Phytophthora Root Rot Disease in Avocado Trees Using Image Analysis. Remote Sensing 10(2:) 226.
- Astrand B, Baerveldt AJ (2002) An Agricultural Mobile Robot with Vision Based Perception for Mechanical Weed Control. Autonomous Robots. 13(1) 21-35.
- Behmann J, Steinrücken J, Plümer L (2014) Detection of Early Plant Stress Responses in Hyperspectral Images. ISPRS Journal of Photogrammetry and Remote Sensing 93: 98-111.
- Bendig J, Bolten A, Bareth G (2013) UAV Based Imaging for Multi Temporal, Very High Resolution Crop Surface Models to Monitor Crop Growth Variability. Photogrammetrie Fernerkundung Geoinformation, PFG. 2013(6): 551-562.
- Bhange M, Hingoliwala HA (2015) Smart Farming: Pomegranate Disease Detection Using Image Processing. Procedia Computer Science 58: 280- 288.
- Burgos Artizzu XP, Ribeiro A, Guijarro M, Pajares G (2011) Real Time Image Processing For Crop Weed Discrimination In Maize Fields. Computers and Electronics in Agriculture 75(2): 337-346.
- Candiago S, Remondino F, De Giglio M, Dubbini M, Gattelli M (2015) Evaluating Multispectral Images and Vegetation Indices for Precision Farming Applications from UAV Images. Remote Sensing 7(4): 4026- 4047.
- Camargoa A, Smith JS (2009) An Image Processing Based Algorithm to Automatically Identify Plant Disease Visual Symptoms. Biosystems Engineering 102(1): 9-21.
- Christiansen P, Nielsen LN, Steen KA, Jørgensen RN, Karstoft H (2016) Deep Anomaly Combining Background Subtraction and Deep Learning for Detecting Obstacles and Anomalies in an Agricultural Field. Sensors 16(11) 1904.
- Coffey M, Bewley J (2014) Precision Dairy Farming.
- Ding W, Taylor G (2016) Automatic Moth Detection from Trap Images for Pest Management. Computers and Electronics in Agriculture. 123: 17-28.
- Düzgün D, Or ME (2009) Use of Thermal Cameras in Veterinary Medicine in Medicine. TUBAV Science 2(4): 468-475.
- Fuentes A, Yoon S, Kim SC, Park DS (2017) A Robust Deep Learning Based Detector for Real-Time Tomato Plant Diseases and Pests Recognition. Sensors.
- García Mateos G, Hernández Hernández JL, Escarabajal Henarejos D, Jaén Terrones S, Molina Martínez JM (2015) Study and Comparison of Color Models for Automatic Image Analysis in Irrigation Management Applications. Agricultural Water Management. 151: 158-166.
- Grinblat GL, Uzal LC, Larese MG, Granitto PM (2016) Deep Learning for Plant Identification Using Vein Morphological Patterns. Computers and Electronics in Agriculture 127: 418-424.
- Guerrero JM, Pajares G, Montalvo M, Romeo J, Guijarro M (2012) Support Vector Machines for Crop/Weeds Identification in Maize Fields. Expert Systems with Applications. 39(12): 11149-11155.
- Guerrero JM, Guijarro M, Montalvo M, Romeo J, Emmi L (2013) Automatic Expert System Based on Images for Accuracy Crop Row Detection in Maize Fields. Expert Systems with Applications 40(2): 656-664.
- Hoffmann G, Schmidt M (2015) Monitoring the Body Temperature of Cows and Calves with A Video-Based Infrared Thermography Camera. Precision Livestock Farming Applications. (Editor Halachmi I) Wageningen Academic Publishers the Netherlands.
- Kaneda Y, Shibata S, Mineno H (2017) Multi Modal Sliding Window- Based Support Vector Regression for Predicting Plant Water Stress. Knowledge Based Systems. 134: 135-148.
- Kussul N, Lavreniuk M, Skakun S, Shelestov A (2017) Deep Learning Classification of Land Cover and Crop Types Using Remote Sensing Data. IEEE Geoscience and Remote Sensing Letters, 14(5).
- Liu T, Chen W, Wu W, Sun C, Guo W, et al. (2016) Detection of Aphids in Wheat Fields Using A Computer Vision Technique. Biosytems Engineering 141: 82-93.
- Mahlein AK, Rumpf T, Welke P, Dehne HW, Plümer L, et al. (2013) Development of Spectral Indices for Detecting and Identifying Plant Diseases. Remote Sensing of Environment 128: 21-30.
- Marié CL, Kirchgessner N, Marschall D, Walter A, Hund A (2014) Rhizoslides Paper Based Growth System for Non-Destructive, High Throughput Phenotyping of Root Development by Means of Image Analysis. Plant Methods 10: 13.
- Montalvo M, Pajares G, Guerrero JM, Romeo J, Guijarro M, et al. (2012) Automatic Detection of Crop Rows in Maize Fields with High Weeds Pressure. Expert Systems with Applications. 39(15): 11889-11897.
- Moorehead SJ, Wellington CK, Gilmore BJ, Vallespi C (2012) Automating Orchards: A System of Autonomous Tractors for Orchard Maintenance.
- Nagasaka Y, Tamaki K, Nishiwaki K, Saito M, Kikuchi Y, et al. (2013) A Global Positioning System Guided Automated Rice Transplanter. 4th IFAC Conference on Modelling and Control in Agriculture, Horticulture and Post Harvest Industry. pp. 27-30.
- Noguchi N, Kise M, Ishii K, Terao H (2002) Field Automation Using Robot Tractor. Proceedings of Automation Technology for Off Road Equipment. pp. 239-245.
- Opstad Kruse OM, Prats Montalbán JM, Indahl UG, Kvaal K, Ferrer A, et al. (2014) Pixel Classification Methods for Identifying and Quantifying Leaf Surface Injury from Digital Images. Computers and Electronics in Agriculture. 108: 155-165.
- Pilarski T, Happold M, Pangels H, Ollis M, Fitzpatrick K, Stentz A (2002) The Demeter System for Automated Harvesting. Autonomous Robots 13: 19-20.
- Poursaberi A, Bahr C, Pluk A, Van Nuffel A, Berckmans D (2010) Real time Automatic Lameness Detection Based on Back Posture Extraction in Dairy Cattle: Shape Analysis of Cow With İmage Processing Techniques. Computers and Electronics in Agriculture 74(1): 110-119.
- Pradana ZH, Hidayat B, Darana S (2016) Beef Cattle Weight Determine by Using Digital Image Processing. The 2016 International Conference on Control, Electronics, Renewable Energy and Communications (ICCEREC).
- Pujari J D, Yakkundimath R, Byadgi AS (2015) Image Processing Based Detection of Fungal Diseases in Plants. Procedia Computer Science 46: 1802-1808.
- Reis MJCS, Morais R, Peres E, Pereira C, Contente O, et al. (2012) Automatic Detection of Bunches of Grapes in Natural Environment from Color Images. Journal of Applied Logic 10(4): 285-290.
- Robinson DA, Abdu H, Lebron I, Jones SB (2012) Imaging of Hill Slope Soil Moisture Wetting Patterns in A Semi Arid Oak Savanna Catchment Using Time Lapse Electromagnetic Induction. Journal of Hydrology 416- 417: 39-49.
- Romeo J, Pajares G, Montalvo M, Guerrero JM, Guijarro M, et al. (2013) A New Expert System for Greenness Identification in Agricultural Images. Expert Systems with Applications 40(6): 2275-2286.
- Rumpf T, Mahlein AK, Steiner U, Oerke EC, Dehne HW, et al. (2010) Early Detection and Classification of Plant Diseases with Support Vector Machines Based on Hyperspectral Reflectance. Computers and Electronics in Agriculture 74(1): 91-99.
- Salau J, Haas JH, Junge W, Leisen M, Thaller G (2015) Development of a Multi Kinect System for Gait Analysis and Measuring Body Characteristics in Dairy Cows. Precision Livestock Farming Applications. (Editor Halachmi I) Wageningen Academic Publishers the Netherlands.
- Singh V, Misra AK (2017) Detection of Plant Leaf Diseases Using Image Segmentation and Soft Computing Techniques. Information Processing in Agriculture 4(1): 41-49.
- Skovsen S, Dyrmann M, Mortensen AK, Steen KA, Green O, et al. (2017) Estimation of The Botanical Composition of Clover-Grass Leys From RGB Images Using Data Simulation and Fully Convolutional Neural Networks. Sensors 17: 2930.
- Subramanian V, Burks TF, Arroyo AA (2006) Development of Machine Vision and Laser Radar Based Autonomous Vehicle Guidance Systems for Citrus Grove Navigation. Computers and Electronics in Agriculture 53: 130-143.
- Takai R, Noguchi N, Ishii K (2011) Autonomous Navigation System of Crawler Type Robot Tractor. Preprints of the 18th IFAC World Congress. Paper No. pp. 3355.
- Tellaeche A, Pajares G, Burgos Artizzu XP, Ribeiro A (2011) A Computer Vision Approach for Weeds Identification Through Support Vector Machines. Applied Soft Computing 11(1): 908-915.
- Trotter MG, Lamb DW, Hinch GN, Guppy CN (2010) GNSS Tracking of Livestock Towards Variable Fertilizer for the Grazing Industry. 10th International Conference on Precision Agriculture. 2010 18-21 July, Denver, USA.
- Van Henten EJ, Hemming J, Van Tuijl BAJ, Kornet JG, Meuleman J, et al. (2002) An Autonomous Robot for Harvesting Cucumbers in Greenhouses. Autonomous Robots. 13(3): 241-258.
- Verger A, Vigneau N, Chéron C, Gilliot JM, Comar A, et al. (2014) Green Area Index from an Unmanned Aerial System Over Wheat and Rapeseed Crops. Remote Sensing of Environment 152: 654-664.
- VijayaLakshmi B, Mohan V (2016) Kernel Based PSO and FRVM: An Automatic Plant Leaf Type Detection Using Texture, Shape, And Color Features. Computers and Electronics in Agriculture 125: 99-112.
- Yamamoto K, Togami T, Yamaguchi N (2017) Super Resolution of Plant Disease Images for The Acceleration of Image Based Phenotyping and Vigor Diagnosis in Agriculture. Sensors. 17(11): 2557.
- Yang C, Everitt JH, Du Q, Luo B, Chanussot J (2013) Using High Resolution Airborne and Satellite Imagery to Assess Crop Growth and Yield Variability for Precision Agriculture. Proceedings of the IEEE. 101(3).
- Zhang M, Meng Q (2011) Automatic Citrus Canker Detection from Leaf Images Captured in Field. Pattern Recognition Letters. 32(15): 2036- 2046.
- Zhang S, Wu X, You Z, Zhang L (2017) Leaf Image Based Cucumber Disease Recognition Using Sparse Representation Classification. Computers and Electronics in Agriculture 134: 135-141.
- Zhang S, Wang H, Huang W, You Z (2018) Plant Diseased Leaf Segmentation and Recognition by Fusion of superpixel, K Means and PHOG Optik 157: 866-872.
- Zhou R, Damerow L, Sun Y, Blanke MM (2012) Using Colour Features of Cv Gala Apple Fruits in an Orchard in Image Processing to Predict Yield. Precision Agriculture 13(5): 568-580.
- Zhou R, Kaneko S, Tanaka F, Kayamori M, Shimizu M (2014) Disease Detection of Cercospora Leaf Spot in Sugar Beet by Robust Template Matching. Computers and Electronics in Agriculture 108: 58-70.
- Zhu L Q, Ma MY, Zhang Z, Zhang PY, Wu W, et al. (2017) Hybrid Deep Learning for Automated Lepidopteran Insect Image Classification. Oriental Insects 51(2): 79-91.

Top Editors
-

Mark E Smith
Bio chemistry
University of Texas Medical Branch, USA -

Lawrence A Presley
Department of Criminal Justice
Liberty University, USA -

Thomas W Miller
Department of Psychiatry
University of Kentucky, USA -

Gjumrakch Aliev
Department of Medicine
Gally International Biomedical Research & Consulting LLC, USA -

Christopher Bryant
Department of Urbanisation and Agricultural
Montreal university, USA -

Robert William Frare
Oral & Maxillofacial Pathology
New York University, USA -

Rudolph Modesto Navari
Gastroenterology and Hepatology
University of Alabama, UK -

Andrew Hague
Department of Medicine
Universities of Bradford, UK -

George Gregory Buttigieg
Maltese College of Obstetrics and Gynaecology, Europe -

Chen-Hsiung Yeh
Oncology
Circulogene Theranostics, England -
.png)
Emilio Bucio-Carrillo
Radiation Chemistry
National University of Mexico, USA -
.jpg)
Casey J Grenier
Analytical Chemistry
Wentworth Institute of Technology, USA -
Hany Atalah
Minimally Invasive Surgery
Mercer University school of Medicine, USA -

Abu-Hussein Muhamad
Pediatric Dentistry
University of Athens , Greece

The annual scholar awards from Lupine Publishers honor a selected number Read More...


