Lupine Publishers Group
Lupine Publishers
Menu
ISSN: 2637-4676
Research Article(ISSN: 2637-4676) 
Determination of Additional Parameters for Screening of Different Tea Cultivars against Shot Hole Borer: Comparative Assessment on Relationship of Plant Growth Parameters with Galleries in the Stem Volume 1 - Issue 4
Asanka Tennakoon1*, R Rajapakse1, K Mohotti2, A Mannakkara1, RHK Rathnappriya1, Salinda Sandamal1
- 1Faculty of Agriculture, University of Ruhuna, Sri Lanka
- 2Tea Research Institute, Talawakelle, Sri Lanka
Received: March 13,2018; Published: March 20,2018
Corresponding author: Asanka Tennakoon, Faculty of Agriculture, University of Ruhuna, Sri Lanka
DOI: 10.32474/CIACR.2018.01.000117
Abstract
Shot whole borer (Xyleborusfornicatus Eichh.) (SHB) is considered as the most serious and economically important pest in tea plantations in Sri Lanka. Present study was done to determine the parameters for screening of different tea cultivars against SHB. Prune time assessments on plant growth parameters of plant breeding trials were used to correlate data on galleries per 30cm in the laboratory bioassay to determine their relationship on SHB infestation in tea. A set of new tea cultivars with known tolerant and susceptible cultivars were used in the study. The regression analysis indicated that the intermodal length, mean number of prune cuts and mean prune weight had a significant positive relationship (P<0.05) with SHB infestation and those could be considered as valid parameters for cultivar screening against SHB in tea. Formulated multiple regression model [Galleriesper 30cm units= (-8.27)+(0.1183 X1)+(1.987 X2), where; X1-mean number of prune cuts, X2-internodal length], was significant (P=0.007) and it explained 56.05% variation of galleries per 30cm (R2=56.05%). Mean number of galleries per 10cm stem had a significant (P<0.05) positive relationship (0.65) and the model explained 41.62% variation of galleries per foot (R2=41.62%).
Keywords: Cultivar Screening; Plant growth parameters; Shot hole borer; Tea
Introduction
Tea, Camellia sinensis (L.) o. Kuntze, is the main export crop and the second largest foreign exchange earner in Sri Lanka. Contribution of Tea to GDP of Sri Lanka is 2.6% [1,2]. Tea, which is grown in monoculture with shade trees, cover crops, mulches and hedgerows, provides a suitable environment for pests [3] to breed, disseminate and feed. Factors like weather changes, management practices, weeds, pest and diseases create stress conditions to Tea crop and affect its growth, yield quality, quantity and sustainability. In Sri Lanka, pests attack to Tea has become a severe problem as it would directly affect the yield and influence the national GDP in return. A wide range of insects (46 species) and mites (5 species) have been recorded as pests, causing damage to Tea at varying degrees [4]. Shothole borer (XyleborusfornicatusEichh.) (SHB) is the most serious and economically important perennial pest of Tea plantations in Sri Lanka [5], and has remained in nearly two thirds of the country's tea lands. Severe damage is evident in growing areas between elevations of 600-1200m [5].
As variations in the temperature and other climatic variables strongly influence their density and extent of population, they may exhibit some modifications to response the climate change [6]. SHB is a small beetle belonging to the family Scolytidae [7]. Larvae of these wood-boring beetles feed on the ambrosia fungus, Monacrosporiumambrosium [8]. Young mature female beetles make fresh galleries on young maturing Tea stems of pencil thickness after an initial dispersal flight. During plucking and other management practices, weakened branches break at the points where galleries are formed. These broken ends and prune cuts with remnant unprotected borer galleries serve as avenues for the entry of wood rotting fungi and subsequent termite infestations which lead to direct, indirect and long term loss of crop. SHB management occupies the highest cost from the total cost of production in Tea. SHB management is important mainly because of the mechanical stress and long-term secondary damages that it can cause, such as debilitation of branches resulting from wood rot. As chemical pests control poses various limitations due to nature of the pest as well as restrictions in the use of pesticides, screening and selection of tolerant cultivars would be an ideal solution. However, the conventional cultivar screening approach involves only exclusion of susceptibility in the absence of harnessing any growth measurements. It only screens the degree of damage sustained by using randomly selected bushes per replicate per cultivar [9].
Tolerance mechanismsrelatedphysiological orgrowth responses of the Tea plant due to SHB damage have many relationships and interactions with its biotic and abiotic environment. Therefore, determination of a relationship among Tea plant and the SHB attack is important when improving the cultivar screening methods. Some Tea cultivars recommended as tolerant for SHB using the existing screening method, may not behave as it is under field conditions. In some regions, Tea cultivars known to be tolerant have showed higher susceptibility to SHB. Reasons may be external factors such as soil nutrient content, plant health and vigor, climatic variations and pest pressure. Hence, an improvement of the existing method by using relationship of growth parameters with SHB attack would be a valuable finding to the industry. Present study was carried out with the following objectives of determination of additional parameters for cultivar screening against SHB in Tea; identification of convenient short cut method for cultivar screening against SHB and confirmation and validation of the susceptibility and tolerance of selected cultivars with known tolerance levels against SHB.
Material and Methods
The methodology of the study was consisted with two parts as; covering, monitoring and assessments of field data and laboratory bioassays with SHB.
Experimental site
Field trials were conducted at Field No.1 of St. Joachim Tea Estate, Rathnapura, Sri Lanka, which consists of the test cultivars; cultivar codes of 294, 29, 613, 139, 163, 142, 133, 62, 131, 151, 57, 107, 4, 12, 10, 1, 23/5, 10/1, 12/11 (5000 Series) and the standard cultivars; cultivar codes of TRI 2023, TRI 2027 (Tolerant), TRI 2025, TRI 2026 (Susceptible) and TRI 4042 (Moderately Tolerant).
Prune time assessments
Data on prune time assessments of test cultivars grown in Field No.1, St. Joachim Estate were obtained. Field establishment has done in July 1997 and the data were taken at second pruning; June 2006. Galleries per 30 cm unit: Samples were taken from different tea cultivars in separate plots maintained by Plant Breeding Division. Twenty bushes were randomly selected from plot at the time of pruning; five stems that approximately pencil thickness and 30 cm length were randomly taken to assess the number of galleries per stem. Means were calculated and mean number of galleries per 30 cm units was obtained. Mean number of prune cuts: Number of prune cuts was counted in prune cut surface of the bush and the mean value was calculated. Mean yield (kg of Made Tea/ha/yr): Data on yield of cultivar in different locations of plant breeding division trials was recorded weekly throughout the year. Cultivars used for plant breeding division trials were obtained from Deniyaya, Sri Lanka; cultivar codes of 62, 139, 613, 23/5, 12, 10, 4, 57, 1(LVP 75), TRI 2027, 133, 131 and Cicilton, Sri Lanka; cultivar codes of142, 10/1, 107, 4042, 12/11, 294, 163, 151, 29, TRI 2026. Mean yield were extrapolated as kg of Made Tea/ha/yr. Mean prune weight (kg/bush): Prune weight of each bush was taken separately in each cultivar and the mean value was calculated.
Assessment of growth parameters
Samples were drawn from plots consisting of 20 bushes of each test cultivar. Five shots from each plant were collected from randomly selected five bushes. Following growth parameters were assessed for Tea cultivars established in separate plots mentioned under section 2.1.Internodal length of 5th and 6th leaves and, bark thickness and stem diameter related to that intermodal length were measured by avoiding the succulent portion. After removing the succulent portion, mean number of nodes per shoot were counted.
Laboratory bioassay to screening of Tea cultivars against SHB using improved glass jar method
Laboratory bioassay was conducted using test cultivars mentioned under section 2.1, at Tea Research Institute (TRI), Talawakelle, Sri Lanka, during the period of August - November 2015. Healthy stems of 10 cm length and approximately in pencil thickness (1cm) were collected from bushes of the selected twenty- four cultivars. Experimental plots have been pruned before one and half years. TRI 2025 (the most susceptible) and TRI 2023 (the most tolerant) were taken as the standards. Freshly emerged, fertilized female SHB beetles were collected from infested Tea branches of Field No. 20, Nayapane Estate, Pussellawa, Sri Lanka and mass reared in culture tubes using artificial diet media adopted by [8], at TRI, Thalawakelle. Female beetles waiting at the top of the tubes (entangled in the cotton plug), were considered as already fertilized within the parent gallery and ready to make their dispersal flight. Among the collected beetles, actively moving females with bright black body colour and equal body size were used for the bioassay.
Test cultivars of cultivar codes; 294, 29, 613, 139, 163, 142, 133, 62, 131, 151, 57, 107, 4, 12, 10, 1, 23/5, 10/1, 12/11 (5000 Series) and standard cultivars of cultivar codes; TRI 2023, TRI 2027 (Tolerant), TRI 2025, TRI 2026 (Susceptible) and TRI 4042 (Moderately Tolerant) were used for the bioassay. Tea stems of 10 cm long and 0.95 cm diameter at both ends; from each cultivar were exposed to 15 healthy female beetles obtained from cultures, and replicated 10 times. Number of galleries formed and number of nibble points were recorded after 10 days.
Statistical Analysis
Recorded data on growth parameters were analyzed using Statistical Package Mini Tab 17. Correlation between plant parameters gathered in field experiment and galleries per 30cm units in stems examined in the laboratory bioassay were analyzed to evaluate relationship between them. Growth parameters, which were significant, were used to run subset multiple regressions to fit the model for galleries per 30cm units. Results of the bioassay (Mean No. of Galleries) were taken to correlate with field experiment data (galleries per 30cm units) to identify the relationship among short cut method (improved glass jar method) with field experiment data. Cluster analysis was done to confirm and validate the susceptibility and tolerance of selected cultivars with known tolerance levels against SHB. Field and laboratory infestation data were used for the analysis.
Results and Discussion
In this study, the prune time assessment data collected from LVP 75 trial on growth parameters were statistically evaluated using correlation, simple linear regression analysis and multiple regression analysis. Correlation between plant parameters and galleries per 30cm unit in stems were analyzed to evaluate relationship between them.
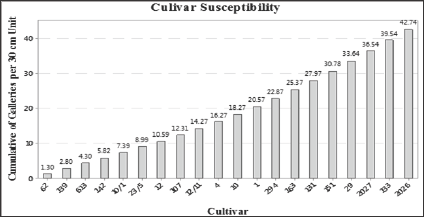
Figure 1: Galleries per 30 cm unit in different tea cultivars.

Prune Time Assessment
Galleries per 30cm
Galleries per 30 cm unit is the most reliable parameter to measure the SHB infestation. Method of sampling should be done based on the pest behaviour. SHB is a tiny beetle, which have no ability to fly a long distance. So that, the pest was cantered only over few locations even a single plot. Therefore, blocking of the plot and collecting of samples randomly from blocks was done. Galleries per 30cm unit values in different cultivars were shown in Figure! Mean number of prune cuts: There was a significant (p=0.028) correlation (r=0.49) between mean number of prune cuts and galleries per 30cm unit. In addition, 24% (R2=24%) variation of galleries per 30cm unit was explained by the regression model. High yielding cultivars; TRI 2025, TRI 2026, had higher number of branches (1914) providing an increased number of susceptible stems for pest attack.
Mean yield
There was no significant (p=0.618) correlation (r=-0.12) between mean yield and galleries per 30 cm unit. In addition, 1.41% (R2=1.41%) variation of galleries per 30cm unit was explained by the regression model. Total yield reduction throughout the pruning cycle may have significant inverse correlation with the pest damage. [9], reported that there was a significant (p=0.001) correlation (r=- 0.911) between mean yield and number of galleries on TRI 2025 (susceptible) cultivar. However, present study was conduct by using 21 different cultivars with different susceptibility levels, which also shows negative correlation less than that of the previous study. Mean prune weight: There was significant (p=0.028) correlation (r=+0.49) between mean prune weight and galleries per 30 cm unit. In addition, 24.18% (R2=24.18%) variation of galleries per 30cm unit was explained by the regression model. Prune weight consists of the most immature parts of the bush, which also support to SHB attack. Therefore, there is a positive relationship with the pest infestation.
Assessment of growth parameters
Intermodal length: There was a significant (p=0.008) correlation (r=0.66) between intermodal length and galleries per 30 cm unit. Moreover, 42.9% (R2=42.9%) variation of galleries per 30 cm unit was explained by the regression model. Intermodal length is a key parameter, which explains the pest infestation with the positive relation. For further confirmation, it is required to assess a large number of sample units with different cultivar in different locations. Mean number of nodes per shoot: There was no significant (p=0.092) correlation (r=-0.45) between mean number of nodes per shoot and galleries per 30 cm unit. 20.31% (R2=20.31%) variation of galleries per 30cm unit was explained by the regression model. Number of nodes was counted apart from the succulent part of the shoot (only semi mature stems are attacked by SHB). According to [10], 75% of the galleries are constructed at the nodes. However, present study was focused on number of nodes per shoot and results indicated that SHB infestation has no significant correlation with number of nodes per shoot.
Bark thickness: There was no significant (p=0.271) correlation (r=-0.26) between bark thickness and galleries per 30 cm unit. In addition, 6.7% (R2=6.7%) variation of galleries per 30cm unit was explained by the regression model. According to [11], beetles prefer stems with bark for gallery construction and the difference was highly significant (p=0.001).However, results of present study showed that bark thickness has no significant effect on pest infestation. But there is a negative relationship with pest infestation.
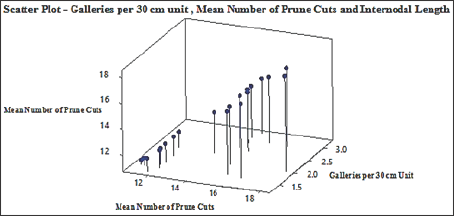
Figure 2: Scatter plot of intermodal length vs. galleries per 30cm unit vs. mean number of prune cuts in different cultivars.

Stem diameter: There was no significant (p=0.508) correlation (r=-0.18) between stem diameter and galleries per 30cm unit. 3.19% (R2=3.19%) variation of galleries per 30cm unit was explained by the regression model. Findings of [4], indicated that branch thickness have little influence on the number of brood galleries. Correlation coefficients were calculated to see the factors most closely related with number of galleries. There were poor linear correlations between number of galleries and branch diameter (r=0.508, p=0.001). Multiple regression model: Multiple regression model was significant (p=0.007) and 56.05% (R2=56.05%) variation of galleries per 30cm unit was explained. It declares that parameters (i.e. intermodal length, mean number of prune cuts and mean prune weight) were significant with galleries per 30cm unit (Figure 2). Multiple regression model of galleries per 30cm unit, explained only intermodal length and mean number of prune cuts.
Developed multiple regression model; Galleries per 30cm=- 8.27+0.1183 X1+1.987 X2.
(Where X1 - mean number of prune cuts and X2-Intermodal length)
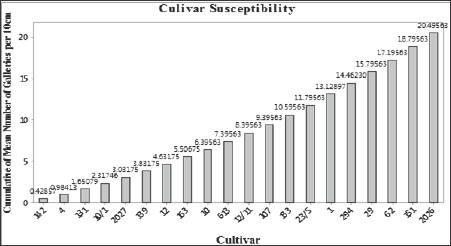
Figure 3: Distribution of mean Number of galleries per 10cm Stem in different cultivars.

Laboratory bioassay to screening of Tea cultivars against SHB by improved glass jar method
Mean number of galleries per 10cm Stem: There was a significant (p=0.004) correlation (r=0.65) between mean number of galleries per 10cm Stem unit and galleries per 30cm (Figure 3). In addition, 41.62% (R2= 41.62%) variation of galleries per 30cm unit was explained by the regression model. Correlation between field infestation and laboratory results was significant with high positive relationship. Hence, findings foresee potentials of harnessing the parameter for industry requirement of a short cut method to cultivar screening against SHB. Improved glass jar method is a convenient method to develop as short cut method. It has some limitations that can overcome through further improvement. Determination of effective pest pressure (number of beetles per bottle), effective stem length and effective number of stem are much important. Wet floral foam was used to maintain stem moisture in the present study, which gave consistent results. However, its limitation of beetles entangle with wet floral foam, can be avoided using a piece of 'Formica sheet over the wet floral foam to restrict the path. Development of a model for pest infestation is required to be optimized the short cut method. Cultivar screening from control laboratory and field conditions separately in different locations, which has active pest pressure by using the same age and same cultivar samples is essential to fit the model. Model can be used to predict infestation even at low pest pressure areas.
Cultivar screening by using nursery tea plants in SHB active areas with natural as tested previously is another cost-effective method. Mean number of galleries were obtained to measure the pest infestation levels. However, amount of wood dust remove from the boring of tunnels has another approach to measure the cultivar susceptibility. Correlation between number of nibble points at nodes vs. number of nodes: There was a significant (p=0.045) correlation (r=0.43) between number of nibble points at nodes and number of nodes. In addition, 18.65% (R2=18.65%) variation of number of nibble points was explained by the regression model. However, total number of nibble points was recorded as 77.197% at nodes and the remaining 22.8% represented the nibble points located in between nodes. These results indicated that the beetle's preference is higher for nodes than the inter nodes.
Results obtained from parameter testing, were exposed to descriptive statistical analysis and summary of the results declared that, mean number of prune cuts (p=0.028, r=0.49), mean prune weight (kg/bush) (p=0.028, r=0.49), intermodal length (cm) (p=0.008, r=0.66) and mean number of galleries (p=0.004, r=0.65) are effective parameters to determine SHB attacks in tea plantations, while mean yield (green leaf)(kg/ha/yr)(p=0.618, r=0.12), bark thickness (mm) (p=0.271, r=0.26), stem diameter (p=0.508, r=0.18), number of nodes per shoot (p=0.092, r=0.45) and number of nibble points at nodes vs. number of nodes (p=0.045, r=0.43) are not effective parameters for the same.
Confirmation and validation of the susceptibility and tolerance of selected cultivars
By exposing field and laboratory infestation results to cluster analysis, susceptibility level of selected cultivars was confirmed and clustered as Known susceptible and Tolerant cultivars. Among those 1, 294, 133, 29, 151 cultivars were categorized as susceptible and 131, 4, 139, 613, 163, 62, 23/5, 12/11, 107, 10/1, 142, 10, 12 were categorized as tolerant.
Conclusion
Cultivar screening against SHB in Tea has several limitations leading to inconsistency in cultivar response to borer attack under field condition. Hence this study was carried out with the objective of determination of additional parameters and identification of convenient short cut method for cultivar screening against SHB in Tea. Amongst the parameters analyzed, intermodal length (p=0.008, r=0.66 and R2=42.9%), and mean number of prune cuts (p=0.028, r=0.49 and R2=24%) were found to be effective in using for cultivar screening against SHB. These parameters exhibited greater correlation coefficient and coefficient of determination, which provide precision in data. Hence, the overall results presented avenues for recognizing the potential of cultivars for the tolerance against SHB by not only looking at the susceptibility but also examining the levels of plant response to the pest attack and defence mechanism. Relationship between field infestation (galleries per 30cm unit) and laboratory infestation (mean number of galleries per 10cm Stem) were significant with high positive relationship (p=0.004, r=0.65 and R2=41.62%). The trend identified from the present study has remarkable outcome that can be utilized on developing short cut method for SHB with further modification of improved glass jar method.
Acknowledgement
This research was supported by the TRI, Thalawakelle, SL, TRI, Rathnapura, Sri Lanka and by the Faculty of Agriculture, University of Ruhuna, Sri Lanka.
References
- Siriwardana KMM (2016) State of the Economy as reflected in the Central Bank Annual Report-2015. Central Bank of Sri Lanka.
- CBSL (2014) Annual Report, Central Bank of Sri Lanka.
- Calnaido D (1971) An ecological approach to pest management in tea.
- Senarathne KADW, K Mohotti (2008) Management of Insect and Mite pest in Tea. Tea Research Institute, Talawakelle, Sri Lanka.
- Walgama R, R Pallemulla (2005) The distribution of shot hole borer, xyleborus fornicatus Eichh. (Coleoptera: Scolytidae), across tea-growing areas in Sri Lanka a reassessment.
- Sutherst R (1995) The potential advance of pests in natural ecosystems under climate change: implications for planning and management Impacts of climate change on ecosystems and species: terrestrial ecosystems. 83-98.
- Samways M, P Hitchins, O Bourquin, J Henwood (2010) Tropical island recovery: Cousine island Seychelles. John Wiley & Sons.
- Vitarana SI (2003) 75 Years of Research in Tea Entomology. The Tea Research Institute of Sri Lanka.
- Jayakody JAAM, HW Shyamalie (2002) Cost of Tea Cultivation from Nursery to the Field. Tea Research Institute, Talawakelle, Sri Lanka.
- Danthanarayana W (1970) The Control of Shot-hole borer (Xyleborus fornicatus Eichh.) of Tea. First Annual Report of Research Conducted Under Grant Authorized by.com Public Law 480, Tea Research Institute of Ceylon, Talawakelle.
- Sivapalan P (1975) The dispersion of brood galleries of Xyleborus fornicatus Eichh. (Coleoptera, Scolytidae) in tea plants. Bulletin of Entomological Research 65(3): 501-506.

Top Editors
-

Mark E Smith
Bio chemistry
University of Texas Medical Branch, USA -

Lawrence A Presley
Department of Criminal Justice
Liberty University, USA -

Thomas W Miller
Department of Psychiatry
University of Kentucky, USA -

Gjumrakch Aliev
Department of Medicine
Gally International Biomedical Research & Consulting LLC, USA -

Christopher Bryant
Department of Urbanisation and Agricultural
Montreal university, USA -

Robert William Frare
Oral & Maxillofacial Pathology
New York University, USA -

Rudolph Modesto Navari
Gastroenterology and Hepatology
University of Alabama, UK -

Andrew Hague
Department of Medicine
Universities of Bradford, UK -

George Gregory Buttigieg
Maltese College of Obstetrics and Gynaecology, Europe -

Chen-Hsiung Yeh
Oncology
Circulogene Theranostics, England -
.png)
Emilio Bucio-Carrillo
Radiation Chemistry
National University of Mexico, USA -
.jpg)
Casey J Grenier
Analytical Chemistry
Wentworth Institute of Technology, USA -
Hany Atalah
Minimally Invasive Surgery
Mercer University school of Medicine, USA -

Abu-Hussein Muhamad
Pediatric Dentistry
University of Athens , Greece

The annual scholar awards from Lupine Publishers honor a selected number Read More...


