Lupine Publishers Group
Lupine Publishers
Menu
ISSN: 2637-4676
Research Article(ISSN: 2637-4676) 
Assessment of Honeybee Colony Performance in the Agro-Ecological Zones of Uganda Volume 1 - Issue 5
Patrice Kasangaki1*, Gideon Nyamasyo2, Paul Ndegwa2 and Robert Kajobe3
- 1National Livestock Resources Research Institute (NaLIRRI), Uganda
- 2School of Biological Sciences, University of Nairobi, Kenya
- 3Rwebitaba Zonal Agricultural Research and Development Institute (RwebiZARDI), Uganda
Received: March 16,2018; Published: March 26,2018
Corresponding author: Patrice Kasangaki, National Livestock Resources Research Institute (NaLIRRI), Uganda
DOI: 10.32474/CIACR.2018.01.000121
Abstract
Honeybee colony performance is the ability of the honeybees to defend the colony and also to effectively collect nectar and pollen and thus productivity. The colony performance of honeybees in nine agro-ecological zones of Uganda was assessed from September 2012 to May 2013. Observations were made on the colonies for brood pattern, proportion of worker bees and combs filled with honey and pollen. The obtained data were analyzed using the SPSS statistical package. The results indicated that both colony strength and productivity varied significantly within agro-ecological zones. Mid North agro-ecological zone had significantly stronger colonies with the highest productivity compared to other agro-ecological zones while Lake Victoria Crescent and Southern Dry land agro-ecological zone had the lowest indicating that the Lake Victoria Crescent agro-ecological zone is not the best for beekeeping in Uganda. The colony strength and productivity did not vary with the vegetation cover, honeybee race, type of bee hive used and the elevation gradient. When promoting beekeeping in Uganda, more efforts should be put in areas such as the mid north agro ecological zone.
Keywords: Colony strength; Productivity; Brood pattern; Apiary management; Vegetation cover
Introduction
Honeybees (Apis mellifera) live in colonies composed of worker groups of diverse genotypes and behaviours which are artificially altered when a beekeeper moves combs between colonies [1,2]. A honeybee colony is composed of three castes: a) a single queen, who is the sole reproductive female in the hive; b) drones who are the male honeybees; and c) the workers who are the sexually sterile females and perform several activities in the colony. In addition to the adult bees, a healthy colony has brood which is a collective term for eggs, larvae, and pupae (the immature stages in the life cycle of bees) [3]. The honeybee colony performance (strength and productivity) is measured by the total area of comb in the colony, containing stored honey, pollen, and brood, adult bee population, weight per bee, and the colony nest cavity volume ratio [4,5]. In Uganda, information on colony performance in all the AEZs is still lacking. Honeybee colony strength determines how the colony is capable of fighting pests and withstanding diseases [6-8]. Where honeybee colonies are used for commercial pollination purposes, evaluation of colony strength is necessary as it is a known fact that stronger colonies collect significantly large amount of pollen [9]. Utilization of honeybee colonies for pollination of coffee and sunflower is taking root in Uganda and thus the need to evaluate the honeybee colony strength in order get maximum benefit from the service.
Information on honeybee colony strength is important for pollination and beekeepers who provide pollination services to get the average number of colonies needed for pollination, basic honey bee biology in context of pollination, and pollination contracts [3]. Despite such importance of understanding honeybee colony strength, beekeepers in Uganda rarely inspect their honeybee colonies because they are not very well informed of the importance. Honeybee colony strength is directly correlated to productivity [10-12] and colony health [13] and is easily visually estimated. It has been noted that colony productivity is closely associated with forging activity [5]. In a strong colony of honeybees, there is a large population of mature honeybees referred to as foragers who gather pollen and nectar to the colony [14] and colony size has been found to affect foraging [9]. Good foraging strategy means having enough pollen store and increased brood production [14] and thus colony strength and productivity. A reduction in foraging activities leads to reduced colony fitness and productivity [15]. This study compared the honeybee colony strength and productivity in the agro ecological zones (AEZs) of Uganda with the aim of providing information on the most productive honeybee race and the AEZs where most productive honeybees with strong colonies are found.
Materials and Methods
This study was conducted in nine out of the ten AEZs of Uganda described in Kasangaki [16] between September 2012 and May 2013. Honeybee colony performance was estimated following methods described by Spivak [6], Vaudo [4] and Delaplane [17] (Subjective mode). This method was chosen because the colonies evaluated belonged to beekeepers most of whom did not want the honey harvested at the time of the experiment. The method is also the most appropriate for very defensive honeybees. At least twenty honeybee colonies were observed in each of the nine AEZs studied. The colonies were selected from four different sites within each AEZ (five colonies per site). To estimate the strength and productivity of the colony, the hives were opened and the combs lifted and the following observations made:
a) The number of combs and proportion of the combs covered by the adult bee population (Figure 1): the combs were observed on both sides and scored 1-3. Also, the average score for the number and proportion of combs for each colony was recorded.
b) The number and proportion of the combs covered by brood (Figure 2): these were also scored as in (a) above.
Figure 1: Adult honeybee pattern assessment.
(a) A comb completely covered by adult bees; (b) Comb with less than 1/2 of it covered by adult bees; (c) Comb with less than 1/4 of it covered by adult bees.
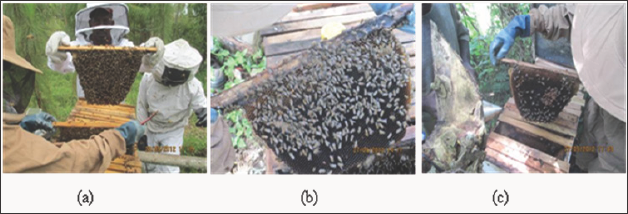
Figure 2: Brood pattern assessment.
(a) Comb with >50% of it uniformly covered by both open and sealed brood;
(b) Comb with about 50% of it covered by brood;
(c) Comb with <25% of it covered by brood.

Figure 3: Assessment of the amount of honey gathered by the bees.
(a) A comb completely covered by sealed honey; (b) Comb with 50% covered by sealed honey; (c) Comb with <25% covered by sealed honey

c) The amount of pollen and nectar collected (Figure 3): this was estimated by observing the proportion of the comb filled with pollen and honey and also scored as in (a) above.
The average scores for each of the observations (a-c) were obtained. The average for each colony were made and then taken as the average performance of that colony (1=Strong; 2=Moderate; 3=Weak). The number and proportion of sealed honey in the hive was used to estimate the productivity of the colony as 1=>50% of the combs with sealed honey (High productivity); 2=25-50% of the combs with sealed honey (moderate productivity); 3=<25% of the combs with sealed honey (low productivity). A GPS receiver was used to record the geographical coordinates and altitude. The vegetation cover was observed and estimated as 1=Thick; 2=Moderate; 3=Sparse. The type of bee hive used was also recorded.
Data Analysis
Kruskal-Wallis test was used to compare the colony strength among honeybee colonies from different AEZs in different vegetation types, type of bee hive and elevation gradient. The same test was used to compare colony productivity in different AEZs, different vegetation types, honeybee race, type of bee hive and elevation gradient. Where significant differences were obtained, Mann-Whitney U test was used to compare pairs of categories. Furthermore, Mann-Whitney U test was used to compare the colony strength among the two honeybee races.
Results
Colony strength
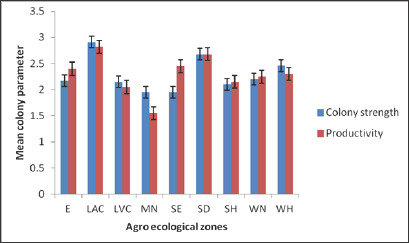
Honeybee colony strength varied significantly across the AEZs (X2 (df=8)=32.62, P<0.01; (Kruskal-Wallis test). Specifically, the colony strength of honeybees in the Victoria Crescent (VC) was significantly lower than for honeybees from all the AEZs except the Southern Dryland (SD) (Table 1) and (Figure 4). The honeybee colony strength did not vary significantly with other factors: vegetation cover (X2 (df=2)=1.41, P=0.47), honeybee race (X2 (df=2)=3.56, P=0.06), bee hive type used (X2 (df=1)=6.08, P=0.11) and elevation gradient (X2 (df = 2)=3.57, P=0.17).
Table 1: Comparison of colony strength among agro-ecological zones of Uganda.
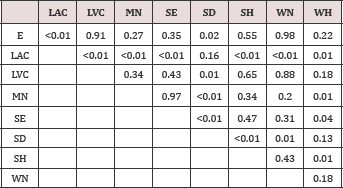
Figures in bold (P-values) indicate where the colony strengths are significantly different between the AEZ (E=East; LAC=Lake Albert Crescent; LVC=Lake Victoria Crescent; MN=Mid North; SE=South East; SD=Southern Dryland; SH=Southern Highland; WN=West Nile; WH=Western Highland).
Productivity
Table 2: Comparison of colony productivity among the AEZs of Uganda.
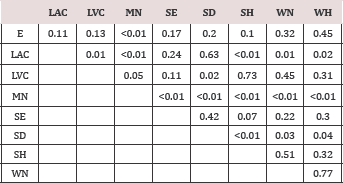
Figures in bold (P-values) indicate where the colony strengths are significantly different between the AEZ (E=East; LAC=Lake Albert Crescent; LVC=Lake Victoria Crescent; MN=Mid North; SE=South East; SD=Southern Dry land; SH=Southern Highland; WN=West Nile; WH=Western Highland).
Honeybee productivity varied significantly across the AEZs (X2 (df=8)=32.93, P <0.01; Kruskal-Wallis test). Specifically, the productivity ofthe honeybees in the MN AEZ was significantly higher than in all the other AEZs (Table 2) and (Figure 4). The productivity did not vary significantly with the other factors: vegetation cover (X2 (df=2)=2.28, P=0.32), honeybee race (X2 (df=1)=2.86, P=0.09), bee hive type used (X2 (df=3)=4.29, P=0.23) and elevation gradient (X2 (df=2)=5.26, P=0.07).
Figure 4: Comparison of mean honeybee colony strength and productivity in the AEZs of Uganda.
Discussion
Both the colony strength and productivity varied significantly across the AEZs of Uganda. The MN AEZ had colonies with higher colony strength and productivity compared to the rest but generally the productivity was low in all the AEZs and lowest in the LVC AEZ. Many studies have found a decline in colony strength and productivity [18,19] which has been attributed to factors such as pests and diseases, pesticide use and poor forage sources. Number of foraging bees has been used in determining colony success in terms of colony weight gain [14,20] Honeybee colony strength is one of the measures of population of adult bees and brood [17] and productivity [9] since colony strength has an effect on the foraging pattern. It is expected that, the stronger the colony, the more is the productivity [21].
There was no significant variation in the colony strength and productivity among the two honeybee races (A.m. scutellata and A.m. adansonii). Generally all races of A. mellifera have similar morphological, behavioural and innate characteristics compared to other species such as A. cerana [22] which could be the reason for no variation in the colony strength and productivity. However, there is need to monitor the strength and productivity of Ugandan honeybee colonies since new threats like Varroa mites [23,24] and viruses [25] have been detected. The colony strength and productivity did not vary with vegetation cover, type of bee hive used and the elevation gradient. Similar studies conducted in Nigeria by Babarinde [26] found no variation in colony strength and productivity of the honeybees. Colony losses have been reported in some parts of Uganda as a result of vegetation loss (forage source) due to effects of bush burning [27]. Decline in honeybee forage sources could have profound impacts on honeybee colony strength and productivity [28]. Although Kugonza [29] stated that bee hives in thick vegetation could have higher colony strength than those in sparse vegetation due to a favourable micro climate, this study did not find any significant variation in colony strength with vegetation cover.
Chahbar [30] while assessing honey production in South Western Ethiopia found out that moveable frame hives have significantly stronger colonies than fixed comb hives. The architecture of the different bee hive types may differ but honeybees have mechanisms of manipulating conditions within the hives [31] which could be the reason why there was no variation in colony strength and productivity with the type of bee hive used. There has been contradicting results on the honeybee productivity using different types of bee hives. For example, Kinati [32] found out that moveable top bar and frame hives were more productive than traditional bee hives. Muli [33] also stated that the Langstroth hives yield honey compared to the traditional bee hives in Kenya. However, this was not the case in this study probably because we did not measure yields. There is need for a longer study to investigate the seasonal changes in colony strength in the different AEZs of Uganda. From the results obtained, it can be seen that the colony strength and productivity in all the AEZs was low. Chemurot [34] while assessing honey production levels of honeybees in one of the AEZs of Uganda found that honey production per hive was generally low which is in agreement with the results of this study. Improved colony strength and productivity can be achieved through good apiary management practices and pest and disease control [8].
Honeybees with strong colonies have been found to have good hygienic behaviour [35,36] which is good for quality honey production. Strong honeybee colonies are also known to provide good defence against honeybee pests [37]. Some reasons put forward for low honeybee colony strength and productivity in Uganda include poor apiary management [38]. However, honeybee colony strength and productivity in Uganda can be improved by practicing good apiary management, bee forage improvement and optimizing the carrying capacity in a particular place [39].
Conclusion
a) Most productive honeybee colonies with high colony strength in Uganda are found in the Mid North agro-ecological zone.
b) There was no difference in the colony strength and productivity between A. m. adansonii and A. m. Scutellata
c) Vegetation cover does not influence colony strength and productivity because not all the plants that constitute the vegetation cover provide good source of nectar and pollen required for the colony growth.
Recommendations
Government and development partners promoting beekeeping in Uganda should put more efforts and resources to develop beekeeping in the Mid North agro-ecological zone in order to realize the potential from the industry and raise more income to the farmers and the country at large. Further investigations into factors influencing colony strength and productivity should be conducted over a long period of time.
References
- Paleolog J (2009) Behavioural characteristics of honey bee (Apis mellifera) colonies containing mix of workers of divergent behavioural traits. Animal Science Papers and Reports 27(3): 237-248.
- Uzunov A, Cost C, Panasiuk B, Meixner M, Kryger P, et al. (2014) Swarming, defensive and hygienic behaviour in honey bee colonies of different genetic origin in a pan-European experiment. Journal of apicultural research 53(2): 248-260.
- Sagili RR, Burgett DM (2011) Evaluating Honey Bee Colonies for Pollination: A Guide for Commercial Growers and Beekeepers. A pacific northwestern extension publication p. 1-8.
- Vaudo AD, Ellis JD, Cambray GA, Hill M (2011) The effects of land use on honey bee (Apis mellifera) population density and colony strength parameters in the Eastern Cape, South Africa. J Insect Conserv.
- Wray MK, Mattila HR, Seeley TD (2011) Collective personalities in honeybee colonies are linked to colony fitness. Animal Behaviour 81(3): 559-568.
- Spivak M, Reuter GS (1998) Performance of hygienic honey bee colonies in a commercial apiary. Apidologie 29(3): 291-302.
- Abou Shaara HF (2014) The foraging behaviour of honey bees, Apis mellifera: a review. Veterinarni Medicina 59(1): 1-10.
- Babarinde SA, Olaleke SA, Akinyemi AO, Adebayo TA, Olaifa JI (2015) Evaluation of four apicultural products for hive colonization by honey bees (Apis mellifera adansonii) (Hymenoptera: Apidae) and precolonization pests. African journal of food, agriculture, nutrition and development 15(2): 9826-9837.
- Jevtic G, Mladenovic M, Andelkovic B, Nedic N, Sokolovic D, et al. (2009) The correlation between colony strength, food supply and honey yield in honeybee colonies. Biotechnology in Animal Husbandry 25(5-6): 11411147.
- Ali MAM (2011) Comparative study for evaluating two honey bee races, Apis mellifera jementica (indigenous race) and Apis mellifera carnica (carniolan race) in brood production, population development and foraging activity under the environmental conditions of the central region of the Kingdom of Saudi Arabia. Annals of Agricultural Sciences 56(2): 127-134.
- Neupane KR, Woyke J, Wilde J (2012) Effect of initial strength of honey bee colonies (Apis mellifera) supered in different ways on maximizing honey production in Nepal. Journal of apicultural science 56(2): 71-82.
- Kumsa T, Takele D (2014) Assessment of the Effect of Seasonal Honeybee Management on Honey Production of Ethiopian Honeybee (Apis mellifera) in Modern Beekeeping in Jimma Zone. Greener Journal of Plant Breeding and Crop Science 2(3): 67-75.
- Wang M, Brewer L (2007) New Computer Methods for Honeybee Colony Assessments p. 2.
- Fewell JH, Winston ML (1992) Colony state and regulation of pollen foraging in the honey bee, Apis mellifera L. Behavioral Ecology and Sociobiology 30: 387-393.
- Mattila HR, Burke KM, Seeley TD (2008) Genetic diversity within honeybee colonies increases signal production by waggle dancing foragers. In Proc R Soc B pp. 809-816.
- Kasangaki P, Nyamasyo G, Ndegwa P, Kajobe R, Angiro C, et al. (2017) Mitochondrial DNA (mtDNA) markers reveal low genetic variation and the presence of two honey bee races in Uganda's agro-ecological zones. Journal of Apicultural Research 56(2): 112-121.
- Delaplane KS, van der Steen J, Guzman Novoa E (2013) Standard methods for estimating strength parameters of Apis mellifera colonies. Journal of apicultural research 52(1): 1-12.
- Sharma VP, Kumar NR (2010) Changes in honeybee behaviour and biology under the influence of cellphone radiations. Current Science 98(10): 1376-1378.
- Alemu T, Legesse G, Ararso Z (2014) Performance Evaluation of Honeybee (Apis mellifera scutellata) in Guji Zone. International Journal of Innovation and Applied Studies 9(4): 1987-1993.
- Donaldson Matasci M C, Dornhaus A (2012) How habitat affects the benefits of communication in collectively foraging honey bees. Behavioral Ecology and Sociobiology 66(4): 583-592.
- Sharma D, Gupta RK, Bali K, Laet D, Eerens J, et al. (2014) Beekeeping practices for management of Apis mellifera. Beekeeping for Poverty Alleviation and Livelihood Security: Technological Aspects of Beekeeping London, England, pp. 125-170.
- Dalio JS (2015) Comparative Performance of Apis mellifera and Apis cerana Under Punjab Conditions. Medical Science 4(3): 6-8.
- Kasangaki P, Otim AS, Abila PP, Angiro C, Chemurot M, et al. (2015) The presence of varroa in Uganda and knowledge about it by the beekeeping industry. Journal of Apicultural Research 54(4): 373-377.
- Chemurot M, Akol AM, Masembe C, de Smet L, Descamps T, et al. (2016) Factors influencing the prevalence and infestation levels of Varroa destructor in honeybee colonies in two highland agro-ecological zones of Uganda. Experimental and Applied Acarology 68(4): 497-508.
- Kajobe R, Marris G, Budge G, Laurenson L, Cordoni G, et al. (2010) First molecular detection of a viral pathogen in Ugandan honey bees. Journal of invertebrate pathology 104: 153-156.
- Babarinde SA, Odewole A F, Oyegoke OO, Amao OBA (2012) Impact of hive dimension and fight entrance on hive colonization, pest infestation and hive weight gain in Apis mellifera adansonii (Hymenoptera: Apidae). Mun Ent Zool 7(1): 634-641.
- Chemurot M, Kasangaki P, Francis O, Sande E, Isabirye Basuta G (2013) Beehive and Honey Losses Caused by Bush burning in Adjumani District, Uganda. Bee world 90(2): 33-35.
- Karanja RHN, Njoroge GN, Gikungu MW, Newton LE (2010) Bee interactions with wild flora around organic and conventional coffee farms in Kiambu district, central Kenya. Journal of Pollination Ecology 2(2): 7-12.
- Kugonza DR, Kamatara KB, Nabakabya D, Kikonyogo S (2009) Effects of hive type and tree shade on colonization rate and pest prevalence of honeybee (Apis mellifera) colonies in Central Uganda. Africa Journal of Animal and Biomedical Sciences 4(2): 87-92.
- Chahbar N, Munoz, I, Dall'Olio R, De la Rua P, Serrano J, et al. (2013) Population structure of North African honey bees is influenced by both biological and anthropogenic factors. J Insect Conserv 17(2): 385-392.
- Kasangaki P, Chemurot M, Sharma D, Gupta RK (2014) Beehives in the World. In RK Gupta, WR Johan, A Gupta (eds.) Beekeeping for Poverty Alleviation and Livelihood Security. London, England, pp. 125-170.
- Kinati C, Tolemariam T, Debele K (2013) Assessment of Honey Production and Marketing System in Gomma District, South Western Ethiopia. Greener Journal of business and management studies 3(3): 99-107.
- Muli EM, Kilonzo JW, Ngang JK (2015) Adoption of frame hives: Challenges facing beekeepers in Kenya. Glob J Agric Econ Ext Rural Deve 3(6): 251-257.
- Chemurot M (2011) Beekeeping in Adjumani District, Uganda. Bee World 88(3): 58-61.
- Bąk B, WiLde J, Siuda M (2010) Comparison of hygienic behaviour between five honey bee breeding lines. Journal of Apicultural Science 54(2): 17-24.
- Balhareth HM, Alqarnii AS, Owayss AA (2012) Comparison of hygienic and grooming behaviors of indigenous and exotic honeybee (Apis mellifera) races in Central Saudi Arabia. International Journal of agriculture & Biology 14(6): 1005-1008.
- Arca M, Papachristoforou A, Mougel F, Rortais A, Monceau K, et al. (2014) Defensive behaviour of Apis mellifera against Vespa velutina in France : Testing whether European honeybees can develop an effective collective defence against a new predator. Behavioural Processes 106: 122-129.
- Drost S, De Boer D, Van Wijk J (2013) Including conflict-affected producers in agri-food chains - Honey business in Northern Uganda. Wageningen, Netherlands.
- Al Ghamdi A, Adgaba N, Getachew A, Tadesse Y (2014) New approach for determination of an optimum honeybee colony's carrying capacity based on productivity and nectar secretion potential of bee forage species. Saudi Journal of Biological Sciences 23(1): 92-100.

Top Editors
-

Mark E Smith
Bio chemistry
University of Texas Medical Branch, USA -

Lawrence A Presley
Department of Criminal Justice
Liberty University, USA -

Thomas W Miller
Department of Psychiatry
University of Kentucky, USA -

Gjumrakch Aliev
Department of Medicine
Gally International Biomedical Research & Consulting LLC, USA -

Christopher Bryant
Department of Urbanisation and Agricultural
Montreal university, USA -

Robert William Frare
Oral & Maxillofacial Pathology
New York University, USA -

Rudolph Modesto Navari
Gastroenterology and Hepatology
University of Alabama, UK -

Andrew Hague
Department of Medicine
Universities of Bradford, UK -

George Gregory Buttigieg
Maltese College of Obstetrics and Gynaecology, Europe -

Chen-Hsiung Yeh
Oncology
Circulogene Theranostics, England -
.png)
Emilio Bucio-Carrillo
Radiation Chemistry
National University of Mexico, USA -
.jpg)
Casey J Grenier
Analytical Chemistry
Wentworth Institute of Technology, USA -
Hany Atalah
Minimally Invasive Surgery
Mercer University school of Medicine, USA -

Abu-Hussein Muhamad
Pediatric Dentistry
University of Athens , Greece

The annual scholar awards from Lupine Publishers honor a selected number Read More...


