
Lupine Publishers Group
Lupine Publishers
Menu
ISSN: 2637-4676
Research Article(ISSN: 2637-4676) 
Abundance, Generation Determination and Spatial Distribution Pattern of the Sunt Wax Scale Insect, Waxiella Mimosae (Signoret) (Hemiptera: Coccidae) Infesting Sunt Trees in Luxor Governorate, Egypt Volume 4 - Issue 3
Moustafa MS Bakry*
- Scale Insects and Mealybugs Research Department, Plant Protection Research Institute, Egypt
Received: September 03, 2018; Published: September 12, 2018
Corresponding author: Moustafa MS Bakry, Scale Insects and Mealybugs Research Dept, ARC Dokii, Giza, Egypt
DOI: 10.32474/CIACR.2018.04.000187
Abstract
The present work was carried out throughout two successive years (2016/2017 and 2017/2018) at Esna district, Luxor Governorate. As a basic study for developing future management of the sunt wax scale insect, Waxiella mimosae (Signoret), to determine the seasonal abundance of this pest and its spatial distribution pattern. The obtained results showed that insect population occurred on sunt trees all the year round and has two overlapping generations a year under field conditions. The first generation occurred in autumn season, started in September 10th and extended until March 10th in the two years and covered a period of 24 weeks per year and its peaked in November 10th and October 25th during the two years, respectively. Whereas, the second generation recorded in spring season, observed between the period in February 25th to August 25th, peaked in May 10th and its duration 24 weeks per year in the both years. In general, the population density was varied in the two generations; the spring generation of pest was the biggest one in size than the autumn generation during the two years.
The obtained results showed that the favorable time for abundance and maximum values of total population density of W. mimosae, were recorded in autumn and spring months and were the optimal for the insect multiplication and build up, since the highest R.M.V.P values was achieved during the both two years. Lowest activity of population was recorded during winter months (this referred to the cold weather) during the two years. Also, the percentages of the age-structure population of W. mimosae species, during the both two years, were almost similar. However, the insect age-structured population was considerably differed among between months and between the two years. Data were analyzed using fourteen indices of dispersion to estimate the spatial distribution pattern of this pest. All models of dispersion indices exhibited an aggregated distribution and follows a negative binomial distribution pattern for all alive different stages and total population of W. mimosae in all seasons of the year and on the over year during the two years of study.
Keywords: Waxiella mimosa; Seasonal activity; Environmental conditions; Peaks; Generations; Spatial distribution and sunt trees
Introduction
The sunt wax scale insect, Waxiella mimosae (Signoret) = Ceroplastes mimosae (Signoret) (Hemiptera: Coccidae) is considered as one of the serious destructive pests infesting sunt trees. Very rare data about this insect was found in Egypt [1] and around the world. It has attacks narrow range of host plants, Acacia nilotica, Albizzia lebbek and Ficus carica in Egypt [2]. The pest which was originally described from Egypt, has been recorded also in many countries: South Africa [3], Angola [4], Mauritania [5], Algeria [6], Saudi Arabia [7] and Israel [8]. It causes severe damage to infested branches and the twigs sucking the plant sap with the mouth parts, causing thereafter deformations, drying up of young twigs and death of twigs by the action of the toxic saliva and excreting large amount of honeydew that encourages the growth of sooty mould with blackens the branches, decreases photosynthesis activity, and decreased vegetative growth of the infested trees [9,10]. A characteristic symptom of infestation by pest is the appearance and accumulation of its scales on attacked sunt parts and the waxy covering of adjacent individuals becomes confluent, rendering it difficult to ascertain the real form. The old adult females appear very highly convex, almost spherical, except where it is in contact with the host plant; opaque waxy white with sometimes, but by no means always, a nipple-shaped prominence either centrally or sub-centrally. In the young adult females, the nipple is always present and is quite marked whilst in very young specimens appears almost pyramidical and suffused with pink [11]. No males were observed, and we assume that this species reproduces parthenogenetically. In the case of wax scale insect, the gravid females are red and covered with bright white gummy wax. Eggs are brick red, and after laying them the female holds them in a cavity under her body until they hatch and crawl out. The only way to detect oviposition was by removal of the female cavity. Gravid females were defined as females that have their eggs under their cavities [8]. The wax scale insect was collected and identified by Dr. Fatma Abd El-Halim Moharum, Department of scale insect and Mealybugs, Plant Protection Research Institute, Agric. Res. Center, Egypt.
Spatial distribution is one of the most characteristic properties of insect populations; in most cases it allows us to define them and is a typical trait in insect populations and is an important characteristic of ecological communities [12]. Knowledge of the spatial distribution provides useful information not only for theoretical population biology but for field monitoring programs [13]. Also, allows for the estimation of densities and in turn forms the basis for making decision in pest management programs [14]. Methods that are commonly used to describe the distribution of insect populations have been summarized by Southwood [15]. On the other hand, detailed knowledge of insect distributions and the primary factors affecting how insect populations utilize their available resources are critical to the development of accurate sampling plans in agro-ecosystems and integral to the study of population and community ecology of insects [16]. The behavioral patterns and environment could be determinant the spatial distribution of population individuals in an ecosystem [17]. The information of spatial distribution (i.e., regular, random or aggregated) can determine what sampling program must be carried out, especially sequential sampling [18]. The use of dispersion indices seems to be convenient decision-making methods for management programs because of their easy calculation procedure and simple results [19]. Having information about density and changes in population of W. mimosae during the year, identification of factors affecting population fluctuations and determination of their effects will help in management of this pest. Rare informations in the literature concerning the seasonal abundance and spatial distribution pattern of this pest. So, it is necessary to do this study in Luxor region where there is no reported similar research. Therefore, the present work was carried out to study ecological aspects viz., the seasonal abundance of pest, the percentage out of year total population, the rate of monthly variation, the age structure of pest and its generations (duration, number and size) as well as, the estimation of its the spatial distribution under the field condition in Luxor Governorate.
Materials and Methods
Population studies
The population fluctuations of this scale found infesting sunt trees, Acasia Arabica (Family: Fabaceae) were carried out at half-monthly intervals at Esna district, Luxor Governorate. This experiment was extended the two successive years for studying the population fluctuations of this insect from September 10th, 2016 until August 25th, 2018.
Sampling
Four sunt trees were grown on the edges of water canals were heavily infested with the sunt wax scale insect, W. mimosae (Signoret) and were chosen for this study. The selected trees were almost similar and as uniform as possible in size, age, shape, height, vegetative growth and without application any chemical control measures before and during the period of study.
Examination
Regular half-monthly samples were picked up to random from different directions and stratums of tree with rate of 15 branches (20 cm. long) per tree. The samples were collected regularly and immediately transferred to laboratory in polyethylene bags for inspection using a stereo-microscope. Numbers of alive insects of trees were individually sorted into immature stages (first instar nymphs, second instar nymphs and third instar nymphs) and mature stages (adult females and gravid females) and then were counted and recorded together opposite to each inspected date. The associated natural enemies (predators and parasitoids) of this insect was examined, identified and recorded. The specimens of scale insect were put in glass jars and kept under 21-25°C and 60-65% R.H. for securing any emerging parasitoids. Emerging parasitoids were identified by the specialists in the Biological Control Research Department, Plant Protection Research Institute, Agric. Res. Center, Egypt.
General sampling method:
We collected a total of 48 samples on 48 dates over a twoyears period. All sampling was conducted from 2880 branches i.e. (15 branches x 4 trees x 48 dates). As before, we froze samples for later processing in the laboratory and recorded. To facilitate the comparisons within each studied year and among the two years, the bimonthly counts were accumulated monthly. These monthly counts were estimated in percentages out of the year total.
The percentage out of year total population by pest was calculated according to the following equation:
D = (t/T) x 100
Where, D = The percentage out of year total population.
t = Number of populations in which the pest appeared.
T = Total number of populations taken all over the year.
This method was used by many investigators by Salah (2005) and Bakry [20,21] they are using the same technique for Coccoidea pests.
Also, the rate monthly variation in the population (R.M.V.P) was calculated according to the formula reported by Serag El Din [22]:

To calculate the age structure per sample, the mean number of each stage was divided by the total and multiplied by 100. This way gave each stage a percent proportion of the total per sample regardless of the total number of presented insect (i.e. population density).
Number of annual generations of W. mimosae in the field
Annual total population data were graphically plotted in figures. Number and duration of annual generations under field conditions were recorded on the basis (beginning of total population per leaf and its end) were determined by integration of the population curves in these figures. This method was used by many investigators by Elwan [23,24] they are using the same method for Coccoidea pests. The meteorological data of the half-monthly means of some climatic factors (daily mean maximum temperature, minimum temperature, mean of % relative humidity and mean of dew point °C) for conditions of Luxor governorate were obtained from the Central Laboratory for Agricultural climate, Agriculture Research Center, Ministry of Agriculture in Giza. Averages of population density of insect and weather conditions was calculated by Excel sheets and shown graphically.
Analysis of spatial distribution
The spatial distribution among the sample units was determined by fourteen indices of distribution. Such indices were chosen in an attempt to get a consensus on dispersion because the use of a single index can lead to incorrect conclusions [25]. Soemargono [26] recommended that in evaluating distribution of an arthropod, one should use several different techniques before drawing conclusions about population distribution (Figure 3).
Distribution indices
Several estimates are based on sample means and variances (such as index of dispersion, clumping, crowding and Green’s).
Mean (̄): ̄ is the mean of population.
Range of means of population: Between the maximum mean number of population and minimum for the year was calculated by applying the following equation
Range of Density = Population maximum – Population minimum
Variance (S2), Standard deviation (SD) and Standard error (SE) for samples were determined.
Coefficient of variance (C.V.): To assess the fidelity of sampling, the coefficient of variation values between sampling dates were compared.

Relative Variation: (R.V.) is employed to compare the efficiency of various sampling methods [27]. The relative variation for the sampling data was calculated as follows:

Where, SE is the standard error of the mean and ̄ is the mean of population.
Index of dispersion (ID):
The index of dispersion is also known as the variance tomean ratio. Dispersion of a population can be classified through a calculation of the variance-to-mean ratio; namely: S2/̄ =1 random distribution, <1 regular distribution, and >1 aggregated distribution (where, S2 = sample variance; ̄ = mean of population). Departure from a random distribution can be tested by calculating the index of dispersion (ID), where, n: denotes the number of samples:
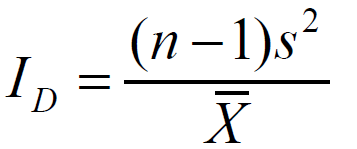
ID is approximately distributed as x2 with n-1 degrees of freedom. Values of ID which fall outside a confidence interval bounded with n-1 degrees of freedom and selected probability levels of 0.95 and 0.05, for instance, would indicate a significant departure from a random distribution.
This index can be tested by Z value as follows:

If 1.96 ≥ Z ≥ -1.96, the spatial distribution would be random, but if Z < -1.96 or Z > 1.96, it would be uniform and aggregated, respectively Patil and Stiteler, 1974.
Index of mean clumping (ID M) [28]
(ID M)= S2/̄-1
David and Moore index of clumping values increase with increasing aggregation. If the index value = 0, the distribution is random, positive value for negative binomial (aggregated) and negative value for positive binomial (regular).
Lloyd’s mean crowding ( )
)
Mean crowding ( ) was proposed by Lloyd to indicate the
possible effect of mutual interference or competition among
individuals. Theoretically mean crowding is the mean number of
other individuals per individual in the same quadrate:

As an index, mean crowding is highly dependent upon both the degree of clumping and population density. To remove the effect of changes in density, Lloyd introduced the index of patchiness, expressed as the ratio of mean crowding to the mean. As with the variance-to-mean ratio, the index of patchiness is dependent upon quadrate size [29].
Index of patchiness (IP): is dependent upon quadrate size

If IP = 1 random, < 1 regular and > 1 aggregated
Green’s index (GI) [30]:

This index is a modification of the index of cluster size that is independent of n.
If GI > 0 or positive values are indicative of aggregation dispersion, GI < 0 or negative values indicative of uniformity or regular dispersion, and GI = 0 or negative values closer to 0 indicate randomness.
Results and Discussion
Population studies
Seasonal activity of W. mimosae on sunt trees: The halfmonthly counts of W. mimosae different stages infested branches of sunt trees at Esna district, Luxor Governorate were recorded through the two successive years (2016/2017 and 2017/2018). Also, means of the half-monthly records of temperature, relative humidity and dew point throughout the two years of investigations are represented in tables 1 & 2 and graphically illustrated in Figure 1 & 2. To discuss the seasonal activity of different stages of W. mimosae on the basis of average number of immature and mature stages counts per branch at the successive sampling dates
Pre-adults population (immature stages): The initial mean counts of first instar nymphs of W. mimosae in September ranged from zero to 6 ± 0.33 and zero to 6.78 ± 0.37 individuals per branch through the first and second years, respectively. Moreover, the population gradually increased until reached to the first peak in October 25th when the population was 240.30 ± 12.92 and 260.0 ± 14.16 individuals per branch under field conditions at 36.07 and 34.70 °C, Max., 20.64 and 19.05 °C, Min., 29.21 and 30.73 % and 13.71 and 12.05 °C dew point for the first and second years, respectively. Then, it gradually decreased and continuously until February 25th (less than one individual per branch) during the two years. After that, The population density started to increase in March and then it highly increased continuously to reach the second peak in the April 25th with the mean numbers of 172.25±9.21 and 189.91±10.34 individuals per branch under field conditions at 30.59 and 33.26 °C, Max., 16.59 and 16.16 °C, Min., 25.39 and 22.15 % and 6.71 and 6.78 °C dew point for the first and second years, respectively. Thereafter, it decreased continuously and until reach to the minimum numbers of pest was recorded in July and August during the two years are represented in Tables 1 & 2 and illustrated Figures 1 & 2.
Table 1: Half-monthly mean numbers of different stages of W. mimosae (Signoret) on sunt trees, with climatic factors affecting at Esna district, Luxor Governorate from September 10th, 2016 to August 25th, 2017.
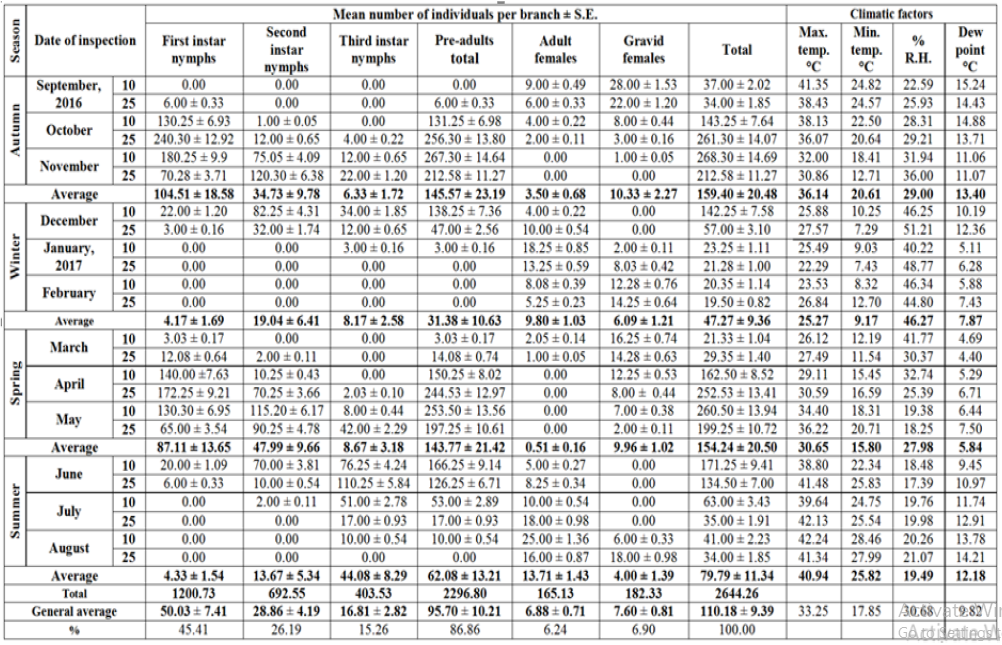
Table 2: Half-monthly mean numbers of different stages of W. mimosae (Signoret) on sunt trees, with climatic factors affecting at Esna district, Luxor Governorate from September 10th, 2017 to August 25th, 2018.
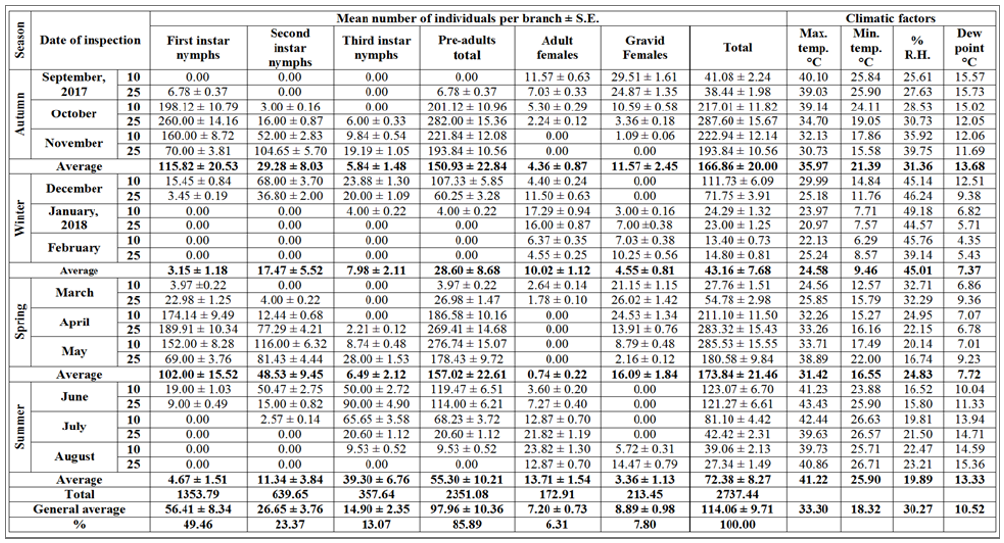
Figure 1: Means of half monthly counts of different stages and the population density of W. mimosae (Signoret) on sunt trees, with climatic factors affecting at Esna district, Luxor Governorate during the first year of (2016/2017).
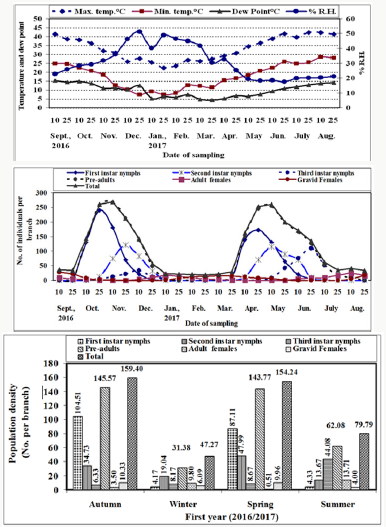
Figure 2: Means of half monthly counts of different stages and the population density of W. mimosae (Signoret) on sunt trees, with climatic factors affecting at Esna district, Luxor Governorate during the second year of (2017/2018).
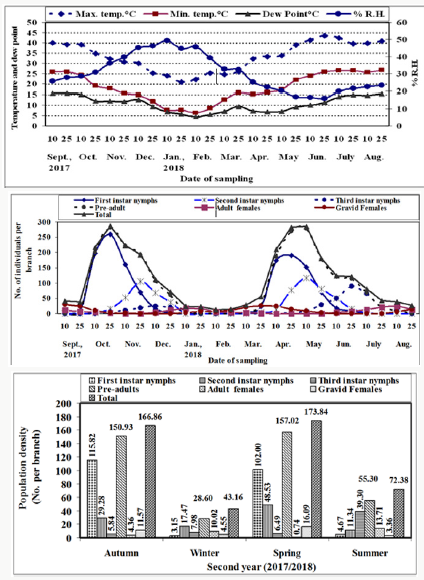
A similar trend in the seasonal fluctuation of second instar nymphs’ populations was observed. The second instar nymph’s population showed that, decrease in September month during the two years. Thereafter, the population increased gradually to reach the first peak in November 25th, when the population was 120.30±6.38 and 104.65±5.70 individuals per branch under field conditions at 30.86 and 30.73 °C, Max., 12.71 and 15.58 °C, Min., 36.00 and 39.75 % and 11.07 and 11.69 °C dew point for the first and second years, respectively. Followed by a dramatic decline and gradual decrease for population until reached to February 25th (less than one individual per branch) during the two years. Then, the population showed gradual increase in March and it highly increased continuously to reach the second peak during May 10th with the mean numbers of 115.20±6.17 and 116.00±6.32 individuals per branch under field conditions at 34.40 and 33.71 °C, Max., 18.31 and 17.49 °C, Min., 19.38 and 20.14 % and 6.44 and 7.01 °C dew point for the first and second years, respectively. After that, it decreased continuously and until reach to the minimum numbers of pest were recorded in August during the two years are represented in Tables 1 & 2 and illustrated in Figures 1 & 2.
So, for, the trends of both second instars nymphs and third instars nymph’s population oscillations during the investigated period, were rather similar. The third instar nymph’s population showed decreased in September month until October 10th (less than one individual per branch) during the two years. Moreover, the population started to increase in October 25th and then it increased gradually until reached to the first peak in December 10th when the population was 34.00±1.85 and 23.88±1.30 individuals per branch under field conditions at 25.88 and 29.99 °C, Max., 10.25 and 14.84 °C, Min., 46.25 and 45.14 % and 10.19 and 12.51 °C dew point for the first and second years, respectively. Then, it gradually decreased till January 10th and followed by a dramatic decline and gradual decrease for population until reached to the mid of February (less than one individual per branch) during the two years. After that, the population density started to increase in April 25th and then it highly increased continuously to reach the second peak in June 25th with the mean numbers of 110.25±5.84 and 90.00±4.90 individuals per branch under field conditions at 41.48 and 43.43 °C, Max., 25.83 and 25.90 °C, Min., 17.39 and 15.80 % and 10.97 and 11.33 °C dew point for the first and second years, respectively. Thereafter, it decreased continuously and until reach to the minimum numbers of pest was recorded in July and August during the two years are represented in Tables 1 & 2 and illustrated in Figure 1 & 2.
The pre-adult’s total population (viz., sum of the three instars for nymphs). The variance in different instars of nymphs’ abundance reflected on the pre-adults total mixed population. The pre-adult’s total population density was lowest in September 10th (less than one individual per branch) during the two years. After that, the population started to increase in September 25th and then it gradually increased until reached to the first peak in November 10th during the first year and in October 25th through the second year, when the population was 267.30±14.64 and 282.00±15.36 individuals per branch under field conditions at 32.00 and 34.70 °C, Max., 18.41 and 19.05 °C, Min., 31.94 and 30.73 % and 11.06 and 12.05 °C dew point for the first and second years, respectively. Then, it gradually decreased and continuously until January 10th and followed by a dramatic decline and gradual decrease for population until reached to the mid of February (less than one individual per branch) during the two years. Thereafter, The population density started to increase in March and then it highly increased continuously to reach the second peak during May 10th with the mean numbers of 253.50±13.56 and 276.74±15.07 individuals per branch under field conditions at 34.40 and 33.71 °C, Max., 18.31 and 17.49 °C, Min., 19.38 and 20.14 % and 6.44 and 7.01 °C dew point for the first and second years, respectively. Then, it gradually decreased until reach to the lowest numbers of pest was observed in July and August during the two years are represented in Tables 1 & 2 and illustrated Figures 1 & 2.
Females population (mature stages)
a) Adult females
The obtained results showed that the adult females gradually decreased in September and October until reach in November 25th (less than one individual per branch) during the two years. Then, it started to increase in June 10th and highly increased continuously to reach the first peak was recorded in January 10th when the population was 18.25±0.85 and 17.29±0.94 individuals per branch under field conditions at 25.49 and 23.97 °C, Max., 9.03 and 7.71 °C, Min., 40.22 and 49.18 % and 5.11 and 6.82 °C dew point for the first and second years, respectively. Then, it gradually decreased until reach to the lowest numbers of pest was observed in April and May during the two years. After that, it gradually increased until reached to the second peak was recorded in the August 10th with the mean numbers of 25.00±1.36 and 23.82±1.30 individuals/branch under field conditions at 42.24 and 39.73 °C, Max., 28.46 and 25.71 °C, Min., 20.26 and 22.47 % and 13.78 and 14.59 °C dew point for the first and second years, respectively. Then, it decreased in August 25th during the two years are represented Tables 1 & 2 and illustrated in Figures 1 & 2. The above-mentioned results are nonagreement with those obtained by Ben [8] in Israel, reported that the bionomics of W. mimosae they found that the first generation of adult females appear in March, and the second generation takes place in October.
b) Gravid females
The gravid female’s population showed the first peak of activity in September 10th when the population was 28.00±1.53 and 29.51±1.61 individuals per branch under field conditions at 41.35 and 40.10 °C, Max., 24.82 and 25.84 °C, Min., 22.59 and 25.61 % and 15.24 and 15.57 °C dew point for the first and second years, respectively. Thereafter, it decreased continuously and until reach to the minimum numbers of population was recorded in December 25th (less than one individual per branch) during the two years. Then, it started to increase in January 10th and increased gradually to reach the second peak in was observed in the March 10th for the first year and in March 25th during the second year with the mean numbers of 16.25±0.74 and 26.02±1.42 individuals per branch under field conditions at 26.12 and 25.85 °C, Max., 12.19 and 15.79 °C, Min., 41.77 and 32.29 % and 4.69 and 9.36 °C dew point for the first and second years, respectively. After that, it decreased gradually during until July 25th and then it started to increase in August 10th during the two years are represented Tables 1 & 2 and illustrated in Figures 1 & 2.
c) Total population of W. mimosae
The seasonal abundance of the total population of W. mimosae has the same trend as the first instar nymphs’ population. It was observed that the total population density in September ranged from 34.00±1.85 to 37.00±2.02 and 38.44±1.98 to 41.08±2.24 individuals per branch through the first and second years, respectively. Thereafter, the total population was increased gradually to reach the first peak in November 10th in the first year (2016/2017) and in October 25th during the second year (2017/2018), when the population was 268.30±14.69 and 287.60±15.67 individuals per branch under field conditions at 32.00 and 34.70 °C, Max., 18.41 and 19.05 °C, Min., 31.94 and 30.73 % and 11.07 and 12.05 °C dew point for the first and second years, respectively. Followed by a gradual decrease for population when crawlers emerged after the egg laying period, their population decreased during several months due to mortality of pre-adult’s stage (nymphs) until reached to February 25th (minimum individuals per branch) during the two years. After that, The population density started to increase in March and then it highly increased continuously to reach the second peak in the May 10th with the mean numbers of 260.50±13.94 and 285.53±15.55 individuals per branch under field conditions at 34.40 and 33.71 °C, Max., 18.31 and 17.49 °C, Min., 19.38 and 20.14 % and 6.44 and 7.01 °C dew point for the first and second years, respectively. Moreover, the population gradually decreased in June until reached in August 25th during the two years is represented in Tables 1 & 2 and illustrated in Figures 1 & 2.
These results were partial coincided with those obtained by Abd El Kareim [31] in Egypt, however with different insect species and different host, they reported that C. floridensis had three peaks of abundance in blood orange, Loquat and mango orchards. The third peak was observed in October on orange and Loquat trees and November on mango orchard. Results showed that the mean total population per branch through the whole year was 110.18±9.39 and 114.06±9.71 individuals over first and second years, respectively. Over first year (2016/2017), the mean number of population per branch was 50.03±7.41, 28.86±4.19, 16.81±2.82, 95.70±10.21, 6.88±0.71 and 7.60±0.81 individuals and during the second year (2017/2018) was 56.41±8.34, 26.65±3.76, 14.90±2.35, 97.96±10.36, 7.20±0.73 and 8.89±0.98 were recorded on the first instar nymphs, second instar nymphs, third instar nymphs, pre-adults total, adult females and gravid females of W. mimosae, respectively are represented Tables 1 & 2. The obtained results cleared that the total population of this insect during the first year (2016/2017) was smaller in comparison to the second year (2017/2018). Also, the average annual fluctuation of W. mimosae total population during the second year (2017/2018) was higher (21.46) as compared with the first year (2016/2017) was (13.76) as calculated by dividing the maximum population of pest by the minimum one, which may due to the influence of environmental factors and the abundance of the natural enemies as recorded in Tables 1 & 2 and graphed in Figure 1 & 2. It appeared that, the annual fluctuations in the population density during the two years were affected by the variability in these physical factors in the both years of investigation.
The obtained results showed that there were three species of parasitoids and two species of predators were associated with the sunt wax scale insect, W. mimosae were surveyed. These parasitoids were, Scutellista caerulea (Hymenoptera: Pteromalidae), Anicetus africanus (Hymenoptera: Encyrtidae) and Microterys flavus (Hymenoptera: Encyrtidae). These predators were Scymnus coccivora (Coleoptera: Coccinellidae) and Eublemma scitula (Lepidoptera: Noctuidae). These results were coincided with those obtained by Morsi [32] in Egypt, studied that survey of C. Africanus natural enemies. Also, he found the same natural enemies abovementioned. The obtained results are Tables 1 & 2 and illustrated in Figures 1 & 2 also, showed that the highest population density of the first instar nymphs, the second instar nymphs, the pre-adults total, the gravid females and the total population of W. mimosae, were recorded in autumn and spring seasons (more active), thus may be due to the environmental conditions which were more suitable for the insect activity and however, the lowest population activity for these stages were observed in winter and summer months during the two years. While, the highest population density of the third instar nymphs and the adult females of W. mimosae were recorded in summer. But, the lowest population of the third instar nymphs was observed in autumn season and the adult females in spring months, may be due to the unsuitable environmental conditions. These results were coincided with those obtained by Bakr et al. [33] they found that the infestation with C. cirripediformis on guava trees a significant difference in the insect activity during autumn and winter.
The monthly incidence, averages of W. mimosae stages and their percentages out of the year total
Table 3: Sums, averages and the percentages from the overall year grand total of each stage of W. mimosae on sunt trees at Esna district, Luxor Governorate through the first year of (2016/2017).
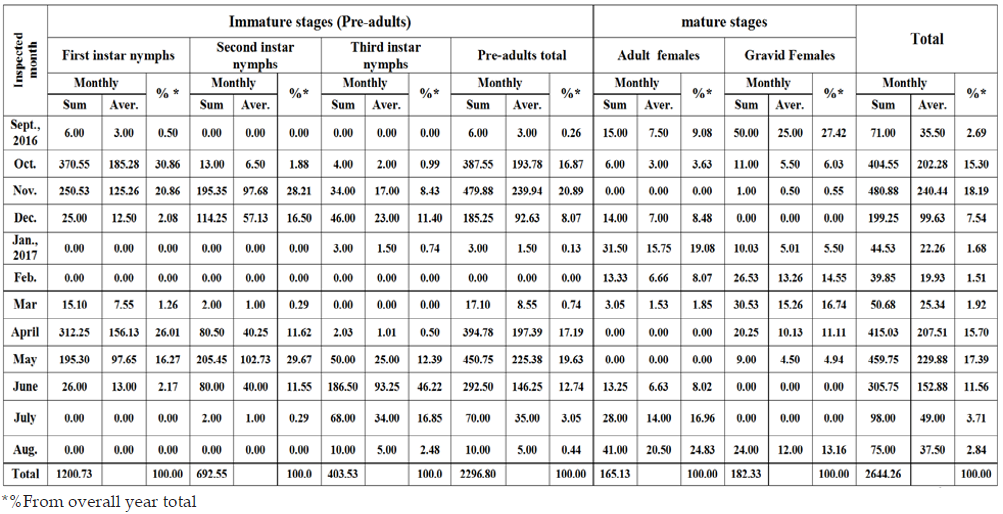
To facilitate comparisons within each year and from year to another, the seasonal population density of the above criteria, was expressed in terms of percent of individual numbers, in each inspected month, from the overall year grand total of each stage. This way done by pooling the collected individuals, over the inspected periods of each month. Then, relating the monthly sum to the overall year numbers, through the months of sampling period. Thus, the percent of individual numbers were used, to reflect the general trend of the population density is represented in Tables 3 & 4. Data recorded in Table 3, showed that the monthly sums of individual numbers, averages and the percentages from the overall year grand total of each stage of W. mimosae in the first year (2016/2017). Data clearly showed that the highest percentage of the first instar nymphs was (30.86 % from the grand total), the second instar nymphs (29.67 %), the third instar nymphs (46.22%), the pre-adults total (20.89%), the adult females (24.83%), the gravid females (27.42%) and the total population (18.19%) were recorded in October, May, June, November, August, September and November, respectively. In contrary, the lowest percentages (zero%) of the overall year count of the first instar nymphs were found in January, February, July and August, the second instar nymphs took place in September, January, February and August, the third instar nymphs were recorded in September, February and March, the pre-adults total were observed in February, the adult females took place in November, April and May, the gravid females were recorded in December, June and July and the total mixed population of pest exhibited the lowest percentages were observed in winter (September, January and February) and summer months (July and August).
Table 4: Sums, averages and the percentages from the overall year grand total of each stage of W. mimosae on sunt trees at Esna district, Luxor Governorate through the second year of (2017/2018).
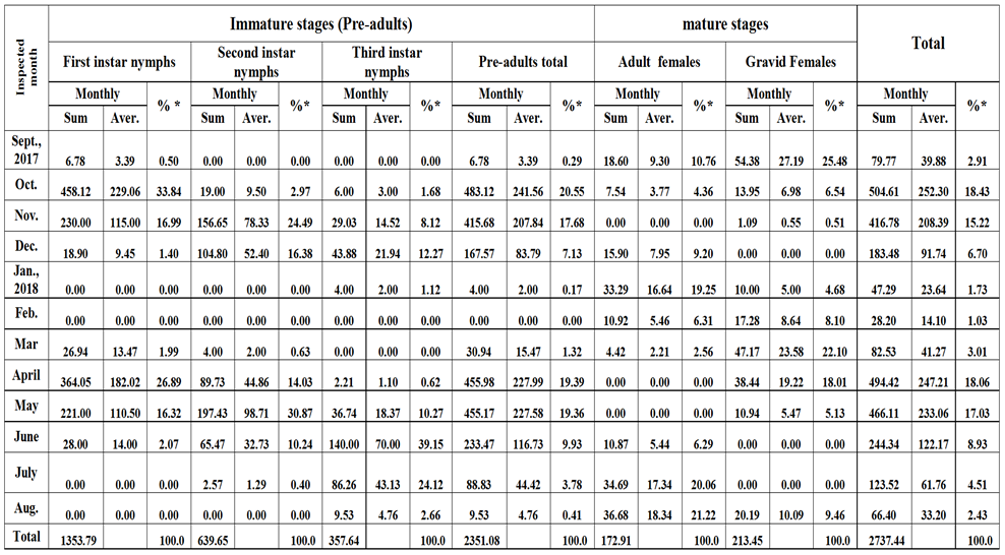
As regarding in data represented in Table 4, showed that in the second year (2017/2018) the highest percentage of the overall year count of the first instar nymphs was (33.84% from the grand total), the second instar nymphs (30.87%), the third instar nymphs (39.15%), the pre-adults total (20.55%), the adult females (21.22%), the gravid females (25.48%) and total population (18.43%) were took place in October, May, June, October, August, September and October, respectively. Moreover, the lowest percentages of the overall year count (zero%) of the first instar nymphs were recorded in January, February, July and August, the second instar nymphs were found in September, January, February and August, the third instar nymphs took place in September, February and March, the pre-adults total were recorded in February, the adult females took place in November, April and May, the gravid females were found in December, June and July and the total mixed population of pest exhibited the lowest percentages were recorded in winter (September, January and February) and summer months (July and August), may be thus due to the environmental conditions which were unsuitable for the insect activity.
The aforementioned results showed also that the overall year grand total of this phytophagous pest (i.e. total population of pest) during the first year (2016/2017) was smaller as compared with the second year (2017/2018). As well as, the highest percentages of the overall year count of total population of pest were took place in November during the first year and October through the second year and its lowest was observed in February month (this referred to the cold weather) during the two years. Meantime, the year grand total of the pre-adult’s total, the adult females and the gravid females during the first year was lower than that recorded through the second year. These results may be ascribed to the differences of the environmental conditions, especially, temperature and relative humidity and or the abundance of natural enemies, or to other factors prevailing through the year under the climatic conditions in Luxor Governorate. On the other hand, although the population density of different stages and total population of pest had different levels of abundance through the two years, the trend of the population oscillations in the two years was similar.
Rate of monthly variation (R.M.V.P.) in the population of the guava long scale insect, W. mimosae
The monthly variation rates in the population of different stages and total population of W. mimosae were calculated as recorded in Table 5. The rate of monthly variation in the population is considered an indicator to the favorable month for insect activity expressed as monthly the increase of this insect population through the year. When R.M.V.P. is > 1 it means more activity, < 1 means less activity and = 1 means no change in the population density during the two successive months [20]. It was shown as recorded in Table 5 that the favourable times of annual increase for first instar nymphs appeared to be in October and April when, the rates of monthly variation were (61.76 and 20.68) for the first year (2016/2017) and (67.53 and 13.51) through the second year (2017/2018), respectively. Also, for the second instar nymphs it was shown that the favorable times of annual increase observed to be in November, April and May, when the rates of monthly variation were (15.03, 40.25 and 2.55) in the first year and (8.24, 22.43 and 2.20) during the second year, respectively. Moreover, the rates of monthly variation (R.M.V.P) for the third instar nymphs showed that the favourable times for annual increase occurred in November, December, May and June, when the rates of monthly variation were (8.50, 1.35, 24.69 and 3.73) during the first year and (4.84, 1.51, 16.64 and 3.81) through second year, respectively. As well as, the rates of monthly variation (R.M.V.P) for the pre-adult’s total showed that the favourable times for annual increase seemed to be in October, November, April and May during the first year, when the rates of monthly variation were (64.59, 1.24, 23.09 and 1.14), respectively. But, the second year occurred in October, April and May, when the rates of monthly variation were (71.21, 14.74 and 1.00), respectively. As for the adult females, it was shown that the favourable times for annual increase appeared to be in January, July and August, when the rates of monthly variation were (2.25, 2.11 and 1.46) through the first year and (2.09, 3.19 and 1.06) during the second year, respectively.
Table 5: Rate of monthly variation (R.M.V.P) in the mean number of W. mimosae counted on sunt trees at Esna district, Luxor Governorate through the two years of (2016 to 2018).
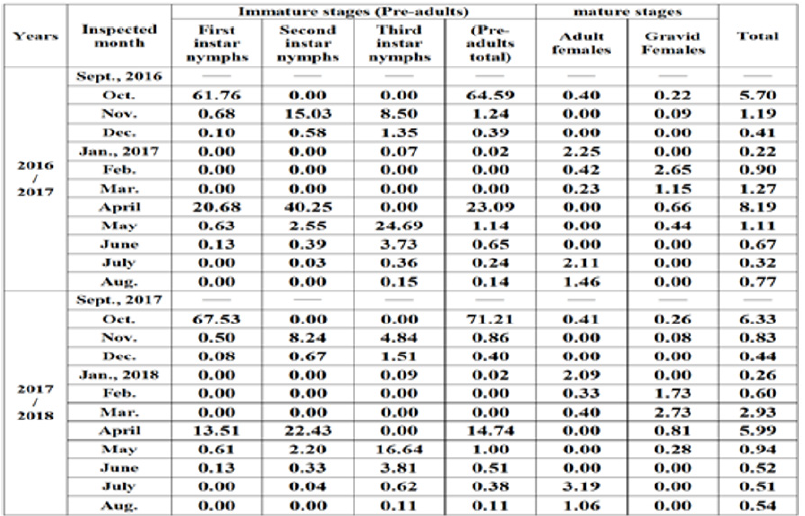
Furthermore, the rates of monthly variation (R.M.V.P) for the gravid females showed that the favourable times for annual increase recorded in February and March, when the rates of monthly variation were (2.65 and 1.15) during the first year and (1.73 and 2.73) for the second year, respectively. Concerning the rates of monthly variation (R.M.V.P) for the total population of pest, it could be concluded that the favourable times for annual increase appeared to be in October, November, March, April and May, during the first year (2016/2017), when the rates of monthly variation were (5.70, 1.19, 1.27, 8.19 and 1.11), respectively. While, the second year (2017/2018), it took place in October, March and April, when the rates of monthly variation were (6.33, 2.93 and 5.99), respectively in Table 5. Generally, it seems that autumn and spring months were the most favourable periods for activity of the first instar nymphs, the second instar nymphs, the third instar nymphs, the pre-adults total and total population of W. mimosae. While, and adult females was more active during winter and summer months. But, the gravid females were maximum activity during February and March months during the two years under the climatic conditions at Esna district, Luxor Governorate. These results were in agreement with those obtained by Swailem et al. [34] and El-Emery et al. [23] who mentioned that C. floridensis had also the highest favorable period in September and October during the two studied years.
Estimation of insect age-structured population for W. mimosae inhabiting branches of the sunt tree
Figure 3: Age-frequencies data for population of different stages of W. mimosae on sunt trees at Esna district, Luxor Governorate, during the two successive years of (2016/2017 and 2017/2018).
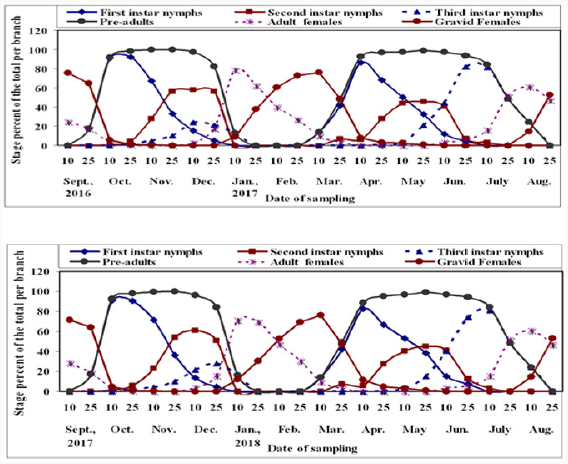
The study of the dynamics of natural biological population is often hampered by the difficulty of determining the ages of individual Manly, 1990. However, the age structure technique for W. mimosae were determined in this study on sunt trees during the two years of (2016/2017 and 2017/2018) are illustrated in Figure 3. The age-structured population of W. mimosae showed a total population of 2644.26 and 2737.44 individuals in (2016-2017 and 2017-2018), respectively. The first instar nymphs were represented by 1200.73 and 1353.79 individuals per branch (45.41 and 49.45% of the total population) during the two years, respectively. On the other hand, the second instar nymphs were represented by 692.55 and 639.65 individuals per branch (26.19 and 23.37 % of the total population) in 2016-2017 and 2017-2018, respectively. Moreover, the third instar nymphs were represented by 403.53 and 357.64 individuals per branch (15.26 and 13.06% of the total population) during the two years, respectively. As well as, the pre-adult total population was represented by 2296.80 and 2351.08 individuals per branch (86.86 and 85.89 % of the total population) during the two years, respectively. But, the adult females were represented by 165.13 and 172.91 individuals per branch (6.24 and 6.32 % of the total population) during the two years of the study, respectively. However, the gravid females were represented by 182.33 and 213.45 individuals per branch (6.90 and 7.80% of the total population) in the two years of investigation, respectively. The percentages of the age-structure population of this insect species, during both years of study, were almost similar.
The obtained results illustrated in Figure 3, showed that the highest percentage of the first instar nymphs (91.96 and 91.30%) was observed in October 25th and October 10th during the two years, respectively. Whereas, the lowest one (0%) was recorded during September 10th, January, February, July and August months in the both years of study. In case, the highest percentage of the second instar nymphs (57.82 and 60.86%) was recorded in December 10th in the both years, whereas, the lowest percentage (Zero %) was recorded during September, from January to March 10th and from June 25th to August 25th were recorded during the two years. On other hand, the highest percentage of third instar nymphs (81.97 and 80.95%) was observed in June 25th and July 10th during the first and second years, respectively. Whereas, the lowest one (Zero %) was recorded during from September 10th to October 10th, from January 25th to April 10th and in August 25th were took place during the two years. Moreover, the highest percentage of the pre-adult’s total population (100%) was observed in November 25th during the two years of study. Whereas, the lowest one (0%) was recorded during September 10th, from January 25th to February 25th and in August 25th, were recorded during the two years.
As for the adult females, the highest percentage of (78.49 and 71.18%) was observed in January 10th during the two years. Whereas, the lowest one (Zero %) was recorded during November, April and May months during the two years. As well as, the highest percentage of the gravid females (76.20 and 76.19 %) was shown in March 10th in the both years. Whereas, the lowest one (Zero %) was observed during from November 25th until December 25th, in June and July months during the two years. Also, the percentages of the age-structure population of W. mimosae species, during the both two years, were almost similar. However, the insect age-structured population was considerably differed among between months and between the two years. These results may be attributed to the differences of environmental factors that prevailing during the two years. Metcalf and Luckmann [35] reported that certain environmental conditions may alter the physiology of the plant to the extent that it becomes suitable or unsuitable as a host for a certain pest. Dent [36] stated that the seasonal phenology of insect numbers, the number of generations and the level of insect abundance at any location are influenced by the environmental factors at that location.
These data reflect the changing frequencies in the population. Such data might be a matter of comparing the population dynamics of different stages in the same region. Often, such data are collected to aid in pest management. It is of the utmost important to the pest management philosophy to determine how and when pesticides can be most effective and harmonious in pest management programme. So, the effective control of W. mimosae first generation is an essential part of the annual control strategy applied to sunt trees. Accurate informations about the population size, seasonal fluctuation and occurrence of annual generations are therefore, necessary to plan economically optimal chemical application strategies for growing years. Also, counts of immature stages and forecasting of their size, time of occurrence and environmental factors prevailing during the sunt trees would clearly be of a great valuable.
Number of annual generations’ determination of W. mimosae
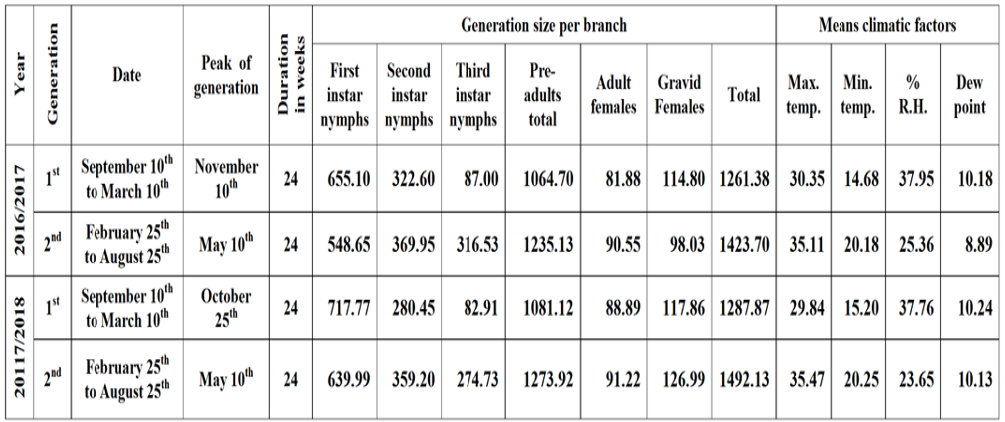
Obtained trend over both years indicated the occurrence of two overlapping generations per year for W. mimosae on sunt trees at Esna district, Luxor Governorate are represented in Table 6.
a) First generation (autumn)
The first generation started in September 10th and extended until March 10th in the both years and its duration 24 weeks per year under field conditions at 30.35 and 29.84 °C, Max., 14.68 and 15.20 °C, Min., 37.95 and 37.76% and 10.18 and 10.24 °C dew point for the first and second years, respectively. The generation peaked in November 10th and October 25th during the two years, respectively. The generation density was (655.10, 322.60, 87.00, 1064.70, 81.88, 114.80 and 1261.38 individuals per branch) and (717.77, 280.45, 82.91, 1081.12, 88.89, 117.86 and 1287.87 individuals per branch) were recorded on the first instar nymphs, the second instar nymphs, the third instar nymphs, the pre-adults total, the adult females, the gravid females and the total population of pest for the first and second year, respectively.
b) Second generation (spring)
The second generation occurred between the period from February 25th to August 25th in the two years and covered a period of 24 weeks per year under field conditions at 35.11 and 35.47°C, Max., 20.18 and 20.25°C, Min., 25.36 and 23.65% and 8.89 and 10.13 °C dew point for the first and second years, respectively. The generation peaked in May 10th during the two years. The generation size with mean number of (548.65, 369.95, 316.53, 1235.13, 90.55, 98.03 and 1423.70 individuals per branch) and (639.99, 359.20, 274.73, 1273.92, 91.22, 126.99 and 1492.13 individuals per branch) were recorded on the first instar nymphs, the second instar nymphs, the third instar nymphs, the pre-adults total, the adult females, the gravid females and the total population of pest for the first and second year, respectively, (Table 6). From the previously mentioned results, it could be concluded that the population density was varied from generation to another, which may be due to the influence of favorable factors (such as environmental conditions.). In general, the second generation (spring generation) in the two years, which started in both of them from February 25th to August 25th was the biggest one in size with mean number of 1423.70 and 1492.13 individuals per branch than that the first generation (autumn generation) with mean number of 1261.38 and 1287.87 individuals per branch during the two years, respectively. This evidence may be due to the different fluctuations of climatic factors. In both years, the two overlapping generations could be arranged according to their size in the following order as follows:
First > second generation for the two years of study.
Table 6: Approximated number, duration and size of W. mimosae generations recorded on sunt trees under field conditions at Esna district, Luxor Governorate during the two years of (2016/2017 and 2017/2018).
Most authors indicated two or three generations per year for Ceroplastes sp. depending on the area, environmental conditions and the host plant worldwide. In this respect, in Egypt, however with different insect species and different host, Habib et al. [37] who found that C. floridensis had two generations annually (May-June) and (September-October). Also, El-Emery et al. [23] mentioned that this pest had two annual generations during the two seasons on Mandarine trees at Qaliobia governorate. Morsi and Mousa [38] they found that C. rusci has 2-3 peaks annually. Bakr et al. [20] they reported that C. cirripediformis had two generations per year on guava trees in mid-February and November. Morsi [31] in Egypt, reported that the wax scale insect, C. africanus had three generations on sunt trees, were recorded in June 20th, October 20th and March 20th for the first year (2006/2007) and two generations through the second year (2007/2008) were observed on July 20th, November 20th. So, the proper time for its control would be carried by application the recommended pesticides either in spring or autumn season to save sunt trees form insect infestation.
Spatial distribution pattern
Sampling program
The obtained values in Table 7 showed that the relative variation (R.V.) for the primary sampling data of different stages and the total population of W. mimosae ranging from (10.67 to 33.90 %) for the pre-adults stage, (10.28 to 32.29%) for the adult females, (10.26 to 34.79%) for the gravid females and (8.52 to 19.79%) for total population of pest were recorded in all seasons of year and on the over year and was very appropriate for a sampling program through the first year. But, during the second year, the relative variation was (10.58 to 30.35 %) for the pre-adults stage, (10.11 to 30.52%) for the adult females, (11.06 to 33.60%) for the gravid females and (8.52 to 17.80%) for total population of pest were observed in all seasons of year and on the whole year and which was counted as very appropriate for a sampling program in Table 8. It is clear from the results that the lowest values for the relative variation (R.V.) was (8.52%) for the total population of W. mimosae were recorded on the over year in each year of the studies years. Naeimamini et al. [39] however with different insect species and different host, also stated that the relative variation for the primary sampling data of different stages of Pulvinaria floccifera (Hemiptera: Coccidae) were less than 25% and were acceptable.
Distribution indices
The obtained results in Tables 7 & 8 showed that the spatial
distribution among the sample units was determined by fourteen
indices of distribution. The results of distribution with using the
variance to- mean (S2/̄ ) was >1, by using Index of mean clumping
(IDM) was positive value for negative binomial, using Z test > 1.96,
by using index of patchiness ( /̄ ) was >1 and with using
green’s index (GI) was > 0 and positive values. All these indices of
dispersion indicated were aggregated distribution for all different
stages and total population of W. mimosae in all seasons of the year
and on the over year during the two years of study. Nestel et al. [40]
however with the same genus of insect and different host, they
suggested that the spatial distribution of P. oleae was discerned
aggregate. Moradi-Vajargah et al. [17] reported that the aggregated
distribution suggests that the presence of an individual at one point
leads to an increased probability of another individual being close.
Table 7: Estimated parameters for spatial distribution of different stages of W. mimosae infesting sunt trees during the first year of (2016/2017).
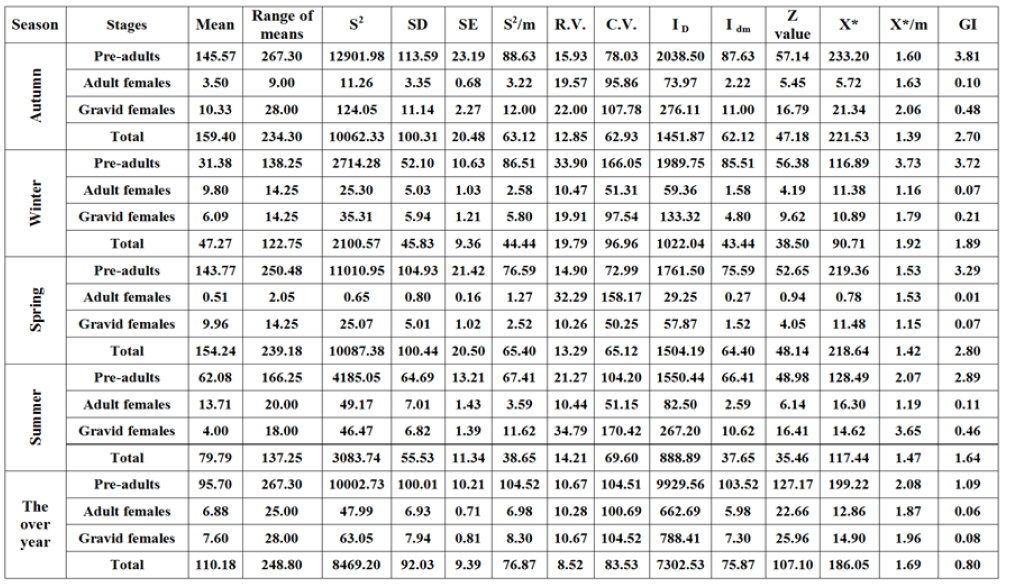
Table 8: Estimated parameters for spatial distribution of different stages of W. mimosae infesting sunt trees during the second year of (2017/2018).
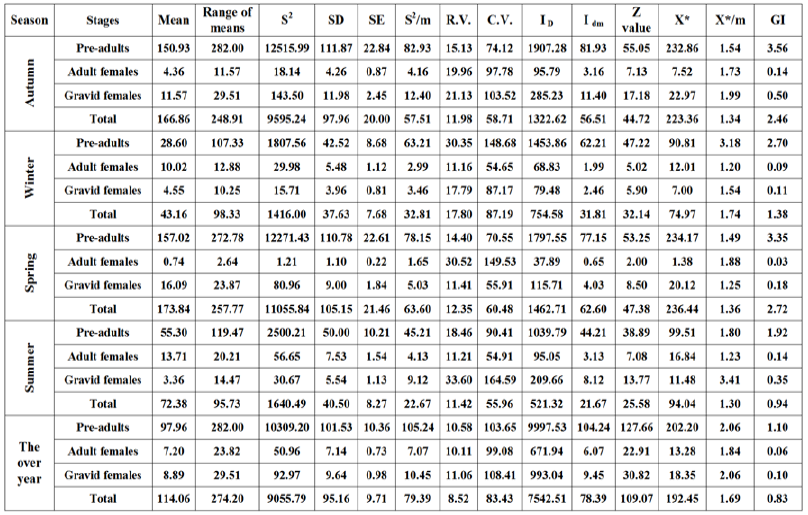
The lowest values for the variance to- mean (S2/̄), the index of dispersion (ID), the index of mean clumping (IDM), the Z value, and the green’s index (GI) were recorded on adult females of W. mimosae as compared with the other different stages of W. mimosae when the comparison was directed for each season separately, during the two years of study. On the contrary, the pre-adults of W. mimosae were exhibiting the highest one in these measured parameters of distribution in all seasons of the year and on the over year during the two years of study (Tables 7 & 8). Similarly, however with different values that the adult females of W. mimosae were exposed the lowest values in all indices of dispersion (14 models) when the comparison was directed for the combined effect on the whole year, during the two years of study (Tables 7 & 8). In contrary, the pre-adults of W. mimosae were exhibiting the highest one in most measured parameters of distribution during the two years of study (Tables 7 & 8). These results agree with that obtained by Southwood [41] stated that the higher the variance to mean ratio, the greater the extent of aggregation. Siswanto et al. [42] however with different insect species and different host, also suggested that when the population of Helopeltis antonii (Signoret.) (Hemiptera: Miridae) was high, the insects tend to aggregation. Chellappan et al. [43] stated that the value of mean crowding increased with the increase in mean population density of Paracoccus marginatus (Hemiptera: Pseudococcidae).
In general, the differences in our values may be due to the differences are at least partly caused by the population density of pest and environmental conditions such as weather and ventilation. Other studies have used these indexes to determine the distribution pattern of insect pest population in different crops [44- 48]. Generally, the all models of dispersion indices to estimate the spatial distribution of pest, exhibited an aggregative distribution and follows a negative binomial distribution pattern for all alive different stages and total population of W. mimosa.
References
- Mohammad ZK, FA Moharum (2013) Key to the species of Family: Coccidae in Egypt (Hemiptera: Coccoidea: Coccidae) Egypt Acad J Biolog Sci 6(2): 145-158.
- Priesner H, M Hosny (1940) Notes on parasites and predators of Coccidae and Aleurodidae in Egypt. Bulletin de la Société Fouad 1er d’Entomologie pp. 24: 58-70.
- Annecke DP (1967) The genera Anicetus Howard, 1896 Paracerapterocerus Girault, 1920, and allies, with descriptions of new genera and species (Hymenoptera: Encyrtidae). Transactions of the Royal Entomological Society of London 119: 99-169.
- Almeida DMDe (1973) Coccoidea de Angola Revisao das especies conhecidas. Boletim do Instituto de Investigaçao Cientifica de Angola 10: 1-23.
- Balachowsky AS, D Matile Ferrero (1971) Les Cochenilles (Hom., Coccoidea) de la République Islamique de Mauritanie. Contribution à l’étude des Coccoidea de l’Afrique tropicale et équatoriale (14e note). Bulletin de l’Institut fondamental d’Afrique noire, série A 32 (4): 1078- 1087.
- Balachowsky AS (1934) Les coccides du Sahara central. Mission du Hoggar. III (Février à mai 1928). In: Seurat LG, Etudes zoologiques sur le Sahara central. Mémoires de la Société d’Histoire Naturelle de l’Afrique du Nord 4: 145-157.
- Matile Ferrer OD (1988) Sternorrhyncha: Suborder Coccoidea of Saudi Arabia (Part 2) Fauna of Saudi Arabia 9: 23-38.
- Ben Dov Y, E Guerrieri (2009) Waxiella mimosae (Signoret) (Hemiptera, Coccoidea, Coccidae) and its parasitoid Anicetus africanus (Girault) (Hymenoptera, Encyrtidae) newly recorded from Israel. Bulletin de la Société entomologique de France 114(1): 83-89.
- Argov Y, H Podoler, O Bar Shalom, D Rosen (1987) Mass rearing of the Florida wax scale, Ceroplastes floridensis, for production of natural enemies. Phytoparasitica 15: 277-287.
- Hodges GS, JR Ruter, SK Braman (2000) Susceptibility of Ilex species, hybrids and cultivars to Florida wax scale. Journal of Environmental Horticulture 19(1): 32-36.
- Hall WG (1922) Obsevations on the Coccidae of Egypt. Tech and Sci Serv Min Agric, Egypt Bull. 22: 1-54.
- Debouzie D, J Thioulouse (1986) Statistics to find spatial and temporal structures in populations. In: Mangel M (ed) Pest control: operations and systemanalysis in fruit flymanagement, vol G11, NATO ASI Series. Springer, Berlin, pp. 263-282.
- Binns MR, JP Nyrop, W Werf (2000) Sampling and monitoring in crop protection: the theoretical basis for developing practical decision guides. CABI Publishing, UK.
- Khaing O, P Hormchan, S Jamornmarn, A Wongpiyasatid (2002) Spatial dispersion and optimum sample size for cotton bollworm, Helicoverpa armigera (Hubner) (Lepidoptera: Noctuidae) larvae on cotton. Kasetsart J (Nat Sci) 36: 235-241.
- Southwood TRE (1995) Ecological methods, with particular reference to the study of insect population Chapman and Hall, London.
- Trumble JT, JV Edelson, RN Story (1987) Conformity and incongruity of selected dipersion indicies in describing the spatial distribution of Trichoplusia ni (Hubner) in geographically separate cabbage plantings. Res Popul Ecol 29: 155-166.
- Moradi-Vajargah M, A Golizadeh, H Rafiee Dastjerdi, MP Zalucki, M Hassanpour et al. (2011) Population density and spatial distribution pattern of Hypera postica (Coleoptera: Curculionidae) in Ardabil, Iran Not Bot Horti Agrobo 39(2): 42-48.
- Feng MG, RM Nowierski, Z Zeng, AL Scharen (1993) Estimation of population density of the Russian wheat aphid (Homoptera: Aphididae) from the proportion of grain tillers with the different tally threshold of aphids. J of Econ Entomol 86: 427-435.
- Darbemamieh M, Y Fathipour, K Kamali (2011) Population abundance and seasonal activity of Zetzellia pourmirzai (Acari Stigmaeidae) and its preys Cenopalpus irani and Bryobia rubrioculus (Acari: Tetranychidae) in sprayed apple orchards of Kermanshah, Iran. J Agri Sci Tech 13: 143- 154.
- Bakry MMS (2009) Studies on some scale insects and mealybugs infesting mango trees in Qena Governorate. MSc Thesis, Fac Agric Minia Univ pp. 204.
- Bakry MMS (2014) Studies on the white date palm scale insect, Parlatoria blanchardii (Targ) infesting date palm trees in Luxor Governorate. PhD Thesis, Fac Agric Sohag Univ pp. 288.
- Serag El Din AM (2005) Ecological and toxicological studies on some pests attacking fig trees in Egypt. PhD Thesis, Fac Sci Ain Shams Univ, Egypt, pp. 234.
- El Emery S, A El Sisi, N Hassan, E Helmy (1995) Evaluation of two new local miscible oil in comparison to recommended oil against Coccid infesting citrus in Delta and middle Egypt. 1st Int Conf of pest control, Mansoura, Egypt, pp. 237-242.
- Badr SA (2014) Seasonal activity of the pine scale, Leucaspis pusilla Löw (Hemiptera: Diaspididae) on Aleppo pine trees, Pinus halepensis at Alexandria, Egypt. Acad J Biolog Sci 7(1): 153-164.
- Myers JH (1978) Selecting a measure of dispersion. Environ Entomol 7: 619-621.
- Soemargono A, M Muryati, A Hasyim, M Istianto (2011) Spatial distribution pattern of the fruit fly, Bactrocera dorsalis complex (Diptera: Tephritidae) in mango orchard. J Agric Sci 33: 207-213.
- Hillhouse TL, HN Pitre (1974) Comparison of sampling techniques to obtain measurements of insect populations on soybeans. J Econ Entomol 67(3): 411-414.
- David FN, PG Moor (1954) Notes on contagious distribution in plant populations, Ann Bot 18: 47-53.
- Lloyd M (1967) Mean crowding. J Animal Eco 36: 1-30.
- Green RH (1966) Measurement of non-randomness in spatial distribution. Res. Population Ecol 8: 1-17.
- Abd El Kareim AI, ME El Naggar, WMM EL Baradey (2012) Host plant scale insect, Florida wax scale, Ceroplastes floridensis (Comst) interaction. J Plant Prot and Path, Mansoura Univ 3 (9): 967-977.
- Morsi GA (2010) Seasonal abundance of the sunt wax scale insect, Ceroplastes africanus (Green) (Homoptera: Coccidae) and its parasitoids in Upper Egypt. Egyptian J of Biological pest control 20(2): 135-138.
- Bakr RFA, RM Badawy, LS Hamooda, E Helmy, SA Attia (2010) Taxonomic and ecological studies on the new record, Ceroplastes cirripediformis Comstock, 1881, (Coccidae: Homoptera) at Qaliobiya governorate. Egypt. Acad J biolog Sci 3 (2): 119-132.
- Swailem S (1976) Population studies on the citrus wax scale insect, Ceroplastes floridensis Comstock, in different region in Egypt (Homoptera: Coccidae) Bull Soc Ent Egypt, pp. 230-237.
- Metcalf RL, WH Luckmann (1975) Introduction to insect pest management. John Wiley& Sons, Inc New York, USA, pp. 587.
- Dent D (1991) Insect Pest Management. CAB International.
- Habib A, HS Salama, AH Amin (1971) Population studies on scale insects infesting citrus trees in Egypt. Z ang Ent 69(3): 318-330.
- Morsi G, S Mousa (2003) Seasonal abundance of the fig wax scale Ceroplastes rusci L. and its parasitoids in middle Egypt. Plant protection institute agriculture Research Center Giza Egypt pp. 1-10.
- Naeimamini S, H Abbasipour, S Aghajanzadeh (2014) Spatial distribution of the cottony camellia scale, Pulvinaria floccifera (Westwood) (Hemiptera: Coccidae) in the tea orchards. J of Plant Prot Res 54 (1): 44-52.
- Nestel D, H Cohen, N Saphir, M Klein, Z Mendel (1995) Spatial distribution of scale insects: comparative study using Taylors Power Law. Environmental Entomology 24(3): 506-512.
- Southwood TRE (1978) Ecological methods with particular reference to the study of insect populations. 2nd edn Chapman and Hall, London, pp. 524.
- Siswanto RM, D Omar, E Karmawati (2008) Dispersion pattern of Helopeltis antonii (Signoret) (Hemiptera: Miridae) on cashew plantation. Indonesian J Agri 1(2):103-108.
- Chellappan M, L Lawrence, P Indhu, T Cherian, S Anitha et al. (2013) Host range and distribution pattern of papaya mealy bug, Paracoccus marginatus Williams and Granara de Willink (Hemiptera: Pseudococcidae) on selected Euphorbiaceae hosts in Kerala Journal of Tropical Agriculture 51(1-2): 51-59.
- Sedaratian A, Y Fathipour, AA Talebi, S Farahani (2010) Population density and spatial distribution pattern of Thrips tabaci (Thysanoptera: Thripidae) on different soybean varieties. J Agri Sci Tech 12(3): 275-288.
- Arbab A (2014) Spatial distribution and minimum sample size for Overwintering Larvae of the Rice Stem Borer, Chilo suppressalis (Walker) in paddy fields. Neotrop Entomol 43(3): 415-420.
- Elwan EA, MI El Sayed, AM Serag (2011) Seasonal activity of Fiorinia date scale, Fiorinia phoenicis Balachowsky (Hemiptera: Diaspididae) on date palm trees at Giza Governorate. Egypt J Agric Res 89(2): 549-565.
- M Anly BFJ (1990) Stage Structured Populations: Sampling Analysis and Simulation. Chapman and Hall, London and New York, USA.
- Salah Ghada MF (2005) Studies on Certain Coccoids (Homoptera: Coccoidea) infesting ornamental plants in Assiut MSc. Thesis, Fac Agric, Assiut Univ, pp. 148.

Top Editors
-

Mark E Smith
Bio chemistry
University of Texas Medical Branch, USA -

Lawrence A Presley
Department of Criminal Justice
Liberty University, USA -

Thomas W Miller
Department of Psychiatry
University of Kentucky, USA -

Gjumrakch Aliev
Department of Medicine
Gally International Biomedical Research & Consulting LLC, USA -

Christopher Bryant
Department of Urbanisation and Agricultural
Montreal university, USA -

Robert William Frare
Oral & Maxillofacial Pathology
New York University, USA -

Rudolph Modesto Navari
Gastroenterology and Hepatology
University of Alabama, UK -

Andrew Hague
Department of Medicine
Universities of Bradford, UK -

George Gregory Buttigieg
Maltese College of Obstetrics and Gynaecology, Europe -

Chen-Hsiung Yeh
Oncology
Circulogene Theranostics, England -
.png)
Emilio Bucio-Carrillo
Radiation Chemistry
National University of Mexico, USA -
.jpg)
Casey J Grenier
Analytical Chemistry
Wentworth Institute of Technology, USA -
Hany Atalah
Minimally Invasive Surgery
Mercer University school of Medicine, USA -

Abu-Hussein Muhamad
Pediatric Dentistry
University of Athens , Greece

The annual scholar awards from Lupine Publishers honor a selected number Read More...


